Tag: Cryptocurrency Trading

  • Solana Price Risks 12% Drop as Key Support Tests $152 Level

    Solana Price Risks 12% Drop as Key Support Tests $152 Level

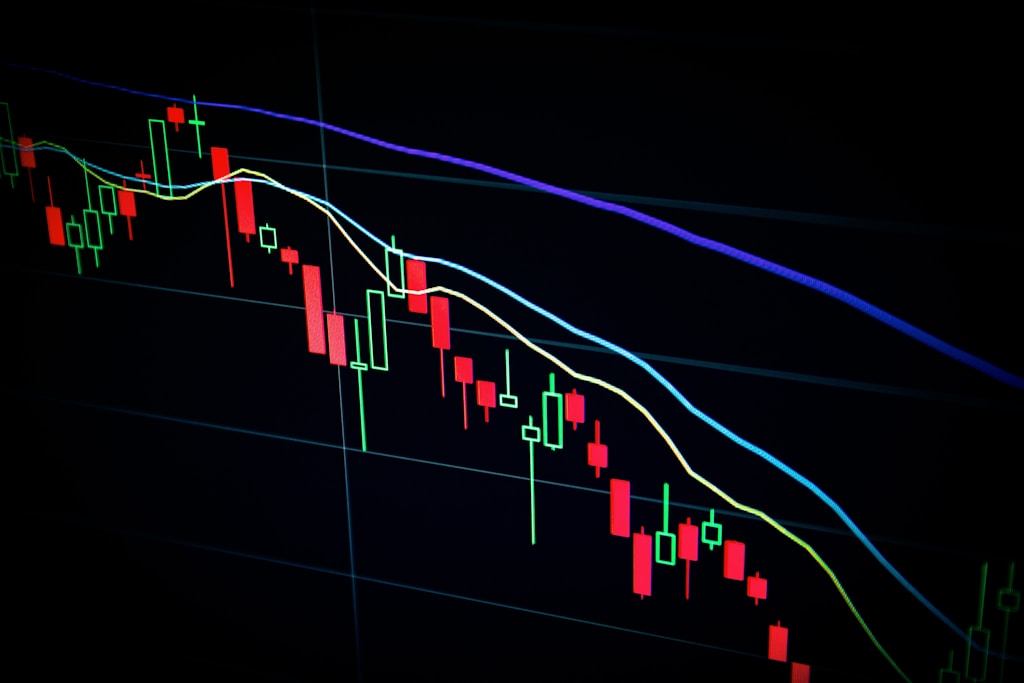
    Solana (SOL) faces mounting bearish pressure as the cryptocurrency tests critical support at $152, with technical analysis suggesting a potential 12% decline to $142. The broader crypto market cooldown has significantly impacted SOL’s momentum after its impressive performance earlier this year.

    Top crypto analyst Carl Runefelt has identified a concerning bear flag pattern forming around SOL’s horizontal support zone. This technical formation, combined with weakening market fundamentals, points to increased downside risk in the near term. As Bitcoin’s recent 9% decline to $105,000 continues to pressure the broader altcoin market, Solana traders are closely monitoring key support levels.

    SPONSORED

    Trade Solana with up to 100x leverage on perpetual contracts

    Trade Now on Defx

    Technical Analysis Points to Further Downside

    The 4-hour chart reveals a clear deterioration in SOL’s technical structure:

    • Current price: $152.62
    • Critical support zone: $150-152
    • Key resistance: $160
    • Bearish target: $142
    • All major moving averages trending below price

    The recent rejection from the $176-180 area has established a series of lower highs and lower lows, confirming the bearish momentum. Volume analysis shows increasing selling pressure as price approaches support, suggesting further downside potential.

    Macro Factors Weighing on Sentiment

    Several macro factors are contributing to the current market uncertainty:

    • US-China trade tensions
    • Rising bond yields
    • Global market volatility
    • Crypto market correlation with traditional risk assets

    Despite these short-term headwinds, institutional interest in Solana remains strong, with over $1 billion in recent institutional inflows suggesting long-term confidence in the network’s fundamentals.

    Key Levels to Watch

    Traders should monitor these critical price levels:

    Level Significance
    $160 Major resistance
    $152 Current support
    $142 Bear flag target

    FAQ

    Q: What could invalidate the bearish setup?
    A: A decisive break above $160 would invalidate the bear flag pattern and potentially trigger a bullish reversal.

    Q: How low could SOL go if support fails?
    A: The technical target of the bear flag pattern suggests a move to $142, representing a 12% decline from current levels.

    Q: What are the key indicators to watch?
    A: Monitor the 34 EMA ($157.70), 50 SMA ($159.82), and volume patterns for confirmation of price direction.

  • Ethereum Price Pattern Mirrors Bitcoin’s 2020 Breakout – 15% Rally Ahead?

    Ethereum Price Pattern Mirrors Bitcoin’s 2020 Breakout – 15% Rally Ahead?

    Ethereum (ETH) is showing remarkable strength above $2,500, with technical patterns suggesting a potential major breakout ahead. Recent analysis indicates a possible 15% surge if key resistance levels are breached, mirroring Bitcoin’s historic 2020 price action that preceded its legendary bull run.

    Technical Analysis Points to Historic Pattern Repeat

    According to prominent analyst Ted Pillows, Ethereum has printed four consecutive two-week green candles since bottoming, creating a formation strikingly similar to Bitcoin’s structure following the March 2020 crash. That pattern preceded BTC’s eventual surge to $69,000, raising speculation about ETH’s potential to follow a similar trajectory.

    SPONSORED

    Trade Ethereum with up to 100x leverage on perpetual contracts

    Trade Now on Defx

    Key Price Levels and Market Structure

    ETH currently consolidates above $2,600, maintaining strength despite global macro headwinds. The critical support zone lies between $2,590-$2,600, with the 50-period SMA providing additional technical backing. A breakthrough above $2,680 could trigger acceleration toward $2,800 and beyond.

    Macro Factors and Market Sentiment

    While concerns about US dollar stability persist, Ethereum continues to attract institutional interest. The combination of technical strength and fundamental developments suggests growing confidence in ETH’s long-term prospects.

    FAQ Section

    What makes the current Ethereum pattern similar to Bitcoin’s 2020 setup?

    The four consecutive two-week green candles and similar market structure following a bottom formation mirror Bitcoin’s pattern before its major breakout.

    What are the key resistance levels to watch?

    The immediate resistance lies at $2,680, with $2,800 serving as the next major target. Breaking these levels could trigger significant upside momentum.

    What could prevent Ethereum from following Bitcoin’s 2020 trajectory?

    Macro risks, including US Treasury yields and global trade tensions, could impact crypto market sentiment and prevent a similar breakout scenario.

  • Dogecoin Price Crashes Below $0.20: Technical Analysis Reveals Next Moves

    Dogecoin Price Crashes Below $0.20: Technical Analysis Reveals Next Moves

    The cryptocurrency market witnessed a significant development as Dogecoin (DOGE) experienced a notable price decline, breaking below the crucial $0.20 support level following Bitcoin’s retreat from $104,000. This technical analysis deep-dive examines the key factors behind this movement and what traders can expect next.

    Understanding the Recent DOGE Price Action

    As previously predicted by analysts tracking critical triangle patterns, Dogecoin’s price structure has shown signs of weakness. Crypto analyst Smart Flows from TradingView has identified a crucial 4-hour order block (OB) development that explains the recent price action.

    Technical Breakdown of the Liquidity Sweep

    The price movement can be broken down into several key components:

    • Initial support break at $0.22 price level
    • Liquidity sweep through the Fair Value Gap (FVG)
    • Break of psychological $0.20 support
    • Reset of market sentiment indicators

    SPONSORED

    Trade DOGE with up to 100x leverage on perpetual contracts

    Trade Now on Defx

    Critical Price Levels to Watch

    Traders should focus on these key price levels:

    • Primary resistance: $0.20928 (key reaction point)
    • Secondary resistance: $0.22094 (4-Hour order block)
    • Support level: $0.18000
    • Critical support: $0.16387 (deeper 4H OB)

    Potential Scenarios and Trading Implications

    Two primary scenarios are emerging:

    Bullish Case

    A successful clearance of the FVG above $0.20 could trigger a continuation pattern, potentially leading to a retest of the $0.22 level. This scenario aligns with broader market recovery expectations.

    Bearish Case

    Early rejection at current levels could signal distribution, potentially leading to a sweep below $0.18 and a retest of deeper support at $0.16387.

    FAQ Section

    What caused Dogecoin’s price to drop below $0.20?

    The drop was primarily triggered by Bitcoin’s price decline below $104,000 and a technical liquidity sweep through key support levels.

    Is this a good time to buy Dogecoin?

    Traders should wait for confirmation of support at current levels and watch for a clear break above $0.209 before considering long positions.

    What are the key support levels to watch?

    The primary support zones are at $0.18 and $0.16387, with the latter representing a crucial demand zone.

    As the market continues to digest this price action, traders should maintain strict risk management and watch for clear confirmations before taking positions. The next few days will be crucial in determining whether Dogecoin can maintain its structural integrity above key support levels.

  • Cardano (ADA) Price Plunges Below $0.70: Key Support at Risk

    Cardano (ADA) Price Plunges Below $0.70: Key Support at Risk

    Cardano (ADA) continues its bearish trend as the price breaks below critical support levels, raising concerns among investors about further downside potential. The recent price action suggests mounting selling pressure that could test lower support zones in the coming days.

    Key Highlights of ADA’s Price Movement

    • ADA price dropped below crucial $0.720 and $0.700 support levels
    • Trading activity remains below the 100-hourly simple moving average
    • Critical bullish trend line support at $0.6840 has been breached
    • Next major support zone established at $0.650

    This bearish movement comes amid broader market uncertainty, with recent governance challenges facing the Cardano ecosystem potentially contributing to negative sentiment.

    Technical Analysis Deep Dive

    The hourly chart reveals several concerning technical developments:

    • Price consolidation below $0.70 psychological level
    • RSI indicating oversold conditions below 50
    • MACD showing increasing bearish momentum
    • Key Fibonacci retracement levels suggesting resistance at $0.6825

    SPONSORED

    Trade ADA with up to 100x leverage on perpetual contracts

    Trade Now on Defx

    Support and Resistance Levels

    Critical price levels to watch:

    • Major Resistance: $0.6920, $0.7000, $0.7350
    • Key Support: $0.6625, $0.6500, $0.6200

    Market Outlook and Trading Implications

    The immediate outlook remains bearish unless ADA can reclaim the $0.6825 resistance level. Traders should watch for:

    • Potential breakdown below $0.650 support
    • Volume patterns at key support levels
    • RSI divergence signals for potential reversal

    FAQ

    Q: What’s causing Cardano’s price decline?
    A: Multiple factors including technical breakdown, broader market sentiment, and recent governance issues are contributing to the bearish pressure.

    Q: Where is the next major support level?
    A: The $0.650 level represents crucial support, followed by $0.620.

    Q: What would signal a potential reversal?
    A: A daily close above $0.6920 with increasing volume could indicate a trend reversal.

  • Bitcoin Price Dips 9% to $105K: On-Chain Metrics Signal Accumulation Phase

    Bitcoin Price Dips 9% to $105K: On-Chain Metrics Signal Accumulation Phase

    Bitcoin’s price has pulled back 9.3% in the last 24 hours to $105,062, marking an 8% decline from its recent all-time high. While short-term volatility has increased, multiple on-chain indicators suggest this dip may be setting up for the next leg higher.

    This analysis comes as long-term holder confidence reaches new highs, with key metrics pointing to sustained accumulation despite price weakness.

    Key On-Chain Metrics Paint Bullish Picture

    According to CryptoQuant analyst Amr Taha, three critical on-chain trends are emerging:

    • Binance spot trading volume share increased from 26% to 35% since early June
    • Long-Term Holder Net Position Realized Cap exceeded $20 billion
    • Over 20,000 BTC withdrawn from Kraken and Bitfinex in 48 hours

    Exchange Dynamics Signal Institutional Interest

    The surge in Binance’s market share comes as retail demand shows signs of cooling. However, institutional-sized withdrawals from major exchanges suggest smart money may be accumulating during this dip.

    SPONSORED

    Trade Bitcoin with up to 100x leverage on perpetual contracts

    Trade Now on Defx

    Long-Term Holder Confidence Remains Strong

    The Long-Term Holder Net Position Realized Cap surpassing $20 billion indicates veteran investors are holding firm. Historically, such accumulation patterns have preceded significant price expansions.

    FAQ: Bitcoin Market Outlook

    What’s causing the current Bitcoin price dip?

    The pullback appears technical in nature, coming after Bitcoin reached new all-time highs. On-chain data suggests this is more likely a healthy correction than the start of a major downtrend.

    Are whales selling their Bitcoin holdings?

    On-chain metrics indicate the opposite – large holders are actually accumulating, with over 20,000 BTC moving off exchanges into private wallets in recent days.

    What’s the next key support level for Bitcoin?

    Major support sits at the psychological $100,000 level, with additional technical support around $98,500 based on the 21-day moving average.

    Conclusion: Accumulation Continues Despite Volatility

    While short-term price action has turned bearish, the underlying on-chain metrics paint a picture of continued accumulation by long-term holders and institutions. This divergence between price and fundamentals often presents opportunities for strategic position building.

  • XRP Price Tests $2.20 Support: Key Indicators Signal Potential Rally

    XRP Price Tests $2.20 Support: Key Indicators Signal Potential Rally

    XRP’s price action is showing signs of a potential bullish reversal after finding strong support at $2.20, with technical indicators suggesting an imminent breakout could be on the horizon. This analysis comes as major institutional players like Webus signal increased interest in XRP, potentially adding significant buying pressure to the market.

    Current Market Structure Analysis

    XRP has established a critical support zone between $2.185 and $2.20, with multiple technical factors converging to create a strong foundation for potential upward movement:

    • 100-hourly Simple Moving Average providing dynamic support
    • Bullish trend line formation at $2.185
    • 61.8% Fibonacci retracement level alignment
    • Previous resistance turned support at $2.220

    Key Resistance Levels to Watch

    For bulls to regain control, several critical resistance levels must be overcome:

    • Immediate resistance: $2.2320
    • Major psychological level: $2.250
    • Previous high resistance: $2.2850
    • Extended target zone: $2.320-$2.380

    SPONSORED

    Trade XRP with up to 100x leverage and maximize your profit potential

    Trade Now on Defx

    Technical Indicator Analysis

    Current technical indicators present a mixed but potentially bullish scenario:

    • MACD: Showing decreased momentum in the bullish zone
    • RSI: Currently below 50, indicating potential oversold conditions
    • Moving Averages: Price maintaining position above 100-hour SMA

    Support Zones and Downside Risks

    In case of a bearish turn, these support levels should be monitored:

    Support Level Price Point Significance
    Primary Support $2.20 Current consolidation base
    Secondary Support $2.1850 Trend line support
    Critical Support $2.150 Previous swing low

    Frequently Asked Questions

    What is the next major resistance level for XRP?

    The immediate major resistance level is at $2.250, followed by $2.2850.

    Could XRP break below current support levels?

    If $2.1850 support breaks, XRP could test lower supports at $2.150 and $2.120.

    What technical indicators should traders watch?

    Key indicators to monitor include the MACD, RSI, and the 100-hour SMA position.

    Trading Implications

    Traders should consider the following strategies:

    • Long entries near $2.20 support with tight stops
    • Resistance scalping opportunities at $2.250
    • Break and retest plays at $2.2850

    As always, proper risk management and position sizing remain crucial for trading success in these volatile market conditions.

  • Ethereum Price Surges Past $2,550 While Bitcoin Consolidates

    Ethereum Price Surges Past $2,550 While Bitcoin Consolidates

    Ethereum (ETH) has demonstrated remarkable strength in the cryptocurrency market, pushing above the critical $2,550 level while Bitcoin faces potential downside pressure. This technical analysis explores ETH’s bullish momentum and key price levels to watch.

    Key Ethereum Price Levels and Technical Indicators

    • Current Price: $2,620
    • Key Support: $2,575
    • Major Resistance: $2,665
    • 24-hour Range: $2,476 – $2,677
    • 100-hour SMA: Above $2,550

    Ethereum’s Bullish Channel Formation

    A significant rising channel has emerged on the ETH/USD hourly chart, with strong support established at $2,600. This technical formation, coupled with ETH trading above the 100-hour Simple Moving Average, suggests sustained bullish momentum.

    SPONSORED

    Trade ETH with up to 100x leverage on perpetual contracts

    Trade Now on Defx

    Critical Resistance Levels

    Ethereum faces several key resistance levels that could determine its short-term trajectory:

    • Initial Resistance: $2,640
    • Major Barrier: $2,665
    • Breakthrough Target: $2,720
    • Extended Target: $2,780

    Support Structure Analysis

    In case of a pullback, ETH has established multiple support levels:

    • Primary Support: $2,600
    • Secondary Support: $2,575 (50% Fibonacci retracement)
    • Critical Support: $2,500
    • Emergency Support: $2,420

    Technical Indicator Analysis

    Current technical indicators present a mixed picture:

    • MACD: Showing bearish momentum
    • RSI: Below 50, indicating potential consolidation
    • Moving Averages: Price above 100-hour SMA suggests overall bullish trend

    FAQ Section

    What is causing Ethereum’s current price increase?

    Ethereum’s price surge is supported by strong technical formations, including a rising channel pattern and sustained trading above key moving averages.

    What are the key levels to watch for ETH traders?

    Traders should monitor the $2,665 resistance and $2,575 support levels as crucial price points for potential breakouts or reversals.

    Could ETH reach $3,000 in the near term?

    While possible, ETH must first clear several resistance levels, with $2,920 serving as the immediate upside target if current momentum continues.

    Conclusion and Market Outlook

    Ethereum’s current price action suggests strong bullish momentum, though traders should remain cautious of potential resistance at $2,665. The formation of a rising channel provides a clear framework for trading decisions, with key support at $2,600 serving as a crucial level for maintaining the upward trajectory.

  • Dogecoin Price Target Hits $3.50: Analyst Maps EOY Bull Case

    Dogecoin Price Target Hits $3.50: Analyst Maps EOY Bull Case

    Dogecoin (DOGE) has entered a critical phase as the leading meme cryptocurrency faces mounting bearish pressure, dropping over 12% in the past week. As recent analysis warned of a potential 6-month downtrend, fresh technical data suggests a major trend reversal could be imminent, with ambitious end-of-year targets now in focus.

    Technical Analysis Points to Major DOGE Reversal

    Despite currently trading at $0.19, renowned crypto analyst TradingShot has unveiled a comprehensive technical analysis suggesting Dogecoin could be preparing for a significant upward movement. The analysis centers on a long-standing Fibonacci Channel Up structure that has historically guided DOGE’s major price movements.

    Key technical indicators supporting the bullish case include:

    • Formation of a 1W Golden Cross pattern
    • Price bounce from the critical 1W MA200 support
    • Consolidation around the 1W MA50
    • Adherence to historical Fibonacci Extension levels

    SPONSORED

    Trade DOGE with up to 100x leverage on perpetual contracts

    Trade Now on Defx

    End-of-Year Price Targets

    TradingShot’s analysis outlines two significant price targets for Dogecoin:

    1. Fair Value Target: $1.00
      • Aligns with 1.0 Fibonacci Extension
      • Corresponds with MMB 3SD level
      • Represents 426% increase from current levels
    2. Optimistic Target: $3.50
      • Coincides with 1.618 Fibonacci level
      • Matches historical cycle tops
      • Would mark new all-time high

    Supporting Technical Indicators

    The Mayer Multiple Bands (MMB) analysis provides additional validation for the bullish outlook. Current price action shows DOGE has touched the MMB 2SD level but hasn’t yet tested the 3SD mark, suggesting significant upside potential remains untapped.

    Frequently Asked Questions

    What could prevent Dogecoin from reaching these targets?

    Market volatility, regulatory changes, or broader crypto market downturns could impact DOGE’s ability to reach projected levels. Additionally, whale movements and market sentiment around meme coins play crucial roles.

    How reliable are Fibonacci-based predictions?

    While Fibonacci levels have historically served as reliable indicators for DOGE price action, they should be considered alongside other technical and fundamental factors rather than in isolation.

    What role does Bitcoin’s performance play in these predictions?

    Bitcoin’s price action typically influences the broader crypto market, including DOGE. A bullish Bitcoin trend would likely support Dogecoin’s upward movement toward these targets.

  • Bitcoin Realized Cap Metric Signals Strong Bull Market Despite $105K Range

    Bitcoin Realized Cap Metric Signals Strong Bull Market Despite $105K Range

    Bitcoin’s on-chain metrics are painting a bullish picture despite recent price consolidation around $105,000, with the Realized Cap Impulse metric showing remarkable strength that suggests the current bull market remains firmly intact.

    Key Realized Cap Metrics Signal Continued Strength

    While Bitcoin’s price action has shown signs of weakness lately, key on-chain metrics suggest strong support levels remain intact. The Realized Cap Impulse, a critical indicator tracking the Bitcoin network’s total cost basis, has maintained firm positioning at crucial support levels despite recent market turbulence.

    According to data from Alphractal, an advanced on-chain analytics platform, the Realized Cap Impulse metric is demonstrating persistent strength – a key signal that typically precedes continued upward price movement. This metric’s resilience suggests substantial underlying demand for Bitcoin, even as prices consolidate.

    SPONSORED

    Trade Bitcoin with up to 100x leverage on perpetual contracts

    Trade Now on Defx

    Short-Term Correction Could Precede Major Rally

    While the overall trend remains bullish, analysts are noting the possibility of a healthy correction. On-Chain College, a prominent crypto analyst, suggests Bitcoin could see a pullback to the $95,000 support zone before continuing its upward trajectory. This aligns with recent analysis of key resistance levels around $105,000.

    Looking Ahead: Key Price Targets and Timeline

    The Realized Cap Impulse is expected to maintain its upward trajectory through October 2025, potentially driving Bitcoin toward the $125,000 level. However, Alphractal warns this could be the final major move before a prolonged bearish cycle beginning in late 2025.

    FAQ Section

    What is the Bitcoin Realized Cap Impulse?

    The Realized Cap Impulse is an on-chain metric that measures changes in Bitcoin’s total cost basis, providing insights into market participant behavior and potential price trends.

    What support levels should traders watch?

    Key support levels are converging around $95,000, with additional technical support at $105,000. These levels are crucial for maintaining the current bull market structure.

    When might the bull market end?

    According to Alphractal’s analysis, the current bull phase could extend through October 2025 before transitioning into a bearish cycle lasting approximately one year.

  • XRP Price Consolidates at $2.25: Key Oscillator Signals Flash Warning

    Key Takeaways:

    • XRP trading at $2.25 with $131B market cap
    • 24-hour volume reaches $2.26B amid tight consolidation
    • Technical indicators suggest cautious approach despite bullish setup

    XRP continues to navigate a critical price zone as the digital asset trades at $2.25, showing signs of both opportunity and caution for traders. This analysis comes at an interesting time, particularly as Ripple expands its presence in the Middle East with its RLUSD stablecoin.

    The cryptocurrency’s market capitalization stands firm at $131 billion, while maintaining a healthy 24-hour trading volume of $2.26 billion. The current price action suggests a period of consolidation, with intraday movements confined between $2.23 and $2.28.

    Technical Analysis: Mixed Signals Emerge

    The 1-hour chart reveals a tight consolidation pattern between $2.24 and $2.26, presenting a classic scalping setup. However, key oscillators are flashing warning signs that deserve attention:

    • RSI: Showing slight bearish divergence
    • MACD: Histogram suggesting decreasing momentum
    • Volume Profile: Below average, indicating potential lack of conviction

    SPONSORED

    Trade XRP with precision using advanced charting tools and deep liquidity

    Trade Now on Defx

    Support and Resistance Levels

    Critical levels to watch:

    Support Resistance
    $2.23 $2.28
    $2.20 $2.30
    $2.15 $2.35

    Market Sentiment and Outlook

    While the immediate setup appears conducive for scalping opportunities, traders should exercise caution given the mixed signals from oscillators. The current consolidation phase could precede a significant move in either direction.

    FAQ

    Q: What’s causing XRP’s current consolidation?
    A: The tight trading range appears to be influenced by broader market uncertainty and technical resistance levels.

    Q: Is this a good entry point for traders?
    A: While scalping opportunities exist, the conflicting technical signals suggest waiting for clearer directional confirmation.

    Q: What are the key levels to watch?
    A: The immediate support at $2.23 and resistance at $2.28 are crucial for short-term price action.