Tag: Cryptocurrency Trading

  • Ethereum Price Signals $2,000 Drop: Key Support Levels Revealed

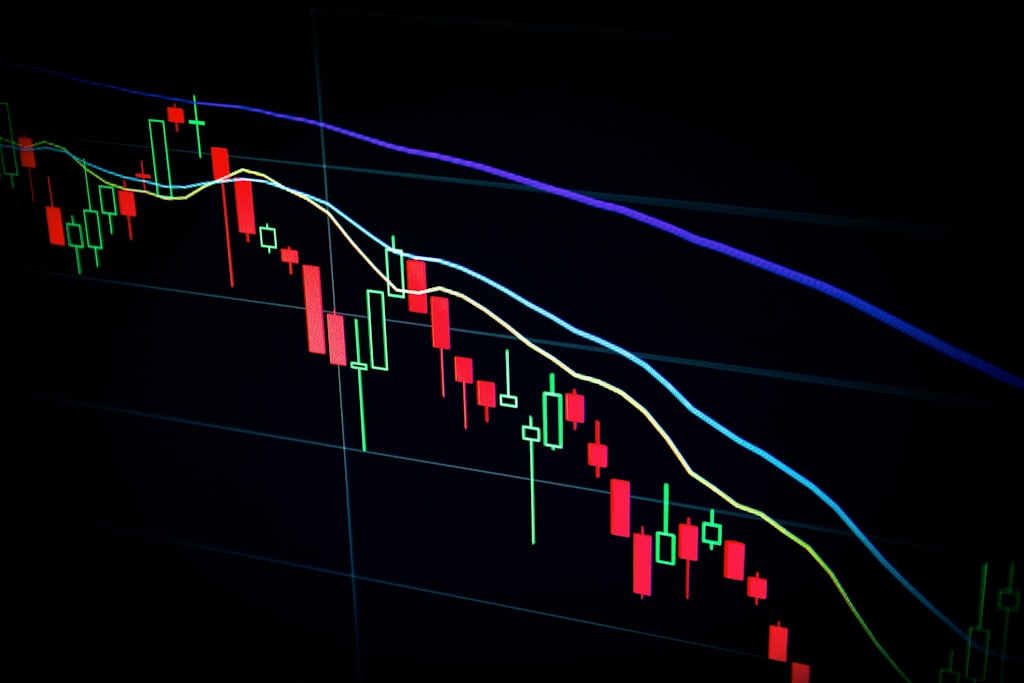
    In what appears to be a significant shift in market sentiment, Ethereum’s recent bullish momentum may be coming to an end, with technical indicators suggesting a potential drop to the $2,000 level. This analysis comes at a crucial time when the cryptocurrency market shows increasing signs of volatility.

    Technical Analysis Points to Bearish Continuation

    According to respected TradingView analyst Master Ananda, Ethereum’s price action is displaying concerning signals as it struggles below critical resistance. Currently trading at $2,605, ETH recently faced rejection from $2,788, establishing what appears to be a local top.

    SPONSORED

    Trade ETH with up to 100x leverage and maximize your profit potential

    Trade Now on Defx

    Critical Support Levels to Watch

    The analysis identifies several key Fibonacci retracement levels that could act as support:

    • $2,280 (0.382 Fibonacci level)
    • $2,085 (0.5 Fibonacci level)
    • $1,900 (0.618 Fibonacci level)
    • $1,735 (0.786 Fibonacci level)

    Trading Strategy and Risk Management

    For traders looking to capitalize on this potential movement, Master Ananda suggests a strategic approach:

    1. Wait for confirmation of support at key levels
    2. Look for entry points between $1,900 and $1,735
    3. Set stop losses below the April 7 low
    4. Consider dollar-cost averaging into positions

    Long-term Outlook Remains Positive

    Despite the short-term bearish outlook, Ethereum’s long-term growth potential remains strong, with ongoing network developments and institutional adoption continuing to provide fundamental support.

    Frequently Asked Questions

    Q: What is causing Ethereum’s potential price drop?
    A: Technical indicators, including bearish divergence and Fibonacci retracement levels, suggest a correction is due after recent price increases.

    Q: How low could Ethereum price go?
    A: Technical analysis suggests potential support levels at $2,280, $2,085, and possibly as low as $1,900.

    Q: Is this a good time to buy Ethereum?
    A: While the short-term outlook suggests waiting for lower prices, strategic entries at support levels could provide good long-term opportunities.

  • Bitcoin Whales Accumulate $8.3B Worth of BTC as Price Holds $100K

    Bitcoin Whales Accumulate $8.3B Worth of BTC as Price Holds $100K

    Bitcoin whales are showing strong conviction in the market, with on-chain data revealing a significant increase in large holder accumulation despite BTC consolidating above $100,000. This strategic movement by institutional players could signal further upside potential for the leading cryptocurrency.

    Key Whale Accumulation Metrics Show Bullish Momentum

    According to recent on-chain analysis, Bitcoin addresses holding between 1,000 and 10,000 BTC have increased their positions substantially since March 11, when Bitcoin experienced a temporary dip below $78,000. The accumulation trend has continued even as BTC reached new all-time highs.

    SPONSORED

    Trade Bitcoin with up to 100x leverage on perpetual contracts

    Trade Now on Defx

    Whale Holdings Reach New Milestones

    Key findings from the analysis include:

    • Total whale holdings increased from 3.3M to 3.5M BTC
    • Net accumulation of 78,000 BTC in the past 30 days
    • Recent 7-day accumulation of 6,000 BTC
    • 5% increase in total whale supply

    Short Positions Decline as Confidence Grows

    Adding to the bullish narrative, on-chain expert Joao Wedson notes that whale short interest has significantly decreased, suggesting growing confidence in Bitcoin’s upward trajectory. This shift in sentiment comes as analysts closely monitor potential price volatility following recent all-time highs.

    Market Implications and Future Outlook

    The sustained accumulation by large holders could provide strong support for Bitcoin’s price as it consolidates above $100,000. With reduced selling pressure from short positions and continued institutional interest, the stage may be set for the next leg up in Bitcoin’s bull run.

    Frequently Asked Questions

    What defines a Bitcoin whale?

    A Bitcoin whale is typically defined as an address holding between 1,000 and 10,000 BTC, representing significant market moving potential.

    How does whale accumulation affect Bitcoin price?

    Large-scale accumulation by whales often reduces available supply on exchanges, potentially leading to price appreciation when demand increases.

    What is the current market sentiment among institutional investors?

    Current data suggests institutional investors maintain a bullish outlook, with reduced short positions and increased accumulation indicating strong confidence in Bitcoin’s future value.

  • Ethereum Price Shows Historic Bull Setup as Whales Accumulate

    Ethereum Price Shows Historic Bull Setup as Whales Accumulate

    Ethereum (ETH) is displaying a rare confluence of bullish technical signals not seen since the 2020 bull market, as the second-largest cryptocurrency trades near $2,600 amid growing institutional interest.

    Technical analyst Kevin (@Kev_Capital_TA) has identified a series of historical indicators suggesting Ethereum could be on the verge of a major breakout. This analysis comes as exchange supply data shows ETH holdings reaching 7-year lows, potentially setting up for a supply squeeze.

    Multiple Technical Indicators Flash Green

    The monthly ETH/USD chart reveals a compelling setup featuring:

    • A “massive demand candle” in April after touching $1,400
    • 41% price surge in May breaking above the long-term super-trend
    • Monthly stochastic RSI preparing for a “V-shaped cross” out of oversold territory
    • MACD histogram showing 4-year compression pattern

    This technical confluence aligns with recent institutional developments, as multiple analysts project a potential rally to $8,000 based on improving fundamentals.

    SPONSORED

    Trade Ethereum with up to 100x leverage on perpetual contracts

    Trade Now on Defx

    Whale Accumulation Signals

    On-chain metrics reveal significant whale activity:

    • Money flow readings at historical lows but showing reversal
    • First green print on ETH dominance in over a year
    • Market Cipher buy signal triggered
    • VWAP crossing above zero line

    ETH/BTC Ratio Shows Promise

    The ETH/BTC pair is displaying several positive signals:

    • Testing 0.5 Fibonacci retracement level
    • Monthly stochastic RSI preparing to cross up after 1,066 days below 20
    • Demand candles forming similar to 2019-2020 accumulation phase

    Key Resistance Levels

    While the outlook appears bullish, ETH faces notable resistance at:

    • $2,800-3,000 zone (immediate resistance)
    • Previous rally peaks need to be overcome
    • Monthly timeframe suggests gradual progression rather than immediate breakout

    At press time, ETH trades at $2,607, maintaining its six-week uptrend despite minor pullbacks.

  • Bitcoin Price Golden Cross Signals $115K Target Despite Recent Dip

    Bitcoin Price Golden Cross Signals $115K Target Despite Recent Dip

    Bitcoin’s recent price action has caught the attention of traders and analysts alike, with renowned crypto analyst Doctor Profit highlighting a crucial technical formation that could signal further upside ahead. Recent analysis suggesting a $130K Bitcoin price target by September adds weight to the bullish outlook, despite the current market volatility.

    Golden Cross Formation Suggests Continued Bullish Momentum

    The appearance of a Golden Cross on Bitcoin’s weekly chart has emerged as a significant technical indicator, with historical data showing this pattern’s remarkable accuracy in predicting sustained bull runs. Doctor Profit, known for his precise market calls, emphasizes that this rare technical formation has maintained a perfect track record of predicting multi-month rallies.

    SPONSORED

    Trade Bitcoin with up to 100x leverage and maximize your profit potential

    Trade Now on Defx

    Technical Analysis Breakdown

    Key technical indicators supporting the bullish thesis include:

    • Weekly Golden Cross formation
    • Cup and Handle pattern targeting $113,000-$115,000
    • Higher highs and higher lows since $74,000 bottom
    • Price trading above all major moving averages
    • Bullish MACD crossover on the weekly timeframe

    Market Structure Remains Strong Despite Bearish Divergence

    While some traders have expressed concern over a bearish divergence on the weekly timeframe, Doctor Profit dismisses these worries, citing a similar pattern that appeared at $80,000 without impacting the broader uptrend. Recent data showing whale accumulation of 78,000 BTC further supports the bullish narrative.

    Institutional Factors Supporting Bitcoin’s Uptrend

    Several institutional developments continue to support Bitcoin’s positive outlook:

    • Low BlackRock ETF outflows despite market turbulence
    • Strong institutional holding patterns
    • Long-term holder accumulation continuing

    FAQ Section

    What is a Golden Cross in Bitcoin trading?

    A Golden Cross occurs when a shorter-term moving average crosses above a longer-term moving average, typically signaling a bullish trend change.

    Why is the $115,000 level significant?

    This level represents the upper boundary of the Cup and Handle pattern formation, which typically serves as a strong breakout target.

    What could invalidate this bullish scenario?

    A break below the recent low of $74,000 would invalidate the current bullish structure and potentially signal a trend reversal.

    As Bitcoin continues to navigate through these critical price levels, maintaining position above key moving averages while forming bullish technical patterns suggests the potential for continued upside. Traders should remain vigilant of key support and resistance levels while managing risk appropriately.

  • Solana Price Shows Bullish TD Signal Despite 13% Drop – Key Levels

    Solana Price Shows Bullish TD Signal Despite 13% Drop – Key Levels

    Solana (SOL) has entered a critical technical phase, with a key indicator suggesting a potential trend reversal despite recent bearish price action. The cryptocurrency, which has seen a 13% decline over the past week, is now showing signs of a possible recovery according to respected technical analysis patterns.

    TD Sequential Signals Potential SOL Price Reversal

    Crypto analyst Ali Martinez has identified a significant technical development on Solana’s 12-hour chart. The Tom DeMark (TD) Sequential indicator, a widely-respected technical analysis tool, has just flashed a buy signal after completing a sequence of nine red candles.

    This technical formation is particularly noteworthy as it comes after Solana’s recent DeFi developments and could signal a shift in market sentiment.

    Understanding the TD Sequential Pattern

    The TD Sequential operates through two distinct phases:

    • Setup Phase: Counts nine consecutive candles of the same color
    • Countdown Phase: Extends to thirteen candles for confirmation

    In Solana’s case, the completion of nine red candles typically suggests an exhaustion of selling pressure and a potential buying opportunity.

    SPONSORED

    Trade Solana with up to 100x leverage on perpetual contracts

    Trade Now on Defx

    Whale Activity Adds Market Uncertainty

    However, on-chain data presents a potentially conflicting narrative. A significant SOL whale has transferred 2.86 million tokens (valued at $441 million) to Binance, raising concerns about potential selling pressure. This massive transfer represents one of the largest single-wallet movements in recent weeks.

    Key Price Levels to Watch

    Current critical levels for Solana:

    • Current Price: $153.90
    • Immediate Resistance: $165.00
    • Key Support: $150.00

    FAQ Section

    What does the TD Sequential buy signal mean for Solana?

    The TD Sequential buy signal suggests a potential trend reversal after nine consecutive red candles, indicating possible price recovery ahead.

    How significant is the whale transfer to Binance?

    The $441 million transfer represents a substantial position that could impact market dynamics if the whale decides to sell.

    What are the key price levels traders should monitor?

    Traders should watch the $150 support level and $165 resistance level for potential breakout or breakdown scenarios.

    As the market digests these mixed signals, traders should maintain careful position sizing and implement proper risk management strategies. The confluence of technical indicators and whale movements suggests increased volatility may lie ahead for Solana.

  • Bitcoin Warning Signs Mount as Long-Term Holders Exit $100K Level

    Bitcoin’s recent surge to $111,814 shows signs of weakening as key on-chain metrics flash warning signals. Long-term holders are reducing exposure while retail traders rush to buy the all-time high – a pattern that historically precedes market corrections.

    Critical Market Signals Point to Potential Correction

    As noted in recent analysis of whale behavior at the $100K level, several concerning trends have emerged in Bitcoin’s on-chain data:

    • Over $1 billion in stablecoins withdrawn from Binance
    • Long-term holder Net Position Realized Cap dropped from $28B to $2B
    • Large wallet holders (1,000-10,000 BTC) steadily reducing positions

    SPONSORED

    Trade Bitcoin with up to 100x leverage on perpetual contracts

    Trade Now on Defx

    Retail FOMO vs Institutional Caution

    While smaller retail traders holding 100-1,000 BTC are aggressively accumulating, institutional players appear more cautious. This divergence often signals a market top, as retail FOMO historically peaks near cycle highs.

    Bullish Indicators Remain

    Despite warning signs, several metrics suggest continued upside potential:

    • Bitcoin Net Realized Profit/Loss (NRPL) shows modest profit-taking compared to previous peaks
    • Recent 7,883 BTC withdrawal from Coinbase indicates possible institutional accumulation
    • Exchange reserves continue declining, suggesting strong hodler sentiment

    Key Price Levels to Watch

    Bitcoin currently trades at $103,854, with critical support at $100,000. A break below this psychological level could trigger accelerated selling. Resistance remains at the recent ATH of $111,814.

    FAQ

    What does the stablecoin outflow indicate?

    Large stablecoin outflows from exchanges typically signal reduced buying power and potential shift toward risk-off sentiment.

    Why are long-term holders selling?

    LTH selling often indicates profit-taking at major psychological levels and can precede market corrections.

    Is retail buying sustainable?

    Historical patterns suggest retail-driven rallies without institutional support are often unsustainable long-term.

  • XRP Price Trigger Point at $2.56 Could Launch 50% Rally, Wave Analysis Shows

    XRP appears poised for a significant breakout according to comprehensive technical analysis combining Elliott Wave Theory and Wyckoff principles. After months of consolidation, analysts have identified $2.56 as the critical trigger level that could ignite XRP’s next major rally phase.

    Technical Analysis Points to Major XRP Price Breakout

    A detailed wave count analysis by crypto analyst ‘Charting Prodigy’ reveals that XRP has completed Wave 1 of a new impulse cycle following April’s lows, with a subsequent WXY corrective Wave 2 pattern now resolved. The analysis suggests XRP is entering sub-wave 3 of Macro Wave 5 – typically the strongest wave in Elliott Wave sequences.

    This analysis aligns with recent technical indicators showing XRP approaching key resistance levels that could trigger accelerated price movement.

    SPONSORED

    Trade XRP with up to 100x leverage on perpetual contracts

    Trade Now on Defx

    Multiple Technical Indicators Support Bullish Outlook

    The confluence of technical signals supporting this potential breakout includes:

    • Wyckoff reaccumulation pattern completion
    • Bullish MACD divergence formation
    • Fibonacci extension targets aligned with $2.90-$3.40 range
    • Classic accumulation phases including PSY, AR, and ST identified

    Double-Digit Price Targets Emerge

    Adding weight to the bullish case, analyst Egrag Crypto’s analysis of the 2-week chart projects potential targets at $10, $18, $27, and even $55 in the coming months. This forecast is based on XRP’s historical performance within a macro ascending channel dating back to 2016.

    Key Support and Resistance Levels

    Level Significance
    $2.56 Primary trigger point
    $2.65 Secondary confirmation level
    $2.90-$3.40 Initial target range

    Frequently Asked Questions

    What is the key price level to watch for XRP?

    The critical trigger point is $2.56, with confirmation above $2.65 potentially signaling the start of a major rally phase.

    What technical indicators support the bullish outlook?

    Multiple indicators including Elliott Wave patterns, Wyckoff accumulation, MACD divergence, and Fibonacci extensions all align to support the bullish case.

    What are the potential price targets if XRP breaks out?

    Initial targets range from $2.90-$3.40, with longer-term projections suggesting possible moves to $10, $18, $27, and $55 based on macro chart patterns.

  • XRP Price Nears $2.20 Breakout: Key Resistance Level in Focus

    XRP is showing strong bullish momentum as the digital asset approaches a critical resistance level at $2.20, with technical indicators suggesting a potential breakout could be imminent. Currently trading at $2.18, XRP’s price action has caught the attention of crypto analysts and traders alike.

    XRP Price Analysis: Current Market Conditions

    As of 5 p.m. Eastern time, here are the key metrics for XRP:

    • Current Price: $2.18
    • Market Capitalization: $128 billion
    • 24-hour Trading Volume: $1.77 billion
    • Intraday Range: $2.14 – $2.189

    This price action follows a broader trend that has seen XRP maintain steady growth, despite recent market volatility. As previous analysis suggested a potential $3 target for XRP, the current price movement indicates we may be entering a crucial phase of this prediction.

    Technical Analysis and Market Sentiment

    The tight trading range between $2.14 and $2.189 suggests accumulation at these levels, with bulls maintaining control above key support zones. Volume analysis shows increasing buy-side pressure, particularly in the last 24 hours.

    SPONSORED

    Trade XRP with up to 100x leverage on perpetual contracts

    Trade Now on Defx

    Key Support and Resistance Levels

    Current technical levels to watch:

    • Major Resistance: $2.20
    • Secondary Resistance: $2.25
    • Primary Support: $2.14
    • Secondary Support: $2.10

    Market Implications and Trading Outlook

    A successful break above $2.20 could trigger a new wave of buying pressure, potentially pushing XRP toward the next major resistance level. Traders should watch for increased volume as a confirmation signal of any breakout attempt.

    Frequently Asked Questions

    What’s driving XRP’s current price action?

    The current price movement is supported by strong market fundamentals, increased institutional interest, and positive technical indicators.

    What are the key levels to watch for XRP?

    The immediate resistance at $2.20 is crucial, while support at $2.14 needs to hold to maintain bullish momentum.

    Could XRP reach its previous all-time high?

    While possible, it would require significant market momentum and continued institutional adoption to achieve such levels.

    Traders and investors should maintain proper risk management strategies, as cryptocurrency markets can be highly volatile and past performance does not guarantee future results.

  • Ethereum Price Eyes $10K: Key Support at $2,500 Tests Bulls’ Resolve

    Ethereum (ETH) continues to test critical support at $2,500 as market participants debate the potential for a significant breakout. Recent whale accumulation patterns and technical indicators suggest mounting pressure for a decisive move, with some analysts projecting ambitious five-figure targets.

    The second-largest cryptocurrency by market cap is currently trading at $2,488, down 2% in the last 24 hours. Bears have gained temporary control as global economic uncertainty and rising US Treasury yields weigh on risk assets. However, long-term holders remain unfazed, pointing to strengthening fundamentals.

    Technical Analysis Points to Accumulation Phase

    ETH’s price action reveals a clear consolidation pattern forming since early May, with repeated tests of the $2,700 resistance zone. The 200-day SMA at $2,680 has emerged as a crucial barrier, while support clusters near $2,470-$2,500 have absorbed selling pressure.

    Key technical levels to watch:

    • Critical support: $2,470-$2,500 range
    • Major resistance: $2,700 zone
    • 200-day SMA: $2,680
    • 34-day EMA: $2,386

    SPONSORED

    Trade Ethereum with up to 100x leverage on perpetual contracts

    Trade Now on Defx

    Bullish Case for $10K Ethereum

    Despite short-term volatility, several factors support the bullish thesis for Ethereum:

    • Rising institutional interest and declining exchange supply
    • Increasing on-chain activity and network usage
    • Technical consolidation suggesting accumulation
    • Strong support at the $2,500 psychological level

    Prominent analyst Ted Pillows maintains his $10,000 price target, arguing that current price action represents a temporary pullback rather than a trend reversal. This aligns with broader market sentiment suggesting that Ethereum remains fundamentally undervalued.

    Risk Factors to Consider

    Traders should monitor several potential risks:

    • Break below $2,470 could trigger further selling to $2,300
    • Declining trading volume suggests lack of conviction
    • Macro headwinds from rising yields and economic uncertainty
    • Technical resistance at the 200-day SMA ($2,680)

    Conclusion: Decisive Move Imminent

    Ethereum sits at a critical juncture, with technical and fundamental factors suggesting an impending breakout. While short-term volatility may persist, the confluence of strong support at $2,500 and growing institutional interest points to potential upside. Traders should watch for a decisive break above $2,700 as confirmation of the next major trend.

    Frequently Asked Questions

    Q: What is the key support level for Ethereum?
    A: The critical support zone lies between $2,470-$2,500, with additional technical support at the 34-day EMA ($2,386).

    Q: Can Ethereum reach $10,000 this cycle?
    A: While ambitious, some analysts believe $10,000 is achievable based on institutional adoption trends and technical analysis patterns.

    Q: What could trigger an Ethereum breakout?
    A: A decisive close above $2,700 with strong volume could signal the start of a larger upward move.

  • IG Group Launches Crypto Trading: UK’s First Listed Platform Enters Digital Assets

    In a groundbreaking development for UK’s cryptocurrency market, FTSE 250 financial giant IG Group has become the country’s first listed company to offer crypto trading services to retail investors. This strategic move marks a significant milestone in mainstream crypto adoption, as Bitcoin continues its strong market performance and institutional interest grows.

    Key Highlights of IG Group’s Crypto Launch

    • First UK-listed company to offer retail crypto trading
    • Competitive 1.49% flat transaction fee structure
    • Partnership with established crypto platform Uphold
    • Support for major cryptocurrencies including Bitcoin and Ethereum
    • Integration of select stablecoins for enhanced liquidity

    Market Impact and Trading Features

    The platform’s launch comes at a crucial time when institutional adoption of cryptocurrencies is accelerating. IG Group’s entry into the crypto space provides UK retail investors with a regulated, secure avenue for digital asset trading.

    SPONSORED

    Trade with confidence using up to 100x leverage on perpetual contracts

    Trade Now on Defx

    Regulatory Compliance and Security

    As a regulated entity, IG Group’s crypto offering adheres to strict UK financial regulations, providing investors with institutional-grade security and compliance standards. The partnership with Uphold ensures robust infrastructure for crypto custody and trading operations.

    FAQ Section

    What cryptocurrencies are available for trading on IG Group’s platform?

    The platform supports major cryptocurrencies including Bitcoin, Ethereum, and select stablecoins, with plans to expand the offering based on market demand.

    How does IG Group’s fee structure compare to other platforms?

    IG Group offers a competitive 1.49% flat transaction fee, positioning itself favorably against other regulated UK crypto platforms.

    Is IG Group’s crypto trading service available to all UK residents?

    The service is available to retail investors who meet IG Group’s standard account requirements and complete necessary KYC procedures.

    Market Outlook and Future Developments

    This launch represents a significant step in bridging traditional finance with digital assets, potentially paving the way for other UK-listed companies to enter the cryptocurrency market.