
XRP Price Alert: Analyst Predicts 470% Rally as Bitcoin Hits $110K
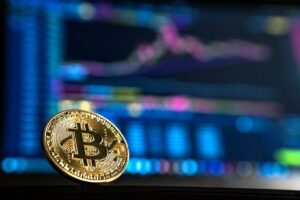
As Bitcoin surges past $110,000 to new all-time highs, crypto analyst Cryptoinsightuk has identified technical signals suggesting XRP could be...
As Bitcoin surges past $110,000 to new all-time highs, crypto analyst Cryptoinsightuk has identified technical signals suggesting XRP could be...
XRP whales are making strategic moves into DTX Exchange (DTX), a new hybrid trading platform that has seen its presale...

A prominent crypto analyst believes Dogecoin (DOGE) could reach an ambitious price target of $3.80, citing improved market structure and...
Dogecoin (DOGE) could be on the verge of a massive price surge, with a prominent crypto analyst identifying five key...
A significant shift in Singapore's cryptocurrency landscape has emerged, with crypto awareness reaching all-time highs despite a notable decline in...
Key Takeaways:NYC launches dedicated crypto council to foster blockchain innovationNew tax incentives proposed for crypto and fintech companiesBlockchain integration planned...

XRP continues to demonstrate bullish momentum as the digital asset consolidates above the crucial $2.40 support level, with technical indicators...
The XRP Ledger (XRPL) has achieved a significant regulatory milestone with the launch of EURØP, the first euro-backed stablecoin fully...
Ethereum (ETH) continues to show strength above the critical $2,500 support level, as Bitcoin's surge to $112,000 drives broader market...

Bitcoin has achieved another historic milestone, surpassing the Taiwan Dollar to become the world's 8th largest currency by market capitalization....


