Tag: Cryptocurrency

  • Dogecoin Price Nears Critical $0.21 Support: 27% Drop Risk Looms

    Dogecoin (DOGE) faces a pivotal moment as the popular meme cryptocurrency tests a critical support level at $0.21, with technical analysis suggesting increased risk of a significant price decline. The latest market data and expert analysis point to mounting selling pressure that could trigger a cascade of liquidations.

    Technical Analysis Shows Bearish Setup

    According to prominent crypto analyst RLinda’s detailed analysis on TradingView, Dogecoin has entered what appears to be a precarious position after completing its distribution phase between May 9-11 at the $0.2600 level. This phase effectively marked the conclusion of the bullish momentum that had propelled DOGE higher in late April and early May.

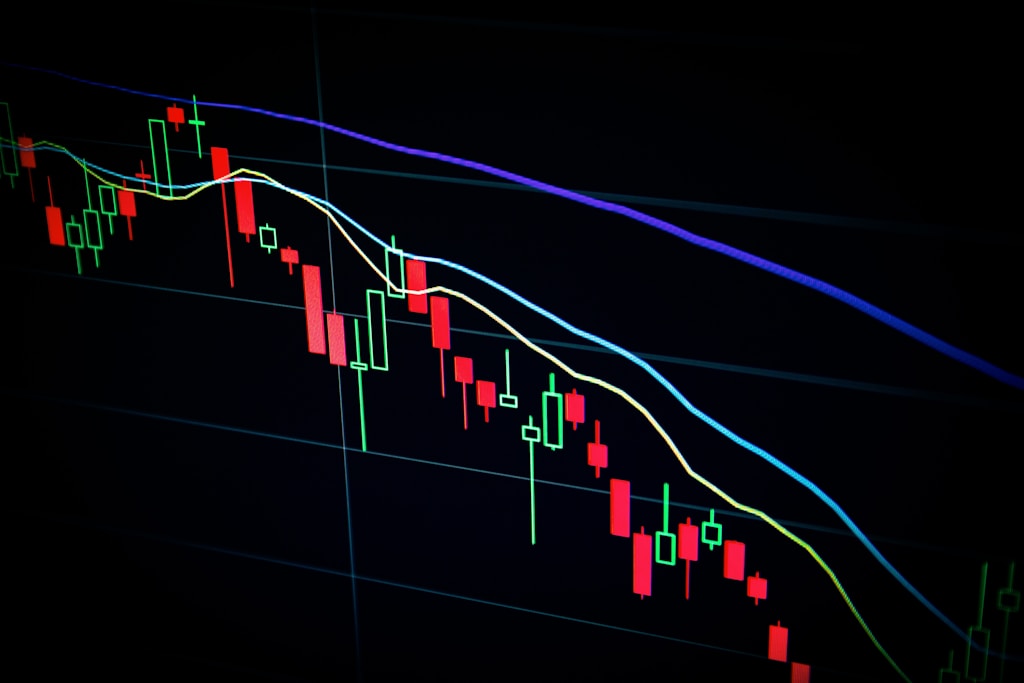
    The current price action has pushed DOGE into what analysts term the ‘panic zone’ at $0.214, with the formation of a concerning triangle pattern visible on the 2-hour timeframe. This technical structure, characterized by consistently lower highs, suggests growing bearish pressure.

    SPONSORED

    Trade Dogecoin with up to 100x leverage and maximize your profit potential

    Trade Now on Defx

    Critical Support Levels Under Pressure

    The immediate support structure shows two critical levels that traders should monitor closely:

    • Primary support: $0.2145
    • Secondary support: $0.2135

    A confirmed break below these levels, particularly $0.2135, could trigger a cascade of long position liquidations, potentially accelerating the downward momentum. This scenario aligns with recent analysis showing rejection at the $0.25 level, suggesting bears maintain control of the market.

    Key Resistance Zones and Recovery Scenarios

    For bulls to regain control, DOGE needs to reclaim several key resistance levels:

    • Immediate resistance: $0.222
    • Major resistance: $0.2307
    • Trend reversal level: $0.23

    The current trading price of $0.22 shows a modest 1.72% recovery over the past 24 hours, but analysts warn this could be a temporary bounce rather than a trend reversal. The market structure remains bearish until price action can demonstrate sustained momentum above these key resistance levels.

    Market Implications and Trading Considerations

    Traders should consider several factors when positioning themselves in the current market:

    • Set stop losses below $0.2135 to protect against sudden drops
    • Watch for increased volume as a confirmation of price movements
    • Monitor the 2-hour timeframe for triangle pattern breakout signals
    • Consider reducing exposure until clear directional momentum emerges

    FAQ Section

    Q: What is the next major support level if $0.21 breaks?
    A: The next significant support zones are at $0.20126 and $0.19298.

    Q: Could this lead to a broader crypto market correction?
    A: While DOGE’s movement often correlates with broader market sentiment, this appears to be an isolated correction based on technical factors.

    Q: What would invalidate the bearish scenario?
    A: A decisive close above $0.23 with strong volume would likely invalidate the current bearish setup.

  • Bitcoin Price at $103K Crossroads: Critical $107K Level Could Trigger $98K Drop

    Bitcoin Price at $103K Crossroads: Critical $107K Level Could Trigger $98K Drop

    Bitcoin’s price action has reached a critical juncture at $103,000, with analysts identifying $107,000 as a make-or-break level that could determine the next major move. Recent technical analysis shows increasing uncertainty as the leading cryptocurrency consolidates in a tight range.

    Key Technical Levels Under Watch

    After an impressive rally earlier this month, Bitcoin has entered a period of consolidation above $103,000. The daily chart reveals persistent resistance at $107,000, with price action forming a compressed horizontal band that signals growing market indecision.

    Crypto analyst Ali Martinez emphasizes that a daily close above $107,000 is crucial for maintaining bullish momentum. Historical data shows multiple failed attempts to breach this threshold since December 2024, creating a strong horizontal barrier just below $108,000. Notably, even Bitcoin’s recent all-time high of $108,786 couldn’t sustain above this critical level.

    SPONSORED

    Trade Bitcoin with up to 100x leverage and maximize your profit potential

    Trade Now on Defx

    Potential Bearish Scenario Emerges

    A more cautious outlook comes from analyst TehThomas on TradingView, who identifies a possible trap setup. The current range between $100,000 and $105,800 could be attracting premature breakout trades, with liquidity pooling at both extremes.

    The analysis suggests that a brief push above $105,800 might precede a sharp reversal toward the $98,000-$97,500 demand zone. This area represents a significant fair value gap and golden pocket level that could provide strong support.

    Market Implications and Trading Considerations

    Traders should note that the bearish scenario would be invalidated if Bitcoin maintains position above $105,800 with strong volume. Recent institutional inflows through ETFs could provide additional support for sustained upward momentum.

    FAQ Section

    Q: What is the key resistance level for Bitcoin right now?
    A: The critical resistance level is $107,000, which needs to be cleared with a daily close for continued bullish momentum.

    Q: What’s the worst-case scenario for Bitcoin’s price?
    A: Technical analysis suggests a potential drop to the $98,000-$97,500 support zone if the current consolidation fails.

    Q: What would invalidate the bearish scenario?
    A: Sustained trading above $105,800 with strong volume would likely prevent the projected drop to $98,000.

    At time of writing, Bitcoin trades at $103,914, showing minimal change (-0.06%) over the past 24 hours.

  • Bitcoin Price Target $200K by 2025 as Supply Crisis Deepens

    Bitcoin Price Target $200K by 2025 as Supply Crisis Deepens

    Bitcoin’s path to $200,000 is becoming increasingly clear as a severe supply crisis emerges in the cryptocurrency market. According to Bitwise Chief Investment Officer Matt Hougan, the leading cryptocurrency could reach this milestone by the end of 2025, driven by an unprecedented supply-demand imbalance.

    This analysis aligns with recent findings detailed in our coverage of bullish Bitcoin options data, suggesting strong institutional conviction in higher price targets.

    Supply Crisis Deepens: Key Metrics

    • Annual mining production: Only 165,000 BTC
    • Strategy’s recent purchases: 379,800 BTC (6 months)
    • Total ETF inflows: $6 billion and growing
    • Current deflationary rate: -2.33% annually

    Institutional Adoption Accelerates

    The supply crunch comes as institutional adoption reaches new heights. Strategy now holds an impressive 568,840 BTC, valued at $59.03 billion. This aggressive accumulation, combined with surging ETF inflows, is creating unprecedented pressure on available supply.

    SPONSORED

    Trade Bitcoin with up to 100x leverage and maximize your profit potential

    Trade Now on Defx

    Price Targets and Market Analysis

    Multiple price targets have emerged from leading analysts:

    • $100,000: Initial resistance level (Hougan)
    • $200,000: End of 2025 target (Bitwise)
    • $250,000: Extended target (Scott Melker)

    Volatility Reduction Signals Maturity

    Bitcoin’s volatility has significantly decreased, now less than twice that of the S&P 500, compared to historical levels of 3x. This reduction in volatility indicates growing institutional confidence and market maturity.

    Investment Opportunities in the Ecosystem

    The article details several investment opportunities emerging from this trend, including BTC Bull Token ($BTCBULL), MIND of Pepe ($MIND), and the Department of Government Efficiency ($DOGE).

    FAQ Section

    When will Bitcoin reach $200,000?

    According to Bitwise’s analysis, Bitcoin is projected to reach $200,000 by the end of 2025.

    What’s driving Bitcoin’s price growth?

    The primary drivers are limited supply (165,000 BTC annual production), increasing institutional demand, and significant ETF inflows.

    Is Bitcoin becoming less volatile?

    Yes, Bitcoin’s volatility has decreased to less than twice that of the S&P 500, indicating growing market maturity.

  • Bitcoin Price Eyes Major Volatility as Open Interest Patterns Align

    Bitcoin Price Eyes Major Volatility as Open Interest Patterns Align

    Bitcoin’s price action has entered a critical phase, with on-chain metrics suggesting an imminent surge in volatility. Trading within the $92,000-$95,000 range, BTC appears to be gathering momentum for its next significant move as open interest patterns show striking similarities to previous breakout periods.

    The latest analysis from blockchain intelligence firm Alphractal reveals compelling evidence that Bitcoin could be preparing for increased price action in the coming weeks. This comes as technical indicators show mixed signals despite BTC holding above $100,000.

    Open Interest Delta Signals Market Shift

    The 30-day Open Interest Delta has reached levels last seen during Bitcoin’s previous all-time high formation at $73,737 in 2024. This metric, which measures changes in the total value of outstanding derivative positions, has historically preceded major price movements.

    SPONSORED

    Trade Bitcoin with up to 100x leverage on perpetual contracts

    Trade Now on Defx

    Key Market Indicators to Watch

    The 180-day Open Interest Delta presents particularly interesting data, hovering just above negative territory. Historical data suggests this pattern often precedes either:

    • A market bottom formation
    • An accumulation phase beginning
    • A significant volatility increase

    Recent technical analysis suggests a clear path to $115,000, which aligns with the current open interest patterns showing potential for upward momentum.

    Expert Analysis and Market Outlook

    According to Alphractal’s research, the market is displaying clear cyclical behavior:

    “The alternating cycles of increase and decrease in the Open Interest Delta demonstrate a predictable pattern that has historically preceded major price movements.”

    FAQ Section

    What does high open interest mean for Bitcoin price?

    High open interest indicates increased market participation and often precedes significant price movements, though direction isn’t guaranteed.

    How does the Open Interest Delta affect trading strategy?

    Traders often use OI Delta to gauge market sentiment and potential trend reversals, adjusting positions based on historical patterns.

    What are the key price levels to watch?

    Current support lies at $92,000, with resistance at $108,786 (current ATH). A break above could trigger accelerated momentum.

    As Bitcoin continues to navigate these crucial levels, investors should maintain vigilant monitoring of open interest metrics and broader market indicators for potential breakout signals.

  • Bitcoin Surges Past $103K: Analysts Eye $120K Target as ETF Inflows Soar

    Bitcoin Surges Past $103K: Analysts Eye $120K Target as ETF Inflows Soar

    Bitcoin’s remarkable V-shaped recovery has pushed the leading cryptocurrency above $103,000, with institutional investors pouring over $5 billion into Bitcoin ETFs in recent days. As market momentum builds toward new all-time highs, analysts are setting their sights on $120,000 as the next major resistance level.

    Macro Factors Fuel Bitcoin’s Rise

    The latest surge comes amid growing concerns over U.S. economic stability, highlighted by Moody’s recent downgrade of the U.S. credit outlook from ‘stable’ to ‘negative.’ This development, combined with Bitcoin’s emerging safe-haven status, has accelerated institutional adoption of digital assets.

    ETF Inflows Signal Institutional Confidence

    Bitcoin ETFs have seen unprecedented interest, with over $5 billion in new capital flowing in during recent days. This surge in institutional investment represents a significant shift in market dynamics, suggesting growing mainstream acceptance of Bitcoin as a legitimate asset class.

    SPONSORED

    Trade Bitcoin with up to 100x leverage and maximize your profit potential

    Trade Now on Defx

    Technical Analysis Points to Further Upside

    The V-shaped recovery pattern on Bitcoin’s daily chart suggests strong buying pressure. Technical analysts are projecting potential targets of $120,000 in the near term, with some even calling for $160,000 based on golden ratio analysis.

    Market Sentiment and Future Outlook

    Market sentiment indicators remain strongly bullish, with funding rates staying relatively modest despite the price surge. This suggests the rally may have room to run without overleveraged positions threatening stability.

    FAQ Section

    What’s driving Bitcoin’s current price surge?

    A combination of institutional ETF inflows, macro economic concerns, and strong technical momentum are fueling Bitcoin’s rise above $103,000.

    Will Bitcoin reach $120,000?

    While nothing is guaranteed in cryptocurrency markets, multiple analysts point to $120,000 as the next major resistance level, supported by technical analysis and institutional buying pressure.

    How significant are the ETF inflows?

    The $5 billion in recent ETF inflows represents one of the largest institutional capital movements into Bitcoin, signaling strong mainstream adoption.

  • Trump Remittance Tax Could Drive Mass Crypto Adoption in 2025

    Trump Remittance Tax Could Drive Mass Crypto Adoption in 2025

    Key Takeaways:

    • Proposed 5% remittance tax could affect over 40 million people
    • Cryptocurrency emerges as potential alternative to avoid new tax burden
    • Policy could accelerate digital currency adoption in remittance corridors

    In a significant development that could reshape the cryptocurrency landscape, former President Trump’s proposed ‘Big, Beautiful Bill’ threatens to impose a 5% tax on international remittances, potentially driving millions of users toward crypto alternatives. This legislative initiative, if enacted, would affect an estimated 40 million people who regularly send money across borders.

    The implications of this policy shift align with broader de-dollarization trends observed in global financial markets, as traditional remittance channels face increasing regulatory pressure.

    Understanding the Remittance Tax Proposal

    The proposed legislation would implement a blanket 5% tax on all international money transfers, significantly impacting communities that rely on remittances for financial support. This move could inadvertently accelerate the adoption of cryptocurrency as an alternative payment rail.

    SPONSORED

    Avoid remittance fees – Trade crypto with minimal costs on Defx

    Trade Now on Defx

    Cryptocurrency as a Remittance Alternative

    Market analysts suggest that cryptocurrencies, particularly stablecoins, could emerge as the preferred alternative for cross-border transfers. The inherent benefits of crypto transactions include:

    • Lower transaction fees
    • Near-instant settlement
    • 24/7 availability
    • Reduced regulatory oversight

    Impact on Crypto Markets

    The potential influx of millions of new users could significantly impact cryptocurrency markets. Stablecoin volumes, in particular, may see substantial growth as they offer a less volatile option for remittance purposes.

    FAQ Section

    Q: When would the remittance tax take effect?
    A: The implementation timeline remains uncertain as the bill is still in its proposal stage.

    Q: Which cryptocurrencies could benefit most?
    A: Stablecoins and major cryptocurrencies with established liquidity are likely to see the greatest adoption.

    Q: How might this affect crypto prices?
    A: Increased adoption could drive up demand and potentially impact prices positively across the crypto market.

    Looking Ahead

    The proposed remittance tax could serve as a catalyst for widespread cryptocurrency adoption, particularly in communities that heavily rely on cross-border money transfers. This development may accelerate the ongoing transition toward digital payment solutions and further legitimize cryptocurrency as a mainstream financial tool.

  • Cardano Price Alert: ADA Eyes $0.92 After Potential $0.75 Correction

    Cardano Price Alert: ADA Eyes $0.92 After Potential $0.75 Correction

    Cardano (ADA) is showing mixed signals in its latest market structure, with technical analysis pointing to both an imminent correction and subsequent bullish potential. While short-term indicators suggest a pullback to the $0.75 support zone, broader patterns indicate a possible rally toward $0.92.

    Technical Analysis Points to Short-Term Correction

    Prominent TradingView analyst SiDec has identified a complex technical setup for ADA, currently trading at $0.78. The analysis, based on Elliott Wave Theory and multiple technical indicators, suggests a corrective phase is underway after completing a bullish 5-wave impulse move.

    Similar to patterns seen in recent XRP price movements, Cardano is displaying a textbook ABC correction pattern, with Wave C expected to complete near the $0.75 support zone.

    Critical Support Levels Align at $0.75

    Multiple technical indicators converge around the $0.75 price level:

    • 50% Fibonacci retracement at $0.7534
    • Previous resistance turned support at $0.746
    • 21-day EMA at $0.7455
    • 21-day SMA at $0.7347
    • Volume Point of Control (POC) near $0.7318

    SPONSORED

    Trade ADA with up to 100x leverage on perpetual contracts

    Trade Now on Defx

    Bullish Case for $0.92 Target

    Despite the short-term bearish outlook, the broader trend remains constructive. Once the correction completes, technical patterns suggest a potential rally toward $0.92. However, traders should watch for confirmation signals including:

    • Bearish engulfing candle reversals
    • Clear divergence patterns
    • Volume confirmation at support levels

    FAQ Section

    What is the immediate support level for Cardano?

    The strongest support cluster exists around $0.75, with multiple technical indicators converging at this level.

    What is the upside target after the correction?

    Technical analysis suggests $0.92 as the next major target, though traders should watch for rejection at this resistance level.

    How long might the correction last?

    While timing exact bottoms is challenging, the completion of the ABC correction pattern typically signals the end of the corrective phase.

  • Bitcoin Mining Difficulty Surges 2.13% to 121.66T: Network Adjusts

    Bitcoin Mining Difficulty Surges 2.13% to 121.66T: Network Adjusts

    Bitcoin’s mining landscape experienced a significant shift as the network difficulty reached a new milestone of 121.66 trillion, marking a 2.13% increase at block height 897,120. This technical adjustment comes amid fluctuating hashrate conditions, signaling important changes for miners and network participants.

    Key Takeaways:

    • Network difficulty increased by 2.13%
    • New difficulty level: 121.66 trillion
    • Adjustment occurred at block height 897,120
    • Hashrate showing signs of decreased activity

    This development follows a period of intense mining activity, as highlighted in recent reports of institutional Bitcoin accumulation, suggesting a complex relationship between mining difficulty and market dynamics.

    Impact on Mining Operations

    The 2.13% difficulty increase represents a significant challenge for mining operations, particularly smaller players who must now commit additional computational resources to maintain their block discovery rates. This adjustment mechanism, fundamental to Bitcoin’s design, ensures the network maintains its target block time of approximately 10 minutes.

    SPONSORED

    Trade Bitcoin with up to 100x leverage on perpetual contracts

    Trade Now on Defx

    Market Implications

    The increased mining difficulty coincides with recent market developments, including Bitcoin’s price consolidation around $104,000, suggesting potential correlations between mining economics and market sentiment.

    FAQ Section

    What does this difficulty increase mean for miners?

    Miners will need approximately 2.13% more computational power to maintain their current block discovery rates.

    How does this affect Bitcoin’s energy consumption?

    The network’s overall energy consumption may increase as miners deploy additional resources to compete under the new difficulty level.

    Will this impact Bitcoin transaction fees?

    While difficulty adjustments don’t directly affect fees, they can influence mining profitability, which may indirectly impact fee markets.

    Looking Ahead

    As the network continues to evolve, these difficulty adjustments serve as crucial indicators of Bitcoin’s mining ecosystem health and overall network security. Miners and investors should monitor these metrics closely for insights into future market movements and mining profitability.

  • Bitcoin Stalls Below $105K: Key Resistance Tests Bulls’ Resolve

    Bitcoin (BTC) faces mounting pressure as bullish momentum wanes near critical resistance levels, with the leading cryptocurrency consolidating below its all-time high. After an impressive rally that saw BTC surge past $100,000, buyers are now struggling to maintain momentum, raising concerns about a potential pullback.

    This consolidation phase comes amid an interesting divergence with traditional markets. Despite growing institutional interest in Bitcoin as evidenced by recent major corporate purchases, the cryptocurrency’s price action has shown relative weakness compared to surging equity markets.

    Technical Analysis Points to Critical Support Levels

    The 4-hour chart reveals Bitcoin trading in a tight range between $105,700 resistance and $100,700 support. Multiple failed attempts to break above $103,600 suggest growing selling pressure at these levels. The 200 EMA ($96,121) and 200 SMA ($94,622) continue to provide broader technical support, though momentum indicators signal increasing uncertainty.

    SPONSORED

    Trade Bitcoin with up to 100x leverage and maximize your profit potential

    Trade Now on Defx

    Market Structure Remains Bullish Despite Short-term Weakness

    While short-term indicators suggest caution, the broader market structure remains bullish above key support at $90,000. Recent analysis of market dominance patterns suggests this consolidation could be healthy for Bitcoin’s long-term trajectory.

    Key Levels to Watch

    • Critical Resistance: $105,700
    • Immediate Support: $100,700
    • Major Support: $90,000
    • Volume Profile POC: $103,600

    FAQ Section

    Q: What could trigger a Bitcoin breakout above $105K?
    A: A surge in institutional buying pressure or positive macro developments could provide the catalyst needed for a decisive move above resistance.

    Q: Where is the safest stop-loss level for current Bitcoin longs?
    A: Conservative traders are placing stops below $100,000, while more aggressive positions might use the $96,000 area near the 200 EMA.

    Q: How does current volume compare to previous breakout attempts?
    A: Current volume is notably lower than during previous attempts to break $105K, suggesting potential exhaustion in buying pressure.

  • OpenAI Codex Launch Sparks $MIND AI Token Presale Surge

    OpenAI Codex Launch Sparks $MIND AI Token Presale Surge

    The artificial intelligence revolution in crypto has reached a new milestone with OpenAI’s latest release of Codex, coinciding with surging interest in AI-powered tokens. As recently covered in our analysis of AI’s impact on DeFi markets, autonomous agents are rapidly transforming the cryptocurrency landscape.

    OpenAI Codex: The New AI Development Standard

    OpenAI’s Codex represents a significant advancement in AI-assisted software development, capable of translating natural language into functional code. This breakthrough has catalyzed renewed interest in AI-powered cryptocurrencies, with the total AI token market capitalization now reaching $28.8B.

    Mind of Pepe ($MIND): Leading the AI Token Wave

    Amid this AI surge, Mind of Pepe ($MIND) has emerged as a standout project, combining meme coin appeal with practical AI utility. Currently in its presale phase at $0.0037515, the project has already raised over $9.4M, demonstrating strong market confidence.

    SPONSORED

    Trade AI tokens with up to 100x leverage on perpetual contracts

    Trade Now on Defx

    Key Features and Market Impact

    $MIND distinguishes itself through several innovative features:

    • Autonomous AI agent with self-learning capabilities
    • Native X integration for real-time market analysis
    • Token-gated insights exclusive to holders
    • On-chain token launch capabilities
    • Staking rewards for presale participants

    Market Performance and Future Outlook

    The broader AI token sector shows strong momentum:

    • $FET: +73.5% monthly growth
    • $VIRTUAL: +228.96% surge
    • $TAO: +82.21% increase

    Investment Considerations

    With just 14 days remaining in the presale, $MIND presents a unique opportunity at the intersection of AI technology and cryptocurrency markets. The project’s combination of meme appeal and practical utility positions it favorably in the current market landscape.

    Disclaimer: This article is for informational purposes only. Always conduct thorough research before making any investment decisions.