Bitcoin Price Alert: Head and Shoulders Pattern Signals $96K Drop
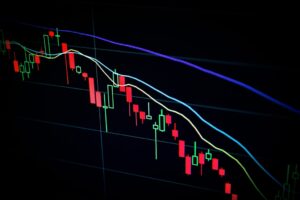
Bitcoin's recent price action has taken a concerning turn as a bearish technical pattern emerges on the charts. After maintaining...
Bitcoin's recent price action has taken a concerning turn as a bearish technical pattern emerges on the charts. After maintaining...
XRP's price structure is showing a compelling wave formation that could signal an imminent surge to $4, according to leading...

In a groundbreaking development for the cryptocurrency industry, Gemini Space Station, Inc. has confidentially submitted a draft registration statement to...
Dogecoin (DOGE) stands at a pivotal moment as the popular meme cryptocurrency faces a crucial support test at $0.167, with...
Key Takeaways:Yuga Labs proposes dissolving ApeCoin DAONew entity 'Apeco' to take over ecosystem managementMove aims to accelerate growth and developmentIn...
Venture capitalist Tim Draper has reaffirmed his bold Bitcoin price prediction of $250,000 by the end of 2025, while making...
Kuaishou's AI video generation tool Kling is making waves in the digital content creation space, projecting $100M in sales by...
Time to Read: 8 minutes The National Bank of Kazakhstan has taken a significant step toward cryptocurrency adoption by launching...
The XRP price is showing concerning bearish signals after what initially appeared to be a promising recovery, with four consecutive...
In a stunning development that has sent shockwaves through the crypto community, blockchain investigators have linked a massive 300 Bitcoin...


