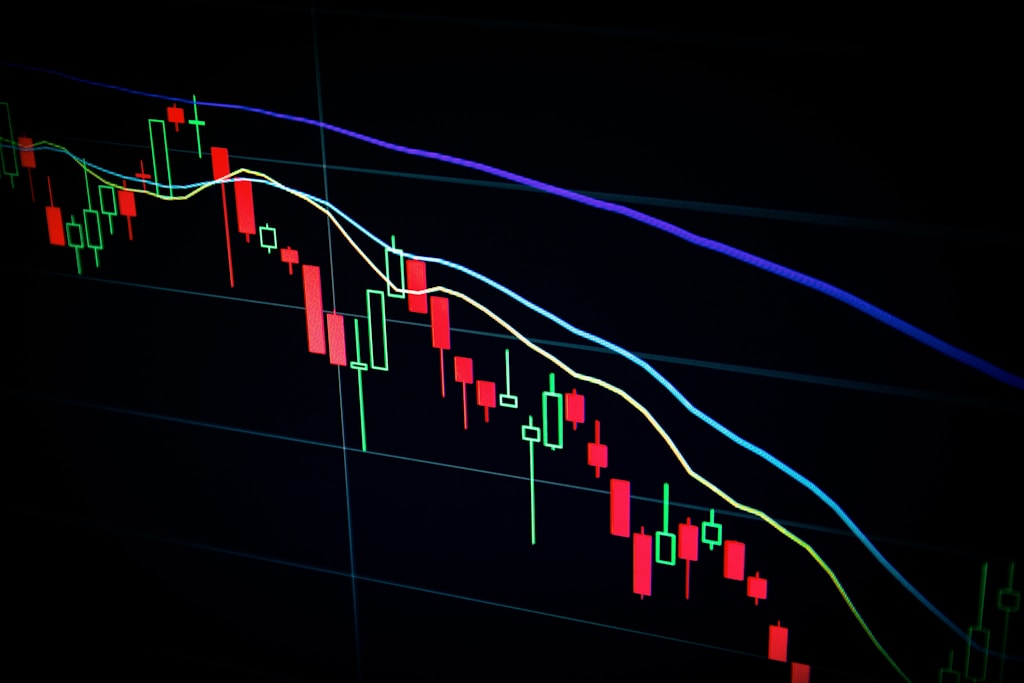
Tag: Doge Price Analysis

  • Dogecoin Price Target $0.197: Ascending Triangle Pattern Signals Rally

    Dogecoin Price Target $0.197: Ascending Triangle Pattern Signals Rally

    Dogecoin (DOGE) appears poised for a significant price movement as multiple technical indicators align with bullish sentiment. Leading crypto analyst CobraVanguard has identified a critical ascending triangle formation that could propel DOGE to $0.197, representing potential upside of over 13% from current levels.

    Technical Analysis Points to Bullish Breakout

    According to detailed technical analysis shared on TradingView, DOGE needs to decisively break above the $0.177 resistance level to confirm the ascending triangle pattern. This formation is typically considered bullish, especially when accompanied by increasing trading volume. Recent analysis showing DOGE testing the $0.17 support level adds further credence to this setup.

    Market Sentiment and On-Chain Metrics

    Several key metrics support the bullish case for DOGE:

    • 76.26% of Binance futures traders are currently long on DOGE
    • Whale accumulation of over 120 million DOGE in the past week
    • Shifting market structure from downtrend to uptrend on hourly charts
    • Formation of higher highs and higher lows

    SPONSORED

    Trade meme coins like DOGE with up to 100x leverage and low fees

    Trade Now on Defx

    Long-term Price Projections

    While the immediate target sits at $0.197, some analysts are projecting significantly higher prices. Crypto analyst Ali Martinez suggests potential targets of $4 to $20 if DOGE maintains support above $0.16. However, these projections should be viewed with appropriate caution given market volatility.

    FAQ

    What is an ascending triangle pattern?

    An ascending triangle is a bullish chart pattern characterized by a flat upper trendline and a rising lower trendline, typically signaling a potential breakout to the upside.

    What could prevent DOGE from reaching $0.197?

    Key risks include broader market volatility, failure to break the $0.177 resistance, or negative Bitcoin price action, as DOGE tends to follow BTC trends.

    How significant is the whale accumulation?

    The 120 million DOGE accumulated by whales represents a strong vote of confidence, potentially reducing available supply and supporting price appreciation.

    At time of writing, DOGE trades at $0.174, showing a 3% gain in 24 hours. Traders should monitor the $0.177 level closely for confirmation of the ascending triangle breakout.

  • Dogecoin Price Eyes $14 Target: Expert Predicts Massive Rally Ahead

    The cryptocurrency market’s bullish momentum has sparked renewed interest in Dogecoin (DOGE), with the leading meme coin showing strong signs of recovery above $0.17. As recent analysis predicted, DOGE’s price action suggests a significant upward movement could be imminent.

    Technical Analysis Points to Major Dogecoin Rally

    Renowned crypto analyst Ali Martinez has identified a compelling technical pattern that could send DOGE prices soaring to unprecedented levels. The analysis centers on a massive Ascending Parallel Channel formation visible on weekly timeframes – a pattern that has been developing for an impressive 10-year period.

    Key technical indicators include:

    • Strong support established at $0.16
    • Ascending Parallel Channel formation dating back 10 years
    • Potential price targets between $4.5 and $14
    • Current trading volume up 56% in 24 hours

    SPONSORED

    Trade DOGE with up to 100x leverage on perpetual contracts

    Trade Now on Defx

    Short-Term Price Action and Support Levels

    While the long-term outlook appears bullish, traders should note potential short-term volatility. Technical analyst Trader Tardigrade has identified a bearish Tweezer candlestick pattern at $0.176, suggesting possible near-term resistance. Key levels to watch:

    • Current resistance: $0.176
    • Critical support: $0.143
    • Trading range: $0.143 – $0.176

    Market Sentiment and Volume Analysis

    Current market data shows significantly improved sentiment toward DOGE:

    • 24-hour price increase: 2%
    • Trading volume surge: 56%
    • Current price: $0.175

    Frequently Asked Questions

    What is driving Dogecoin’s current price movement?

    The broader crypto market bullishness, increased trading volume, and technical pattern formations are primary drivers of DOGE’s current price action.

    What are the key price targets for Dogecoin?

    According to expert analysis, DOGE could reach between $4.5 and $14 during the current bull market cycle, contingent on maintaining support above $0.16.

    What are the main risks to consider?

    Short-term risks include potential resistance at $0.176 and the possibility of a retest of lower support at $0.143 before any significant upward movement.

  • Dogecoin Price Alert: Bollinger Band Squeeze Signals Major Move

    Dogecoin (DOGE) is showing signs of an imminent breakout as technical indicators point to compressed volatility on the 12-hour timeframe. Top crypto analyst Ali Martinez has identified a critical Bollinger Band squeeze pattern that historically precedes significant price movements for the leading meme coin.

    The popular cryptocurrency has been trading in an increasingly tight range between $0.16 and $0.18 since March 11, with bulls struggling to generate momentum above key resistance levels. This consolidation phase comes as DOGE tests crucial support at $0.17, setting up what technical analysts believe could be a decisive move in either direction.

    Technical Analysis Points to Building Pressure

    According to Martinez’s analysis shared on X (formerly Twitter), Dogecoin’s Bollinger Bands are experiencing significant tightening on the 12-hour chart – a technical formation known as a “squeeze.” This pattern typically signals an upcoming surge in volatility, though the direction remains uncertain until a clear breakout occurs.

    SPONSORED

    Trade DOGE with up to 100x leverage on perpetual contracts

    Trade Now on Defx

    Key Price Levels to Watch

    Currently trading at $0.176, DOGE faces immediate resistance at $0.18, followed by the psychologically important $0.20 level. A successful break above these barriers could trigger renewed buying interest and potentially signal the start of a recovery rally.

    On the downside, the $0.15 support level remains critical. A breakdown below this threshold could spark a wave of selling pressure, potentially leading to a deeper retracement in DOGE prices.

    Market Sentiment and Outlook

    While the broader crypto market shows mixed signals, Dogecoin’s tight consolidation phase suggests accumulation could be taking place. The resolution of this Bollinger Band squeeze will likely determine DOGE’s trajectory for the coming weeks.

    Frequently Asked Questions

    What is a Bollinger Band squeeze?
    A Bollinger Band squeeze occurs when volatility decreases significantly, causing the bands to narrow. This typically precedes a strong price move in either direction.

    What are the key levels for Dogecoin traders?
    Key resistance levels are at $0.18 and $0.20, while major support sits at $0.15.

    When might Dogecoin break out of its current range?
    While exact timing is impossible to predict, the tightening Bollinger Bands suggest a significant move could occur within the next few days to weeks.

  • Dogecoin Price Alert: Critical $0.139 Support Could Trigger Major Rally

    Dogecoin (DOGE) appears to be approaching a pivotal moment as key technical indicators suggest a major price move could be imminent. Crypto analyst Kevin (@Kev_Capital_TA) has identified the $0.139 level as a critical support zone that could determine DOGE’s next significant price action.

    As Dogecoin continues testing key support levels, multiple technical indicators are aligning to suggest a potential trend reversal. The analysis points to several crucial factors that could influence DOGE’s price trajectory in the coming weeks.

    Technical Indicators Signal Potential Trend Shift

    The Weekly Stochastic RSI has reached a full reset, while the 3-Day MACD is approaching its reset point. The Two-Week Stochastic RSI requires approximately one more month to align with the lower region. This convergence of technical indicators often precedes significant price movements.

    SPONSORED

    Trade DOGE with up to 100x leverage on perpetual contracts

    Trade Now on Defx

    Critical Support Level Analysis

    The $0.139 price level has emerged as a crucial support zone for Dogecoin. Kevin emphasizes that maintaining this level is vital for the bullish thesis to remain valid. A weekly close below this threshold could trigger increased selling pressure and invalidate the positive outlook.

    Bitcoin Correlation and Market Impact

    DOGE’s price action remains closely tied to Bitcoin’s performance. The analyst suggests that Bitcoin needs to maintain levels above $70,000 to support Dogecoin’s potential upward movement. This correlation highlights the importance of broader market conditions for DOGE’s price trajectory.

    Risk-Reward Analysis

    According to Kevin, the current setup presents an attractive risk-reward ratio for traders. The potential upside significantly outweighs the downside risk, provided the $0.139 support holds on weekly closes.

    FAQ Section

    What is the key support level for Dogecoin?

    The critical support level is $0.139, which must hold on weekly closes to maintain the bullish outlook.

    How does Bitcoin affect Dogecoin’s price?

    Bitcoin needs to maintain levels above $70,000 to support Dogecoin’s potential upward movement due to their high correlation.

    When could the next major move occur?

    Technical indicators suggest a significant move could occur within the next month as multiple timeframe indicators complete their reset phases.

    At the time of writing, DOGE is trading at $0.19, maintaining a position above the critical support level as the market awaits potential catalysts for the next major move.

  • Dogecoin Whales Accumulate 120M DOGE: Major Breakout Ahead?

    Dogecoin Whales Accumulate 120M DOGE: Major Breakout Ahead?

    In a significant development for Dogecoin (DOGE) investors, whale wallets have accumulated over 120 million DOGE tokens in the past week, potentially signaling growing confidence in the leading meme coin’s prospects. This accumulation comes at a critical time as DOGE consolidates between key support and resistance levels.

    The latest on-chain data from Santiment reveals major holders are positioning themselves for a potential price movement, even as DOGE trades in a tight range between $0.16 and $0.18. This whale activity gains particular significance in light of recent bearish predictions from analysts, suggesting smart money may be betting on a reversal.

    Technical Analysis: Critical Support and Resistance Levels

    DOGE is currently testing critical support at $0.15, with immediate resistance at $0.17. A breakthrough above $0.18 could trigger renewed buying interest, while a breakdown below $0.15 might lead to further downside. The consolidation phase has lasted since March 11, creating a coiled spring effect that could result in a volatile move once resolved.

    SPONSORED

    Trade Dogecoin with up to 100x leverage on perpetual contracts

    Trade Now on Defx

    On-Chain Metrics Paint Bullish Picture

    Beyond price action, on-chain metrics suggest growing institutional interest. The 120 million DOGE accumulation by whales represents a significant position-building exercise, particularly noteworthy given upcoming DeFi integrations that could expand DOGE’s utility.

    Market Outlook and Price Targets

    For bulls to regain control, DOGE needs to reclaim $0.20 as support. This level could serve as a springboard for a push toward higher targets. However, failure to hold current support could see prices test lower levels at $0.13 or $0.12.

    FAQ Section

    Q: What does whale accumulation mean for DOGE price?
    A: Whale accumulation often precedes significant price movements, as large holders typically position themselves before major market shifts.

    Q: What are the key resistance levels to watch?
    A: The immediate resistance lies at $0.17, with major resistance at $0.18 and $0.20.

    Q: Could DOGE break down from current levels?
    A: Yes, if support at $0.15 fails, DOGE could test lower levels at $0.13 or $0.12.

  • Dogecoin Price Enters No-Trade Zone: Key $0.143 and $0.187 Levels to Watch

    The Dogecoin (DOGE) market has entered a critical phase as leading analysts identify a ‘no-trade zone,’ with multiple technical indicators suggesting a period of consolidation before the next major move. This analysis comes as DOGE whales continue their accumulation pattern in 2025, despite the recent price uncertainty.

    Understanding Dogecoin’s Current Trading Range

    According to prominent crypto analyst Crypto VIP, DOGE has established a clear trading range following its recent downtrend. The critical levels to monitor are:

    • Support zone: $0.143 – $0.149
    • Resistance zone: $0.176 – $0.187
    • Secondary resistance: $0.23 – $0.24

    Expert Price Predictions and Technical Analysis

    Multiple analysts have weighed in on DOGE’s potential price trajectory:

    Bullish Scenarios

    • Ali Martinez projects a 16% price movement upon breaking the $0.16-$0.18 range
    • Master Kenobi suggests potential for new ATH reaching $0.80
    • June price target of $1.00 remains in play

    Cautionary Outlook

    Trader Tardigrade identifies bearish signals:

    • Bearish Tweezer pattern formation
    • False breakout at $0.176
    • Potential retest of $0.143 support

    SPONSORED

    Trade Dogecoin with up to 100x leverage on perpetual contracts

    Trade Now on Defx

    Trading Strategy Recommendations

    For traders looking to capitalize on DOGE’s next move, experts suggest:

    1. Wait for clear breakout above $0.187 resistance
    2. Monitor support at $0.143 for potential entry points
    3. Watch for higher lows formation near $0.176

    Current Market Status

    As of the latest market data, DOGE is trading at $0.164, showing a 3% decline in 24-hour trading volume. This price action aligns with the broader market consolidation pattern observed in major cryptocurrencies.

    Frequently Asked Questions

    What is a no-trade zone in cryptocurrency?

    A no-trade zone refers to a price range where the asset shows no clear directional bias, making it risky to enter new positions until a breakout occurs.

    Why is $0.187 a significant resistance level for Dogecoin?

    This level represents a key technical resistance point where previous rallies have faced selling pressure, making it a crucial barrier for future upward movement.

    What could trigger a breakout from the current range?

    A breakout could be triggered by increased trading volume, positive market sentiment, or significant news affecting the broader cryptocurrency market.

  • Dogecoin Price Alert: Technical Analysis Points to 16% Surge

    Dogecoin (DOGE) appears poised for a significant upward move according to multiple technical analysts, with price patterns suggesting an imminent 16% rally from current levels. This analysis comes as previous technical forecasts have indicated strong bullish momentum for the popular meme coin.

    Short-Term Analysis Shows Bullish Triangle Formation

    Respected crypto analyst Ali Martinez has identified a symmetrical triangle pattern on the hourly timeframe, with DOGE currently trading between $0.16-$0.18. The pattern shows progressively higher lows following a 16.46% decline from $0.18 to $0.14, suggesting accumulation at lower levels.

    Key Price Levels to Watch

    The critical resistance zone lies between $0.16-$0.18, with a convincing break above this range potentially triggering a 16% surge. Support has formed near $0.144, creating a solid foundation for the next leg up.

    SPONSORED

    Trade DOGE with up to 100x leverage on perpetual contracts

    Trade Now on Defx

    Long-Term Technical Setup Confirms Bullish Outlook

    Adding weight to the bullish case, analyst CW has identified a falling wedge pattern on the daily timeframe dating back to December 2024. This traditionally bullish pattern has now seen a confirmed breakout, with price action crossing above the descending resistance line.

    Fibonacci Levels Signal Potential Targets

    Key Fibonacci retracement levels have been established at:

    • $0.2027 (0.236 retracement)
    • $0.2564 (0.382 retracement)
    • $0.2999 (0.5 retracement)
    • $0.3433 (0.618 retracement)
    • $0.4839 (1.0 retracement)

    FAQ Section

    Q: What is the immediate price target for Dogecoin?
    A: The immediate target following a breakout would be a 16% move from the $0.16-$0.18 range.

    Q: What technical patterns support the bullish outlook?
    A: Two key patterns: a symmetrical triangle on the hourly chart and a falling wedge on the daily timeframe.

    Q: What is the ultimate price target according to the analysis?
    A: The most optimistic target sits at the 1.618 Fibonacci extension of $0.71.

    At press time, DOGE trades at $0.17, maintaining position above crucial support levels as traders await confirmation of the anticipated breakout.

  • Dogecoin Price Alert: Bullish Pattern Targets $0.43 Breakout

    Dogecoin Price Alert: Bullish Pattern Targets $0.43 Breakout

    Dogecoin (DOGE) is showing signs of a potential major breakout as the popular meme coin forms a bullish technical pattern on daily timeframes. Currently consolidating between $0.16-$0.18, DOGE appears primed for significant upside movement according to leading crypto analysts.

    Top cryptocurrency analyst Carl Runefelt has identified a falling wedge pattern formation on DOGE’s daily chart – a historically bullish signal that could trigger a massive rally. His technical analysis suggests a breakout target of $0.434, representing a potential 155% surge from current levels.

    Recent analysis showing major DOGE whale accumulation adds further credence to the bullish outlook, as large holders appear to be positioning for an upward move.

    SPONSORED

    Trade DOGE with up to 100x leverage on perpetual contracts

    Trade Now on Defx

    Technical Analysis Points to Imminent Breakout

    The falling wedge pattern identified by Runefelt is characterized by converging trendlines with a downward slope. This pattern typically signals a potential trend reversal, with price often breaking out to the upside once the pattern completes.

    Key technical levels to watch:

    • Current support: $0.16
    • Immediate resistance: $0.18
    • Major resistance: $0.20
    • Breakout target: $0.434

    Market Context and Risk Factors

    While the technical setup appears promising, traders should note that DOGE remains down 70% from its December highs. The broader crypto market uncertainty, particularly Bitcoin’s recent downtrend, could impact DOGE’s ability to execute a clean breakout.

    FAQ

    Q: What could trigger a DOGE breakout?
    A: A combination of increased buying volume, positive market sentiment, and a break above $0.20 could confirm the bullish pattern.

    Q: What are the key support levels to watch?
    A: The critical support zone lies between $0.15-$0.16. A break below could invalidate the bullish setup.

    Q: What’s the timeframe for the potential breakout?
    A: The pattern suggests a breakout could occur within the next 2-4 weeks, though exact timing remains uncertain.

  • Dogecoin Whales Accumulate 110M DOGE: $1 Price Target Emerges

    Dogecoin Whales Accumulate 110M DOGE: $1 Price Target Emerges

    In a significant development for the popular meme cryptocurrency, crypto analysts are eyeing a potential Dogecoin surge to $1 as whale accumulation reaches notable levels. This bullish outlook comes amid increasing large-holder activity and favorable technical indicators.

    Recent data shows major cryptocurrency investors, commonly known as ‘whales,’ have acquired over 110 million DOGE tokens in the past week alone, signaling strong institutional confidence in the token’s future. This accumulation pattern bears similarity to previous whale movements that preceded significant price rallies.

    Current Market Position

    Dogecoin currently trades at $0.1678, experiencing a modest 2% weekly gain despite broader market headwinds. While the token has faced a 36% decline in recent months, its market fundamentals remain robust with:

    • Market capitalization: $25 billion
    • 24-hour trading volume: $816 million
    • Market dominance: 0.92%

    SPONSORED

    Trade DOGE with up to 100x leverage on perpetual contracts

    Trade Now on Defx

    Technical Analysis Points to Potential Breakout

    The Stochastic RSI, a key technical indicator, suggests DOGE could be preparing for a trend reversal. Trader Tardigrade’s analysis highlights the possibility of the token breaking its current downtrend and targeting the psychological $1 level.

    FAQ: Dogecoin’s $1 Potential

    Q: What factors support a $1 price target?
    A: Increased whale accumulation, positive technical indicators, and historical price patterns suggest potential for significant upside.

    Q: How significant is the current whale accumulation?
    A: The 110 million DOGE accumulation represents one of the largest concentrated buying periods in recent months.

    Q: What are the key resistance levels to watch?
    A: Primary resistance levels exist at $0.20, $0.35, and $0.50 before the $1 target becomes viable.

    Market Implications

    The convergence of whale accumulation and technical indicators suggests a potential shift in DOGE’s market dynamics. While short-term volatility remains a concern, the long-term outlook appears increasingly positive based on institutional investor confidence and technical analysis.