Dogecoin (DOGE) has entered a decisive bullish phase, with the popular meme cryptocurrency showing strong momentum above the critical $0.24 level. Technical analysis suggests DOGE could be preparing for a major breakout, potentially targeting the psychologically important $0.30 mark.
DOGE Technical Analysis: Key Levels to Watch
The latest price action shows DOGE establishing strong support above $0.24, with several technical indicators pointing to continued upward momentum. As noted in our recent coverage of Dogecoin’s potential rally to $1, the current market structure suggests bulls are firmly in control.
Key technical levels include:
- Current Support: $0.2450
- Major Resistance: $0.2550
- Secondary Resistance: $0.2620
- Bull Target: $0.3000
Bullish Pattern Formation
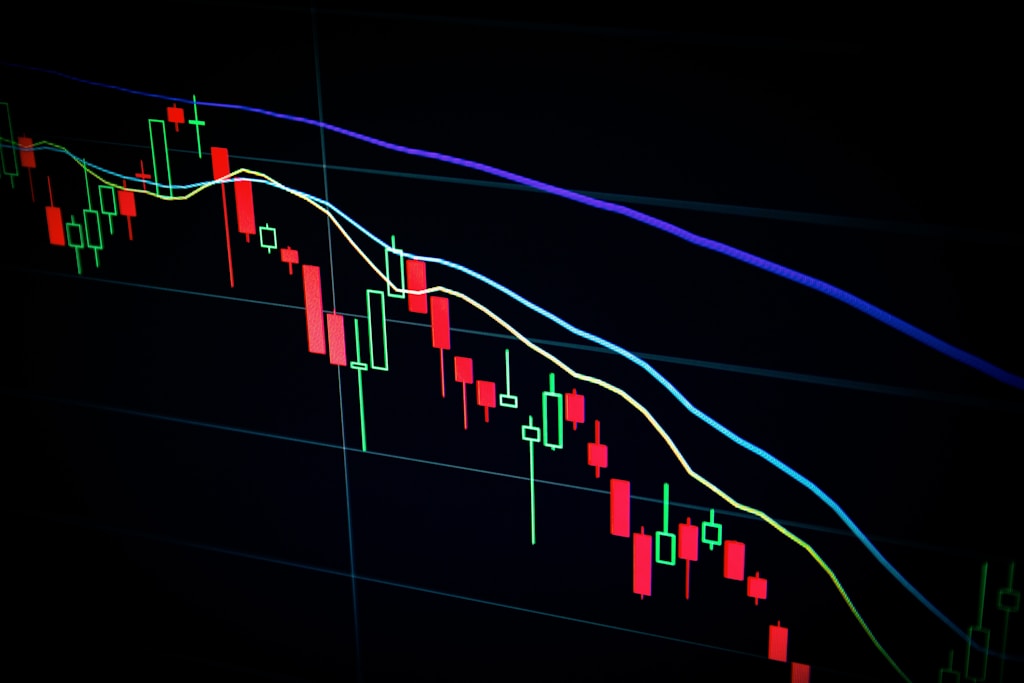
A bullish trend line has formed on the hourly chart, providing support at $0.2460. This technical formation, combined with the price trading above the 100-hourly simple moving average, suggests strong buying pressure in the market.
Volume Analysis and Market Sentiment
Trading volume has seen a significant uptick, with the MACD indicator gaining momentum in the bullish zone. The RSI reading above 50 further confirms the positive market sentiment.
Key Support and Resistance Zones
Critical support levels have been established at:
- Primary Support: $0.2450
- Secondary Support: $0.2385
- Last Line of Defense: $0.2320
Potential Scenarios and Risk Management
While the overall trend remains bullish, traders should watch for potential resistance at $0.2550. A successful break above this level could trigger a rally toward $0.2840, with $0.30 as the next major target.
FAQ Section
What is driving Dogecoin’s current price increase?
Technical factors, including increased buying pressure and favorable chart patterns, are primarily driving the current rally.
What are the key levels to watch for DOGE?
The immediate resistance is at $0.2550, while strong support exists at $0.2450.
Could DOGE reach $0.30 in the near term?
Technical indicators suggest a potential move to $0.30 if current momentum continues and key resistance levels are broken.
Technical Indicators Summary:
- MACD: Bullish momentum increasing
- RSI: Above 50, indicating healthy buying pressure
- Moving Averages: Price above 100-hourly SMA
- Volume: Above average, supporting the upward move