Tag: Dogecoin

  • Dogecoin Price Alert: Critical Triangle Pattern Signals $0.19 Test

    Dogecoin Price Alert: Critical Triangle Pattern Signals $0.19 Test

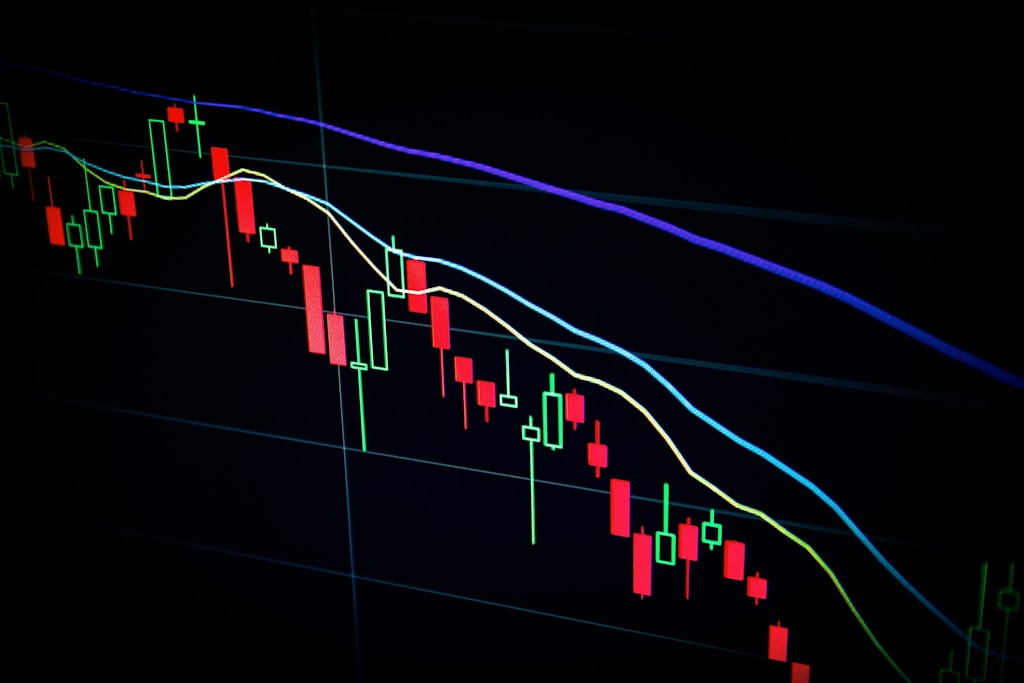
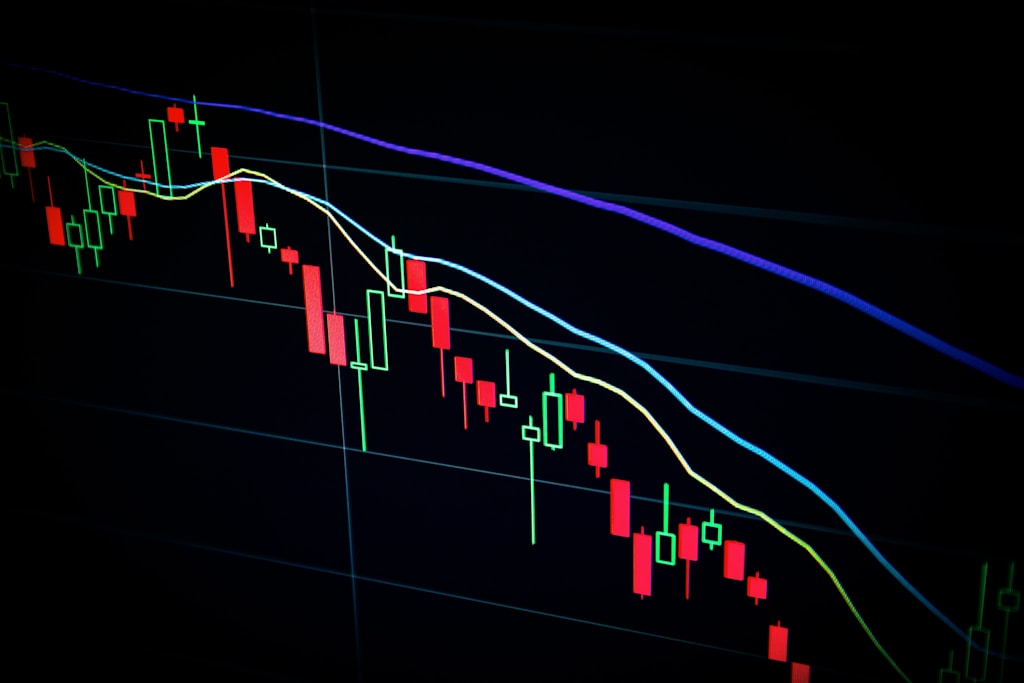
    Dogecoin (DOGE) has entered a critical technical phase as price action consolidates within a bearish descending triangle pattern, suggesting an imminent major move. The popular meme cryptocurrency is showing signs of increased selling pressure while testing key support levels that could determine its short-term trajectory.

    As recent analysis predicted a critical June breakout for DOGE, the current price compression adds weight to that forecast. Technical indicators now point to a potential bearish resolution unless buyers can mount a strong defense.

    Technical Analysis Shows Mounting Bearish Pressure

    Market analyst Thomas Anderson has identified a clear descending triangle formation on the M30 timeframe, with DOGE currently testing upper resistance around $0.19998. This critical technical structure is reinforced by multiple factors:

    • 200-period moving average acting as dynamic resistance
    • Declining volume during consolidation phase
    • Lower highs forming along the descending trendline
    • Horizontal support at $0.19010 showing early signs of weakness

    SPONSORED

    Trade DOGE with up to 100x leverage on perpetual contracts

    Trade Now on Defx

    Key Price Levels to Watch

    The immediate resistance level at $0.19998 represents a crucial battleground for bulls and bears. A decisive break above this level could invalidate the bearish setup and potentially trigger a relief rally. However, failure to breach this resistance could accelerate the downward pressure, targeting the following support zones:

    • Primary support: $0.19010
    • Secondary support: $0.18500
    • Last line of defense: $0.18000

    Volume Analysis and Market Sentiment

    Trading volume has shown a notable decline during this consolidation phase, typically a precursor to a significant price move. The compression of price action near the triangle’s apex suggests an explosive move could be imminent, with the direction likely determined by which level breaks first – resistance or support.

    FAQ: Critical Dogecoin Price Levels

    Q: What is the key resistance level for Dogecoin?
    A: The critical resistance level is currently at $0.19998, aligned with the descending triangle’s upper trendline.

    Q: Where is the main support level for DOGE?
    A: The primary support level sits at $0.19010, which has held firm during recent tests.

    Q: What could trigger a bullish reversal?
    A: A decisive break above $0.19998 with increased volume could invalidate the bearish pattern and trigger a recovery.

    Conclusion: Preparing for Volatility

    As Dogecoin approaches the apex of this descending triangle pattern, traders should prepare for increased volatility. While the technical structure suggests bearish pressure, the cryptocurrency market’s unpredictable nature means both scenarios remain possible. Risk management and proper position sizing become crucial during such technical setups.
  • Dogecoin Price Alert: Critical June Breakout Could Prevent 6-Month Downtrend

    Dogecoin (DOGE) stands at a crucial inflection point that could determine its price trajectory for the next six months, according to prominent crypto analyst VisionPulsed. Technical indicators suggest an imminent major move that must materialize within the next two weeks to avoid prolonged bearish conditions.

    Technical Analysis Points to Major Price Movement

    The Bollinger Band Width Percentile (BBWP) for DOGE is showing extreme compression levels that historically precede significant price expansion. This technical setup, combined with a newly triggered hash-ribbon buy signal, suggests heightened volatility is imminent.

    “We’re going to get a large move in June. The question is simply direction,” notes VisionPulsed, highlighting that the current BBWP readings cannot sustain beyond the next two weekly candles.

    SPONSORED

    Trade DOGE with up to 100x leverage on perpetual contracts

    Trade Now on Defx

    Critical Timing Window for Bulls

    The analysis reveals a 70-to-80-day cycle pattern in Dogecoin’s price movements, with the current window set to expire in mid-June. This timing coincides with crucial support levels that could trigger a recovery if properly defended.

    Adding to the complexity, the stock-RSI on the two-day chart has turned lower for the first time since 2024, potentially threatening the bullish scenario. A failure to quickly recover could invalidate recent positive signals and usher in an extended bearish phase.

    Macro Factors and Market Structure

    The broader market context adds another layer of significance to Dogecoin’s current position. With the S&P 500 approaching all-time highs, traditional market movements could significantly influence crypto sentiment. Meanwhile, DOGE continues forming higher lows – a constructive but fragile pattern that needs immediate upside continuation to remain valid.

    Binary Outcome Scenario

    For traders, the situation presents a clear binary choice:

    • Upside Breakout: Would validate technical signals and maintain bullish structure
    • Failure to Rally: Could trigger a “bearish spiral” lasting through summer

    At press time, DOGE trades at $0.1958, with immediate resistance at $0.20 and support at $0.185.

    Frequently Asked Questions

    Q: What is the key price level Dogecoin needs to break?
    A: The immediate resistance at $0.20 needs to be cleared within the next two weeks to avoid bearish continuation.

    Q: How long could the bearish phase last if June fails to deliver upside?
    A: Analysis suggests potential bearish conditions could extend through September, resulting in six consecutive red monthly candles.

    Q: What technical indicators are currently most relevant?
    A: The Bollinger Band Width Percentile (BBWP) and hash-ribbon signals are primary indicators to watch, along with the 70-80 day cycle pattern.

  • Dogecoin Price Tests $0.20: Key Support Levels Could Trigger Recovery

    Dogecoin Price Tests $0.20: Key Support Levels Could Trigger Recovery

    Dogecoin (DOGE) is showing signs of consolidation after a sharp decline from $0.2250, with critical support levels emerging that could determine its next major move. As the broader meme coin sector experiences volatility, DOGE’s price action suggests a potential recovery might be brewing if key resistance levels are breached.

    DOGE Price Analysis: Technical Overview

    The popular meme cryptocurrency has entered a crucial phase as it tests multiple support levels. After failing to maintain momentum above $0.2450, DOGE experienced a significant pullback, with bears pushing the price below several key technical levels. This price action coincides with broader developments in the meme coin ecosystem, suggesting potential market-wide shifts ahead.

    Key Technical Levels to Watch

    • Current Price: Trading below $0.20 and the 100-hourly SMA
    • Critical Support: Bullish trend line at $0.1910
    • Major Resistance: $0.2060 (50% Fibonacci retracement level)
    • Secondary Resistance: $0.2120 and $0.2250

    SPONSORED

    Trade meme coins with up to 100x leverage and maximize your potential returns

    Trade Now on Defx

    Bullish Scenario

    A breakthrough above $0.20 could trigger a significant recovery rally. The price action suggests accumulation at current levels, with the RSI hovering above 50, indicating potential bullish momentum building. If buyers can push past $0.2060, the next major targets include:

    • Primary target: $0.2250
    • Secondary target: $0.2340
    • Ultimate resistance: $0.2500

    Bearish Risks

    Failure to reclaim $0.20 could lead to further downside pressure. Critical support levels to monitor include:

    • Initial support: $0.1910
    • Secondary support: $0.1850
    • Critical support: $0.1720

    Technical Indicators

    • MACD: Showing weakening bearish momentum
    • RSI: Above 50, suggesting potential trend reversal
    • Moving Averages: Price below 100-hourly SMA indicates short-term bearish bias

    FAQ Section

    What is causing Dogecoin’s current price movement?

    The recent decline appears to be driven by broader market sentiment and profit-taking after DOGE failed to break above $0.2450.

    Could Dogecoin recover to previous highs?

    Technical indicators suggest a recovery is possible if $0.20 resistance is cleared, but this depends on broader market conditions and momentum.

    What are the key levels traders should watch?

    The immediate focus should be on the $0.20 resistance and $0.1910 support levels, as these could determine the next major price movement.

  • Dogecoin Price Forms Bullish Pattern: 300% Rally to $0.50 Brewing

    Dogecoin Price Forms Bullish Pattern: 300% Rally to $0.50 Brewing

    Dogecoin (DOGE) is showing signs of a major trend reversal as price action completes a rare rounded bottom formation on monthly timeframes. Currently trading at $0.196, DOGE has maintained crucial support above $0.18 despite recent market volatility, setting up for what technical analysts predict could be a 300% rally to $0.50.

    Technical Analysis: Monthly Rounded Bottom Pattern Emerges

    A comprehensive analysis shared on TradingView reveals that DOGE is in the final stages of completing a rounded bottom pattern that has been forming since 2021. This technical formation, spanning nearly four years, began during the explosive bull run that saw DOGE reach its all-time high of $0.73.

    The pattern’s significance is amplified by its timeframe – monthly charts typically provide stronger signals for long-term trend changes. Recent meme coin momentum adds further credibility to the potential breakout scenario.

    SPONSORED

    Trade meme coins with up to 100x leverage on perpetual contracts

    Trade Now on Defx

    Key Price Levels and Breakout Targets

    Current support levels:
    – Strong support: $0.18
    – Immediate resistance: $0.22
    – Key breakout level: $0.27

    The rounded bottom formation suggests three potential price targets:

    • Initial target: $0.48 (December 2024 high)
    • Secondary target: $0.50 (psychological resistance)
    • Maximum target: $0.73 (all-time high)

    Market Factors Supporting the Bullish Case

    Several fundamental factors support the technical setup:

    • Consistent higher lows since mid-2022
    • Strong buying pressure at support levels
    • Increased institutional interest in meme coins
    • Growing mainstream adoption of DOGE

    Risk Factors to Consider

    While the setup appears promising, traders should consider these risks:

    • Monthly timeframe patterns require patience
    • Potential false breakouts near resistance levels
    • General crypto market correlation
    • Regulatory uncertainties

    FAQ

    Q: What is a rounded bottom pattern?
    A: A rounded bottom is a long-term reversal pattern that forms at the end of extended downtrends, indicating gradual shift from bearish to bullish control.

    Q: How reliable are monthly timeframe patterns?
    A: Monthly patterns are considered more reliable than shorter timeframes due to the significant amount of trading activity they represent.

    Q: What could invalidate this pattern?
    A: A monthly close below $0.18 would seriously damage the pattern’s validity and could signal further downside.

    Traders should maintain strict risk management and consider broader market conditions before taking positions based on this analysis.

  • Dogecoin Price Hits Critical $0.19 Level: Analysts Eye 413% Rally Target

    Dogecoin Price Hits Critical $0.19 Level: Analysts Eye 413% Rally Target

    Dogecoin (DOGE) has reached a decisive moment at the $0.19 price level, with leading crypto analysts identifying a rare technical confluence that could determine the meme coin’s trajectory for the remainder of 2025. Two respected technical analysts have independently identified the same critical price zone, suggesting increased validity of their findings.

    Technical Analysis Points to Make-or-Break Zone

    According to analyst Cantonese Cat, DOGE is currently testing a crucial demand band between $0.1850 and $0.1950. This zone has acted as both support and resistance since February 2025, with the latest price action forming what the analyst describes as a “trident bottom” pattern.

    “The formation isn’t your typical tweezer bottom – we’re looking at a trident bottom testing key demand levels,” notes Cantonese Cat. A decisive close above $0.1950 could trigger a rally toward the $0.2150 resistance, while a breakdown below $0.1850 risks a decline to April’s low of $0.13.

    SPONSORED

    Trade DOGE with up to 100x leverage on perpetual contracts

    Trade Now on Defx

    Long-term Outlook Remains Bullish

    ANBESSA’s analysis provides a broader context, tracking DOGE’s movement since September 2024. The analyst highlights an impressive 413% rally from $0.09, followed by a corrective phase that appears to be nearing completion. The current price action aligns with the 0.382 Fibonacci retracement level at $0.1412, coinciding with both the parabolic guide curve and the 99-day moving average.

    This technical confluence aligns with recent market developments, as meme coins have shown significant strength in June, suggesting potential for continued upward momentum in the DOGE ecosystem.

    Key Price Levels to Watch

    Traders should monitor these critical price levels:

    • Immediate resistance: $0.1950-$0.2150
    • Major resistance zone: $0.2686-$0.3000
    • Ultimate target: $0.4245 (0.786 Fibonacci level)
    • Critical support: $0.1850
    • Secondary support: $0.1412

    At press time, DOGE trades at $0.196, maintaining position above the crucial support zone while momentum indicators remain neutral.

    Frequently Asked Questions

    Q: What is the key price level for Dogecoin right now?
    A: The critical zone is between $0.1850 and $0.1950, acting as a make-or-break level for DOGE’s next major move.

    Q: What is the potential upside target for DOGE?
    A: Technical analysis suggests a potential rally to $0.4245 if current support holds, representing the 0.786 Fibonacci retracement level.

    Q: What are the main risk levels to watch?
    A: A break below $0.1850 could trigger a decline to $0.13, while holding above $0.1950 could initiate the next leg up.

  • Solana, XRP, Dogecoin Prices Slump as Market Sentiment Weakens

    Leading altcoins Solana (SOL), XRP, and Dogecoin (DOGE) have experienced significant downward pressure this week, underperforming Bitcoin amid growing trade tensions and diminishing retail interest. This market movement follows a broader cryptocurrency sector pullback that has particularly impacted alternative digital assets.

    Market Analysis: Why Are Altcoins Underperforming?

    The recent decline comes as Dogecoin struggles to maintain key support levels, while XRP faces resistance in its attempt to reach higher price targets. Solana, despite its strong technological fundamentals, has not been immune to the market-wide correction.

    Key Factors Driving the Decline:

    • Escalating trade tensions affecting global markets
    • Reduced retail trading volume
    • Bitcoin dominance increasing during market uncertainty
    • Institutional investors favoring BTC over altcoins

    SPONSORED

    Trade meme coins with up to 100x leverage and maximize your potential returns

    Trade Now on Defx

    Technical Analysis and Price Levels

    Recent price action suggests key support levels are being tested:

    Asset Key Support Weekly Change
    Solana (SOL) $95 -8.5%
    XRP $1.85 -6.2%
    Dogecoin $0.187 -12.3%

    Expert Outlook and Market Predictions

    Market analysts suggest this could be a temporary correction before a potential recovery. XRP’s price structure indicates a possible breakout once market conditions improve.

    FAQ Section

    Why are altcoins falling more than Bitcoin?

    During periods of market uncertainty, investors typically move capital from riskier assets (altcoins) to more established cryptocurrencies like Bitcoin.

    When might we see a recovery?

    Technical indicators suggest a potential reversal once global trade tensions ease and retail interest returns to the market.

    What should investors watch for?

    Key indicators include trading volume, Bitcoin dominance ratio, and global macro events affecting risk assets.

  • Dogecoin Price Dips Below $0.20: Key Support at $0.187 Could Trigger Rally

    Dogecoin Price Dips Below $0.20: Key Support at $0.187 Could Trigger Rally

    Dogecoin (DOGE) has fallen below the psychological $0.20 level amid broader crypto market weakness, presenting a potential buying opportunity for investors eyeing the popular meme coin. However, leading analysts suggest waiting for specific price action signals before accumulating positions.

    Strategic Entry Points for DOGE Buyers

    Crypto analyst DecyX has outlined a precise entry strategy, recommending investors wait for DOGE to test liquidity below $0.187 before initiating positions. This analysis aligns with our recent coverage in Dogecoin Price Alert: Critical $0.187 Support Could Trigger 15% Drop, which highlighted this crucial support level.

    SPONSORED

    Trade Dogecoin with up to 100x leverage on perpetual contracts

    Trade Now on Defx

    Technical Analysis Points to Potential Reversal

    Multiple technical indicators suggest DOGE could be approaching a significant bottom:

    • Double bottom formation on the 4-hour chart near $0.18
    • Hidden bullish divergence on the daily RSI
    • Symmetrical triangle breakout on the 1-hour timeframe
    • Fair Value Gap (FVG) remains untouched above current prices

    Price Targets and Risk Levels

    Analysts have identified key price levels for traders to watch:

    Level Significance
    $0.187 Critical support zone
    $0.213-0.215 Initial target range
    $0.235 Secondary resistance
    $0.2597 Long-term magnet level

    Bitcoin Correlation Remains Strong

    As Bitcoin recently pulled back from its all-time high, DOGE has shown strong correlation with the flagship cryptocurrency. Bitcoin’s recent break below $104K has contributed to downward pressure on altcoins, including Dogecoin.

    Frequently Asked Questions

    What is causing Dogecoin’s current price dip?

    The primary factors include Bitcoin’s correction from ATH, broader market sentiment, and technical resistance at the $0.20 level.

    When is the best time to buy Dogecoin?

    Analysts suggest waiting for confirmation of support at $0.187 and watching for bullish price action on lower timeframes before entering positions.

    What are the key resistance levels to watch?

    The immediate resistance lies at $0.20, followed by the $0.213-0.215 zone and $0.2597 as a longer-term target.

    Current Price Update: DOGE is trading at $0.1906 as of this writing, according to CoinMarketCap data.

  • Dogecoin Price at Critical $0.19 Support: Make-or-Break Moment

    Dogecoin Price at Critical $0.19 Support: Make-or-Break Moment

    Dogecoin (DOGE) has reached a decisive technical junction at $0.19, with multiple analysts identifying this level as the final support before a potential bearish breakdown. This analysis comes as previous warnings about DOGE’s critical $0.187 support level appear to be materializing.

    Technical Analysis Shows Converging Support Levels

    Two prominent analysts have highlighted the significance of the current price level. Kevin (@Kev_Capital_TA) identifies the $0.1901–$0.1839 corridor as crucial, supported by multiple technical factors:

    • 50% Fibonacci retracement of May’s rally to $0.2597
    • 0.618–0.65 retracement cluster at $0.1976-$0.2005
    • Ichimoku cloud support convergence

    Inverse Head and Shoulders Pattern in Focus

    Analyst Cantonese Cat (@cantonmeow) has identified a potential inverse head and shoulders pattern with key levels:

    • Neckline: $0.187-$0.194 range
    • Pattern confirmation: May 9 breakout
    • Current price action: Critical retest of neckline

    SPONSORED

    Trade DOGE with up to 100x leverage on perpetual contracts

    Trade Now on Defx

    Long-term Outlook and Price Targets

    The broader picture shows DOGE trading within a $0.16-$0.42 range, with key resistance levels:

    • Immediate resistance: $0.2117
    • Secondary target: $0.25-$0.26 zone
    • Bullish breakout target: $0.29

    FAQ Section

    Q: What happens if DOGE breaks below $0.19?
    A: A break below could trigger a decline to $0.1694, with further support at $0.14.

    Q: What’s the bullish scenario?
    A: Holding above $0.19 could spark a rally toward $0.2117, with potential for $0.29 on strong momentum.

    Q: How long has DOGE been consolidating?
    A: Seven consecutive months within the $0.16-$0.42 range.

    At press time, DOGE trades at $0.19211, with immediate price action likely to determine the next major trend direction.

  • Dogecoin Price at Risk: Critical $0.187 Support Could Trigger Major Drop

    Dogecoin Price at Risk: Critical $0.187 Support Could Trigger Major Drop

    The Dogecoin (DOGE) price is facing a crucial test at key support levels, despite Bitcoin maintaining near all-time high levels. Recent market analysis suggests DOGE could be at risk of a significant decline if critical support fails to hold.

    After breaking below the psychological $0.20 level, DOGE bears have taken control of the market momentum. Recent large whale movements to Coinbase may be contributing to the increased selling pressure.

    Technical Analysis Points to Critical Support Zone

    According to crypto analyst Lingrid, Dogecoin is currently testing a make-or-break support zone between $0.188-$0.190. This area represents:

    • A critical ascending trendline support
    • The latest higher low in the bullish structure
    • A key psychological price level

    SPONSORED

    Trade DOGE with up to 100x leverage on perpetual contracts

    Trade Now on Defx

    Key Price Levels to Watch

    Traders should monitor these critical price points:

    • Immediate Support: $0.187-$0.190
    • Bullish Target: $0.215 (on successful defense of support)
    • Breakdown Risk: Below $0.187 could trigger accelerated selling

    Market Expert Analysis

    Stanley Crypto reinforces the significance of the current support zone, noting that a break below $0.187 could invalidate the entire bullish setup. The analyst emphasizes that bulls must defend this level to maintain positive market structure.

    FAQ

    Q: What could trigger a DOGE price recovery?
    A: A decisive move above $0.195 with strong volume could signal a trend reversal toward $0.215.

    Q: How does Bitcoin’s price affect DOGE?
    A: Any significant BTC price decline could amplify downward pressure on DOGE, potentially accelerating the breakdown scenario.

    Q: What’s the worst-case scenario?
    A: A break below $0.187 could trigger a cascade of selling, potentially leading to a deeper correction.

  • Dogecoin Price Alert: Critical $0.187 Support Could Trigger 15% Drop

    Dogecoin Price Alert: Critical $0.187 Support Could Trigger 15% Drop

    The Dogecoin (DOGE) price faces a crucial test at the $0.187-$0.190 support zone, with technical analysts warning of potential bearish pressure despite Bitcoin trading near all-time highs. This analysis comes as recent whale movements have sparked speculation about major price impacts in the DOGE market.

    Technical Analysis Shows Critical Support Level

    According to crypto analyst Lingrid, DOGE’s recent price action displays concerning signals as the meme coin struggles to maintain support above $0.20. The current market structure shows:

    • Primary support zone: $0.187-$0.190
    • Key resistance level: $0.195
    • Target recovery level: $0.215

    Bullish Case Remains Valid Above Trendline

    Despite recent drawdowns, the overall structure maintains bullish characteristics, particularly with the price holding above the ascending channel support. Key factors supporting this outlook include:

    • Higher low formation on the ascending channel
    • Price maintaining position above critical trendline
    • Strong buying interest in the $0.187-$0.190 range

    SPONSORED

    Trade meme coins with up to 100x leverage and maximize your profit potential

    Trade Now on Defx

    Risk Factors and Bearish Scenarios

    Several critical factors could trigger a bearish reversal:

    • Break below $0.187 support level
    • Consolidation under $0.195
    • Potential Bitcoin price correction impact

    Expert Analysis and Price Targets

    Stanley Crypto reinforces the significance of the $0.18-$0.19 support zone, noting that this range represents the strongest support level as price action has flattened. A breakdown below these levels could trigger a cascade of selling pressure.

    Frequently Asked Questions

    What is the key support level for Dogecoin?

    The critical support zone lies between $0.187 and $0.190, with $0.187 being the absolute must-hold level to maintain bullish momentum.

    What could trigger a DOGE price recovery?

    A decisive break above $0.195 with strong volume could initiate a recovery toward the $0.215 target level.

    How does Bitcoin’s price affect Dogecoin?

    As demonstrated by recent market action, Bitcoin’s price movements can significantly impact DOGE’s trajectory, with potential BTC corrections posing a risk to DOGE’s support levels.