Tag: Eth Price

  • Ethereum Open Interest Plunges 50% on Binance: Bottom Signal Emerges

    Ethereum Open Interest Plunges 50% on Binance: Bottom Signal Emerges

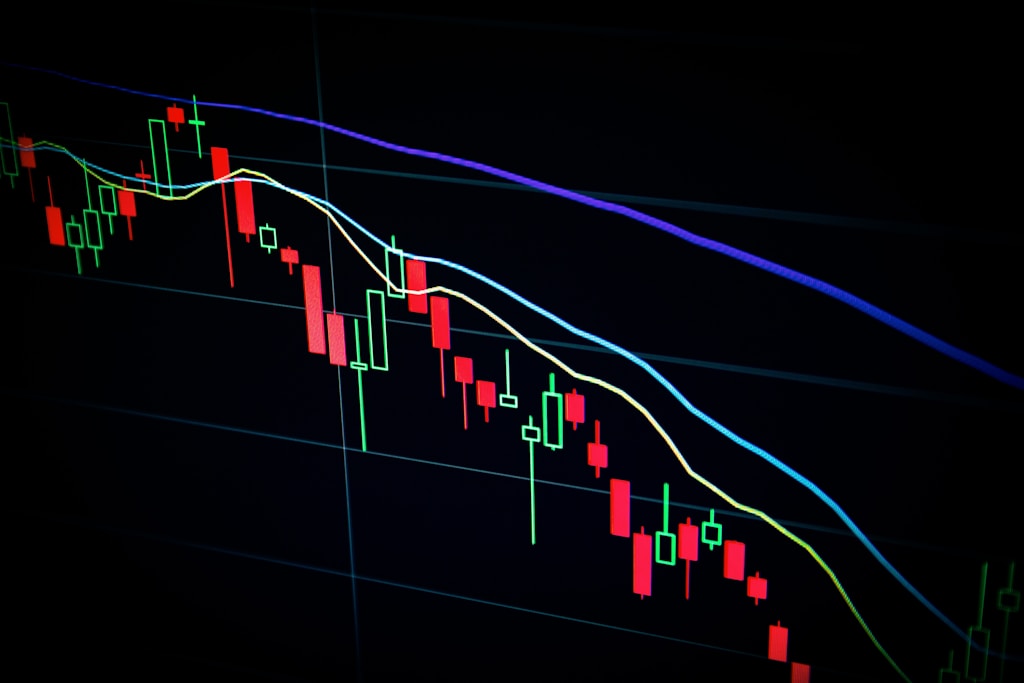
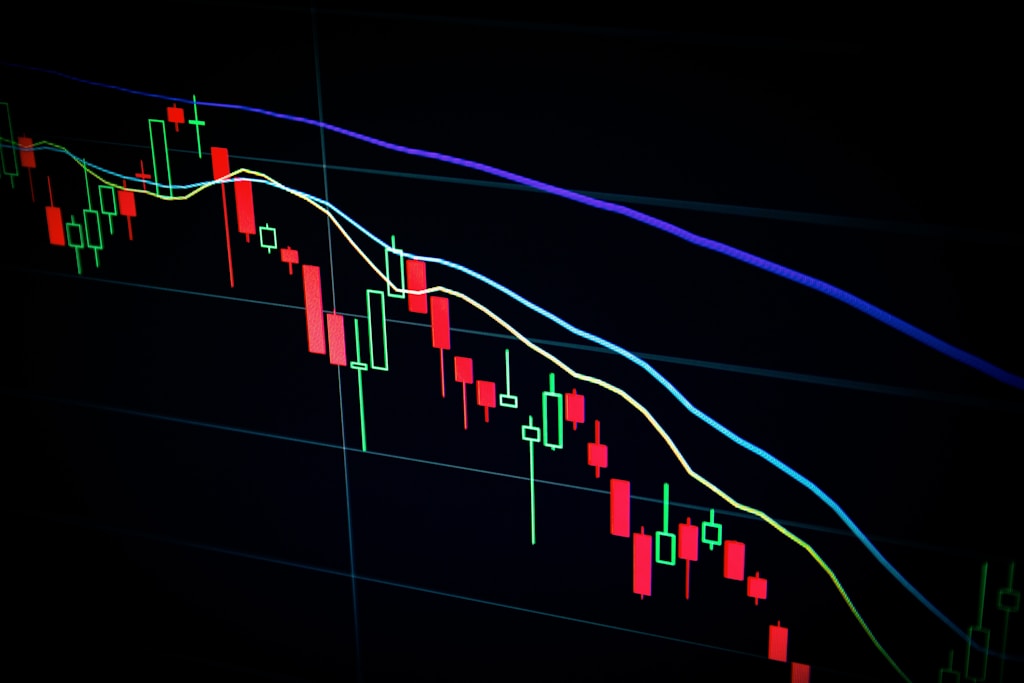
    Ethereum’s derivatives market is showing significant signs of cooling as open interest on Binance has dropped by nearly 50% since December, potentially signaling a major market shift. This dramatic decline comes as ETH price tests critical support levels, raising questions about the altcoin’s near-term trajectory.

    Binance Open Interest Decline Signals Market Caution

    According to CryptoQuant analyst Darkfost, Ethereum’s open interest on Binance has witnessed a sharp decline from its December peak of $7.78 billion to the current level of $3.1 billion. This 50% reduction represents a significant shift in market sentiment and trading activity on the world’s largest cryptocurrency exchange.

    SPONSORED

    Trade Ethereum with up to 100x leverage on perpetual contracts

    Trade Now on Defx

    Key Market Indicators and Technical Analysis

    The current market dynamics reveal several critical factors:

    • Open Interest falling below the 365-day Simple Moving Average (SMA)
    • Price support tested at $1,450 after failing to hold $1,600
    • Significant reduction in speculative trading activity
    • Increased risk aversion among derivatives traders

    Expert Predictions and Market Outlook

    Despite the bearish open interest data, some analysts maintain an optimistic outlook. Market expert Milkybull Crypto suggests that the current price level around $1,585 typically marks a macro bottom for ETH, projecting a potential rally to $10,000 if support holds.

    Frequently Asked Questions

    What does declining open interest mean for Ethereum?

    Declining open interest typically indicates reduced leverage in the market and could signal a period of consolidation before a potential trend reversal.

    How does this affect Ethereum’s price outlook?

    While short-term pressure may persist, historical patterns suggest that significant OI declines often precede major price recoveries.

    What should traders watch for next?

    Key indicators to monitor include trading volume, price action around the $1,450 support level, and any potential reversal in open interest trends.

    As the market continues to evolve, traders should maintain strict risk management practices and monitor these key indicators for potential trend reversals.
  • Ethereum Whale Dumps 10,000 ETH: Market Fears Mount as Price Tests $1,400

    Ethereum Whale Dumps 10,000 ETH: Market Fears Mount as Price Tests $1,400

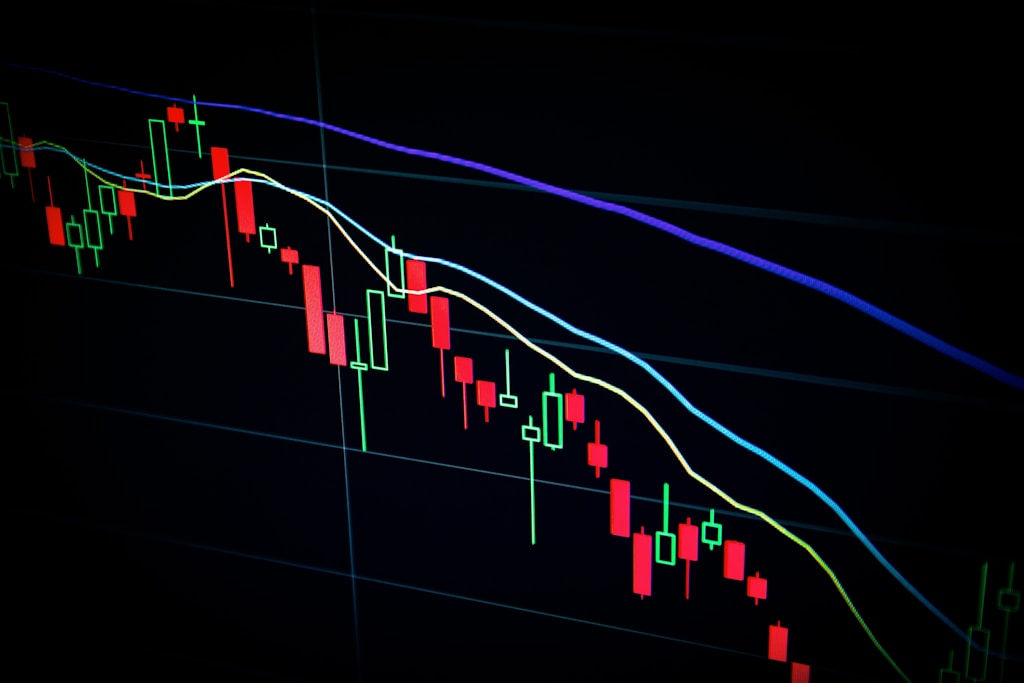
    A major Ethereum whale has offloaded 10,000 ETH worth $15.71 million after a 900-day holding period, triggering concerns of broader market capitulation amid escalating trade tensions. The significant sell-off comes as Trump’s China tariffs continue to rock crypto markets, pushing Ethereum below critical support levels.

    Whale Capitulation Signals Market Uncertainty

    According to on-chain analytics platform Lookonchain, the whale originally accumulated their position at an average price of $1,295 between October and November 2022. Despite holding through Ethereum’s rise above $4,000 in early 2024, the investor chose to exit with a modest $2.75 million profit – far below their peak unrealized gains of $27.6 million.

    SPONSORED

    Trade ETH with up to 100x leverage on perpetual contracts

    Trade Now on Defx

    Broader Market Impact

    This whale’s exit coincides with a larger trend, as ETH/BTC ratio hits a 6-year low. Additional data shows over 500,000 ETH dumped by major holders in just 48 hours, suggesting growing bearish sentiment among large investors.

    World Liberty Financial’s Growing Losses

    Adding to market concerns, Donald Trump’s World Liberty Financial (WLFI) appears to be cutting losses, selling 5,471 ETH at $1,465. The firm’s total unrealized losses now exceed $125 million on their 67,498 ETH position, purchased at an average of $3,259.

    Technical Outlook

    Crypto analyst Ali Martinez projects further downside, with $1,200 emerging as a potential support level. Currently trading at $1,400, Ethereum has declined over 8% in 24 hours, with market participants closely monitoring whale activity for additional selling pressure.

    FAQ Section

    Q: Why are Ethereum whales selling now?
    A: The combination of Trump’s trade tariffs, broader market uncertainty, and technical weakness has prompted large holders to reduce exposure.

    Q: What’s the significance of the $1,200 support level?
    A: This price point represents a key technical and psychological support that could determine Ethereum’s medium-term trajectory.

    Q: How does this impact retail investors?
    A: Increased whale selling typically precedes further price declines, suggesting caution may be warranted for short-term positions.

  • Ethereum Price Hits Critical Support at $1,500: Mega Whales Hold Final Line

    Ethereum Price Hits Critical Support at $1,500: Mega Whales Hold Final Line

    Ethereum’s price has plunged to a critical support level at $1,500, with on-chain data revealing that mega whale positions now represent the last line of defense. According to recent analysis, this dramatic 16% daily decline has pushed most investor cohorts underwater, leaving only the largest ETH holders in profit.

    Breaking Down Ethereum’s Support Levels

    CryptoQuant analyst MAC_D’s latest research shows that Ethereum has broken below several major investor cost basis levels, with the network-wide Realized Price of $2,250 now firmly breached. This technical breakdown suggests increased selling pressure could drive prices toward the mega whale support zone at $1,290.

    In a broader market context that has seen widespread losses totaling $1 trillion amid escalating trade tensions, Ethereum’s price action reflects heightened market vulnerability.

    SPONSORED

    Trade ETH with up to 100x leverage and maximize your profit potential

    Trade Now on Defx

    Key On-Chain Metrics Show Critical Thresholds

    The data reveals three distinct investor cohorts have been pushed underwater:

    • 100-1,000 ETH holders
    • 1,000-10,000 ETH holders
    • 10,000-100,000 ETH holders

    Only mega whales holding over 100,000 ETH remain in profit, with an average acquisition price of $1,290. This level could prove crucial for Ethereum’s next directional move, similar to its role during the 2022 bear market bottom.

    Expert Analysis and Market Outlook

    Historical data suggests the mega whale support level has previously acted as a strong bounce zone. However, with Ethereum’s recent struggle below key support levels, the market appears increasingly fragile.

    FAQ

    Q: What is the current Ethereum Realized Price?
    A: The network-wide Realized Price currently sits at $2,250, though this level has been breached.

    Q: Where is the next major support level?
    A: The mega whale cost basis at $1,290 represents the next significant support level.

    Q: What percentage of ETH holders are currently in profit?
    A: Only holders with over 100,000 ETH (mega whales) remain in profit, representing a small percentage of total holders.

  • Ethereum MVRV Ratio Hits 15-Month Low: Bottom Signal Emerges

    Ethereum MVRV Ratio Hits 15-Month Low: Bottom Signal Emerges

    The Ethereum market is showing potential bottom signals as a key on-chain metric reaches levels not seen since December 2022. Data from analytics firm IntoTheBlock reveals the Market Value to Realized Value (MVRV) ratio has plunged to 0.87, suggesting significant oversold conditions that historically precede price recoveries.

    As selling pressure on major exchanges like Binance shows signs of easing, this MVRV reading gains additional significance for potential trend reversal signals.

    Understanding the MVRV Ratio Bottom Signal

    The MVRV ratio compares Ethereum’s current market value against its realized value, effectively measuring whether investors are in profit or loss. When this metric falls below 1.0, it indicates that the average holder is underwater on their position. The current reading of 0.87 reveals:

    • Average ETH holder is facing a 13% unrealized loss
    • Lowest MVRV level since the 2022 bear market bottom
    • Historical precedent for price reversals at similar levels

    Technical Analysis and Market Structure

    The recent 12% price crash to $1,550 has created several technical developments worth noting:

    Price Level Technical Significance
    $1,550 Current support level being tested
    $1,620 Key resistance to reclaim for bullish momentum
    $1,480 Next major support if current level fails

    SPONSORED

    Trade ETH with up to 100x leverage and maximize your profit potential

    Trade Now on Defx

    Why This MVRV Bottom Could Be Different

    Historical data shows that MVRV bottoms typically coincide with reduced selling pressure, as underwater holders become less likely to exit positions at a loss. Key factors supporting a potential reversal include:

    • Diminishing profit-taking selling pressure
    • Reduced leverage in the system
    • Growing institutional interest in ETH staking

    Frequently Asked Questions

    What does an MVRV ratio below 1 mean?

    An MVRV ratio below 1 indicates that the current market value is below the realized value, meaning the average investor is holding at a loss.

    How reliable is the MVRV ratio as a bottom indicator?

    Historically, extreme low MVRV readings have coincided with market bottoms, though timing the exact bottom remains challenging.

    What could prevent an ETH price recovery?

    Broader market conditions, regulatory developments, or technical vulnerabilities could delay or prevent a price recovery despite favorable MVRV readings.

    Looking Ahead: Key Levels to Watch

    While the MVRV ratio suggests a potential bottom formation, traders should monitor these critical levels:

    • $1,550: Immediate support level
    • $1,620: First major resistance
    • MVRV ratio: Watch for movement above 1.0

    The coming weeks will be crucial in determining whether this historical bottom signal translates into a sustained price recovery for Ethereum.

  • Ethereum Price Crashes to $1,400: Fed Pivot Could End Capitulation

    Ethereum Price Crashes to $1,400: Fed Pivot Could End Capitulation

    Ethereum (ETH) has plunged to critical support levels around $1,400, marking a devastating 65% decline from 2024 highs as capitulation grips the market. The second-largest cryptocurrency by market cap is experiencing one of its steepest selloffs in recent memory, with analysts divided on whether the bottom is finally in sight.

    The dramatic price action comes amid broader market turmoil, with Bitcoin also crashing below $75,000 as Trump’s tariff announcements spark panic selling across risk assets. For Ethereum specifically, the breakdown below the crucial $1,800 support level has triggered cascading liquidations and erased months of gains.

    Market Expert Sees Light at End of Tunnel

    Despite the bearish price action, prominent analyst Ted Pillows suggests the intense selling pressure could mark a bottoming process. “We’re seeing classic capitulation behavior in ETH right now,” Pillows noted. “While we may see one final 5-10% flush lower, the risk-reward for long-term investors is becoming increasingly attractive.”

    SPONSORED

    Trade Ethereum with up to 100x leverage on perpetual contracts

    Trade Now on Defx

    Federal Reserve Pivot Could Spark Recovery

    The potential catalyst for an Ethereum recovery could come from an unexpected source – the Federal Reserve. With traditional markets showing severe stress and the S&P 500 down over 10% in just two days, calls for emergency policy action are growing louder.

    Historically, Fed pivots toward easier monetary policy have provided strong tailwinds for crypto assets. The last major policy shift in 2020 helped drive ETH from under $100 to over $4,800 during the following bull cycle.

    Technical Outlook Remains Precarious

    From a technical perspective, Ethereum faces significant challenges ahead. The loss of the $1,800 support level has opened the door for a potential retest of early 2022 lows. Key levels to watch include:

    • Immediate support: $1,400
    • Secondary support: $1,250
    • Bull reversal level: $1,800

    FAQ: Ethereum Market Outlook

    Q: When could Ethereum price recover?
    A: A recovery likely depends on broader market conditions and potential Fed policy shifts. A reclaim of $1,800 would signal improving momentum.

    Q: What’s causing the current selloff?
    A: Multiple factors including Trump trade policies, macro uncertainty, and technical breakdown below key support levels have triggered widespread selling.

    Q: Is this a good time to buy ETH?
    A: While prices are significantly discounted, continued volatility is likely. Dollar-cost averaging rather than lump-sum investing may be prudent.

    Featured image from Shutterstock, chart from TradingView

  • Ethereum Supply Crisis Looms: Exchange Reserves Hit 2-Year Low

    Ethereum Supply Crisis Looms: Exchange Reserves Hit 2-Year Low

    Ethereum’s exchange supply has reached a critical inflection point, with reserves plummeting to levels not seen since 2022. This dramatic shift comes as Trump’s aggressive trade policies continue rattling global markets, pushing ETH down 55% from December highs amid broader market uncertainty.

    Exchange Supply Drain Signals Potential Squeeze

    According to CryptoQuant data, Ethereum’s exchange reserves are experiencing a sustained decline, suggesting a significant reduction in sell-side pressure. This trend typically precedes major price movements, as reduced available supply can amplify upward momentum once buying pressure returns.

    SPONSORED

    Trade Ethereum with up to 100x leverage on perpetual contracts

    Trade Now on Defx

    Technical Analysis: Critical Support Levels

    ETH currently trades below $1,800, a crucial support zone that bulls must defend to prevent further downside. The weekly chart shows concerning breaks below both the 200-day MA ($2,500) and EMA ($2,250), suggesting continued bearish pressure.

    Key Factors to Watch

    • Exchange Supply: Continued decline could accelerate supply squeeze
    • Support Level: $1,750-$1,800 range critical for preventing deeper correction
    • Recovery Targets: Reclaiming $2,000 could signal trend reversal

    FAQ

    What does decreasing exchange supply mean for ETH price?

    Reduced exchange supply typically indicates less selling pressure and can lead to price appreciation when demand increases.

    How low could ETH go if $1,800 breaks?

    A break below $1,800 could trigger a cascade to the next major support at $1,500.

    When might we see a trend reversal?

    Technical indicators suggest a potential reversal once ETH reclaims and holds above $2,000.

    While current market conditions remain challenging, particularly amid growing recession concerns, the structural reduction in ETH supply could set the stage for a significant recovery once market sentiment improves.

  • Ethereum’s Pectra Upgrade Sparks Hope Despite 2025 Price Struggles

    Ethereum’s Pectra Upgrade Sparks Hope Despite 2025 Price Struggles

    Ethereum (ETH) has been facing significant challenges in 2025, with its performance lagging behind Bitcoin and the broader cryptocurrency market. However, the upcoming Pectra upgrade could mark a turning point for the leading smart contract platform, according to industry experts. Recent price analysis suggests ETH faces potential downside risks, making the Pectra upgrade’s success crucial for market sentiment.

    Understanding Ethereum’s Current Market Position

    The divergence in performance between Ethereum and other major cryptocurrencies has created growing concern among investors and stakeholders. While Bitcoin has shown remarkable strength in recent months, Ethereum’s focus on foundational development rather than market-driven narratives has contributed to its underperformance.

    SPONSORED

    Trade ETH with up to 100x leverage and maximize your potential returns

    Trade Now on Defx

    The Pectra Upgrade: Technical Improvements and Market Impact

    The Pectra upgrade represents a significant step forward in Ethereum’s technical evolution, focusing on:

    • Enhanced transaction throughput
    • Improved scalability solutions
    • Reduced gas fees
    • Better network efficiency

    Expert Analysis and Market Outlook

    Market analysts remain cautiously optimistic about Ethereum’s future prospects. Recent data shows significant whale accumulation, suggesting strong institutional confidence in ETH’s long-term potential despite current market challenges.

    Frequently Asked Questions

    What is the Pectra upgrade?

    The Pectra upgrade is Ethereum’s latest network enhancement focused on improving scalability and reducing transaction costs.

    When will the Pectra upgrade be implemented?

    The upgrade is scheduled for implementation in late 2025, with specific dates to be announced.

    How will this affect ETH prices?

    While immediate price impact remains uncertain, successful implementation could boost investor confidence and network utility.

    Looking Ahead: Ethereum’s Path Forward

    As Ethereum continues to prioritize fundamental development over short-term price action, the Pectra upgrade represents a critical milestone in the network’s evolution. Success could reignite market interest and potentially lead to price recovery in the latter part of 2025.

  • Ethereum Whales Accumulate 130K ETH as Price Tests $1,800 Support

    Ethereum Whales Accumulate 130K ETH as Price Tests $1,800 Support

    In a significant display of confidence amid market uncertainty, Ethereum whales have added over 130,000 ETH to their holdings in just 24 hours, even as the cryptocurrency continues to face selling pressure below $1,900. This accumulation comes at a critical time when Trump’s recent tariff announcements have sent shockwaves through global markets, affecting both traditional and crypto assets.

    Whale Accumulation Signals Long-term Confidence

    According to data from IntoTheBlock, major Ethereum holders are actively buying the dip, with the largest wallets accumulating over 130,000 ETH in a single day. This substantial accumulation, valued at approximately $238 million at current prices, suggests that institutional investors and wealthy individuals maintain a bullish long-term outlook despite the current market downturn.

    SPONSORED

    Trade Ethereum with up to 100x leverage on perpetual contracts

    Trade Now on Defx

    Technical Analysis and Price Outlook

    Ethereum is currently trading at $1,830, having declined 55% from its December peak. The cryptocurrency faces crucial support at $1,800, with the next major support level at $1,750. A break below these levels could trigger further selling pressure, while reclaiming $2,100 would be necessary for any meaningful recovery.

    Market Impact and Future Prospects

    The current accumulation phase occurs against a backdrop of broader market uncertainty, with macroeconomic factors playing a significant role. While retail sentiment remains bearish, the substantial whale buying activity could signal a potential trend reversal once market conditions stabilize.

    Frequently Asked Questions

    • What does whale accumulation indicate?
      Whale accumulation often signals strong long-term confidence in an asset, as large holders typically make strategic investments based on fundamental analysis.
    • Why is the $1,800 level significant?
      This price point represents a critical support level that has historically acted as a strong bounce zone for Ethereum.
    • Could this accumulation lead to a price reversal?
      While whale buying doesn’t guarantee immediate price recovery, it often precedes significant market movements due to reduced selling pressure and supply dynamics.
  • Ethereum Network Activity Hits 2020 Lows as Price Drops Below $1,800

    Ethereum (ETH) has entered what analysts are calling a potential ‘hyperinflation hellscape’ as the leading smart contract platform faces mounting pressure from declining network activity and weakening fundamentals. The asset is currently trading below $1,800, marking a 4% decline in the past 24 hours amid broader market uncertainty.

    As institutional interest continues to favor Bitcoin over Ethereum ETFs, the second-largest cryptocurrency by market cap is experiencing concerning on-chain metrics that could signal deeper structural issues.

    Network Activity Plummets to Multi-Year Lows

    According to a detailed analysis by CryptoQuant analyst EgyHash, Ethereum’s network is showing alarming signs of reduced engagement:

    • Daily active addresses have fallen to levels not seen since 2020
    • Transaction fees have hit record lows
    • The network’s burn rate has decreased significantly
    • Token issuance is outpacing burning mechanisms

    Dencun Upgrade Impact Falls Short

    The recent Dencun upgrade, which aimed to enhance network efficiency, has coincided with an extended period of low transaction volumes. This timing has created a perfect storm of reduced fee income and increased net ETH issuance, potentially contributing to inflationary pressures.

    SPONSORED

    Trade Ethereum with up to 100x leverage on perpetual contracts

    Trade Now on Defx

    Technical Analysis Shows Potential Support

    Despite the bearish on-chain metrics, technical analysts remain cautiously optimistic. Key support levels and historical trendlines suggest potential for a recovery, though this would likely require a significant improvement in network fundamentals and broader market conditions.

    FAQ Section

    Why is Ethereum’s network activity declining?

    The decline can be attributed to multiple factors including reduced DeFi activity, migration to layer-2 solutions, and overall market sentiment shifting toward Bitcoin.

    What impact does low network activity have on ETH price?

    Reduced network activity leads to lower fee generation and burning, potentially creating inflationary pressure on ETH’s supply dynamics.

    Could Ethereum recover from current levels?

    Technical analysts suggest recovery is possible, but would require improved network metrics and broader market support.

  • Ethereum Price Set for Major Rally Against XRP, Analysts Project $4,800 Target

    Ethereum Price Set for Major Rally Against XRP, Analysts Project $4,800 Target

    Ethereum (ETH) appears poised for a significant price surge against XRP, with multiple analysts projecting strong upside potential for the second-largest cryptocurrency. Recent analysis warning of an ETH drop to $1,400 may need revision as new technical indicators emerge showing bullish momentum.

    Key Technical Analysis Points to ETH Dominance

    CredibullCrypto, a respected market analyst, has identified several compelling reasons why Ethereum is likely to outperform XRP in the coming months:

    • The XRP/ETH trading pair shows clear bearish divergence after a 250% rally
    • Strong support established in ETH’s high-timeframe demand zone
    • Technical indicators suggest XRP may retrace to $1.60-$1.80 range
    • ETH positioned for potential breakout above key resistance levels

    SPONSORED

    Trade Ethereum with up to 100x leverage on perpetual contracts

    Trade Now on Defx

    Price Targets and Support Levels

    Multiple analysts have weighed in with specific price predictions for Ethereum:

    • Immediate resistance zone: $3,600-$4,000
    • Potential breakout target: $4,400-$4,800
    • Critical support levels: $1,800 and $1,200
    • XRP/ETH pair expected to find support at 0.00087-0.00088

    Market Implications and Trading Opportunities

    The current market structure presents several key opportunities for traders:

    1. Potential accumulation zone between $1,800-$2,000
    2. Clear resistance levels for setting take-profit targets
    3. Multiple entry points during expected XRP correction
    4. Long-term upside potential remains intact

    Frequently Asked Questions

    Why is Ethereum expected to outperform XRP?

    Technical indicators show XRP is due for a correction after its recent rally, while Ethereum maintains strong support levels and shows signs of accumulation.

    What are the key price levels to watch?

    Traders should monitor the $1,800 support level and $3,600-$4,000 resistance zone for potential breakout opportunities.

    When could the predicted rally begin?

    Analysts suggest the movement could initiate once XRP completes its correction to the $1.60-$1.80 range, potentially within the next few weeks.