Tag: Eth/usd

  • Ethereum Price Faces Critical $1,600 Resistance: Bears Eye $1,420 Target

    Ethereum Price Faces Critical $1,600 Resistance: Bears Eye $1,420 Target

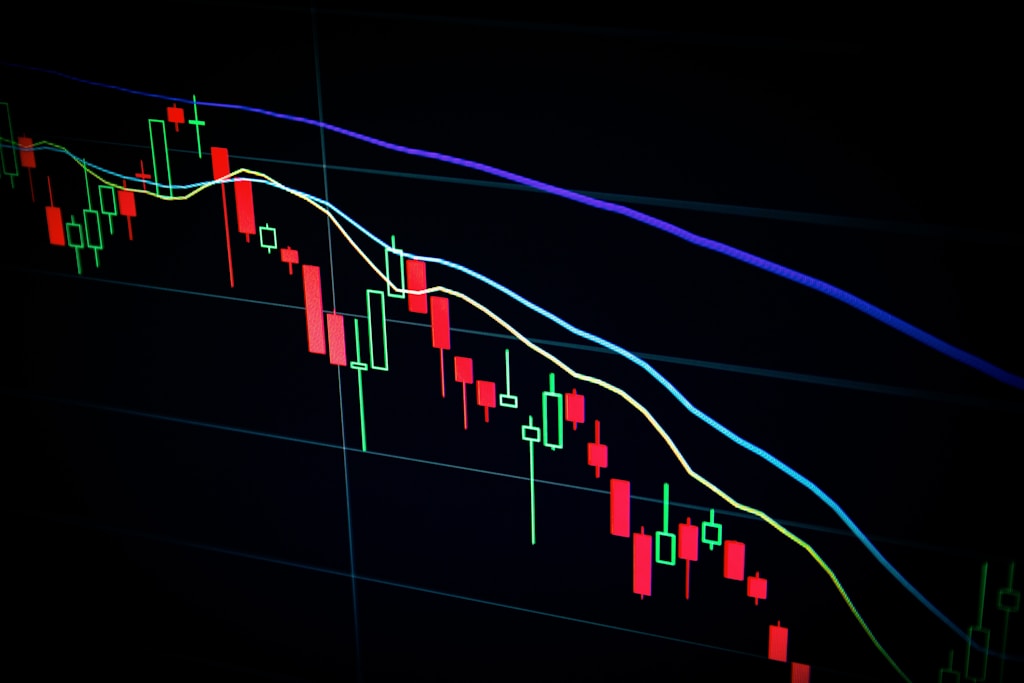
    Ethereum (ETH) is showing significant bearish pressure as the second-largest cryptocurrency struggles to maintain momentum above key support levels. Recent market uncertainty has pushed ETH into a precarious position, with technical indicators suggesting further downside potential.

    Key Technical Levels for Ethereum

    The cryptocurrency has established several critical price levels that traders should monitor:

    • Current resistance: $1,600 with bearish trend line formation
    • Major support: $1,535
    • Secondary support: $1,500
    • Critical breakdown level: $1,420

    Technical Analysis Breakdown

    Ethereum’s price action shows concerning signals for bulls:

    • Trading below the 100-hourly Simple Moving Average
    • 23.6% Fibonacci retracement level breach from $1,690 high to $1,538 low
    • RSI holding above 50 but showing weakness
    • MACD losing momentum in bearish territory

    SPONSORED

    Trade Ethereum with up to 100x leverage on perpetual contracts

    Trade Now on Defx

    Potential Scenarios

    Two primary scenarios are emerging for ETH:

    Bullish Case

    • Break above $1,650 resistance could trigger rally to $1,690
    • Further upside potential to $1,750 and $1,800
    • Key to watch: $1,615 level (50% Fibonacci retracement)

    Bearish Case

    • Failure to clear $1,600 could trigger fresh decline
    • Initial support at $1,560 likely to be tested
    • Risk of drop to $1,420 if $1,535 breaks

    Expert Analysis

    Technical indicators suggest increasing bearish pressure, with the MACD showing concerning signals in the bearish zone. The formation of a new bearish trend line at $1,600 could act as a significant barrier for any potential recovery attempts.

    Frequently Asked Questions

    What is the key resistance level for Ethereum right now?

    The critical resistance level is at $1,600, with additional resistance at $1,650 and $1,690.

    Where is the strongest support for ETH?

    The strongest support lies at $1,535, followed by psychological support at $1,500.

    What technical indicators should traders watch?

    Key indicators include the 100-hourly SMA, MACD momentum, and RSI levels above 50.

    Traders should maintain strict risk management given the current market conditions and watch for clear breakout signals before taking positions.

  • Ethereum Price Targets $2,000: Multiple Analysts Predict Imminent Breakout

    Ethereum (ETH) appears poised for a significant price breakout according to multiple crypto analysts, despite being down nearly 50% over the past year. Technical indicators and market sentiment suggest ETH could soon test the critical $2,000 level, marking a potential trend reversal for the second-largest cryptocurrency.

    This analysis comes as Ethereum faces challenges in policy advocacy compared to Bitcoin and Solana, highlighting the need for positive price action to maintain market confidence.

    Technical Analysis Points to Bullish Ethereum Setup

    Unlike Bitcoin’s recent performance amid ETF approvals, Ethereum has struggled to capture similar institutional interest. However, several key technical indicators now suggest a potential trend reversal:

    • Formation of an ascending triangle pattern on the weekly timeframe
    • Breakout from a downward-sloping trendline on shorter timeframes
    • Key support holding at the $1,550-$1,600 range

    SPONSORED

    Trade Ethereum with up to 100x leverage on perpetual contracts

    Trade Now on Defx

    Price Targets and Resistance Levels

    Analysts have identified several key price levels for Ethereum:

    Level Significance
    $1,670 Immediate breakout target
    $2,000 Major psychological resistance
    $2,300 Strong historical resistance
    $3,600 Long-term target (ascending triangle)

    Potential Headwinds and Risk Factors

    Despite the bullish technical setup, several factors could impact Ethereum’s price trajectory:

    • Over 368,000 ETH moved to exchanges this month, suggesting potential selling pressure
    • ETH/BTC ratio at 2020 lows, indicating relative weakness
    • Final major support at 0.016 on the ETH/BTC pair

    Frequently Asked Questions

    What is causing Ethereum’s current price movement?

    Technical factors, market sentiment, and institutional flows are the primary drivers of ETH’s current price action.

    What are the key levels to watch for Ethereum?

    The immediate focus is on the $1,670 breakout level, followed by psychological resistance at $2,000.

    How does Ethereum’s performance compare to Bitcoin?

    ETH has underperformed BTC significantly in 2024, trading at multi-year lows on the ETH/BTC ratio.

    Time to read: 4 minutes

  • Ethereum Price Dips Below $1,620: Key Support Levels to Watch

    Ethereum Price Dips Below $1,620: Key Support Levels to Watch

    Ethereum (ETH) continues its downward trajectory, breaking below critical support levels as bears maintain control of the market. Recent analysis had identified the $1,546 support level as crucial, and the current price action suggests further downside potential may be ahead.

    Key Technical Levels and Market Analysis

    The second-largest cryptocurrency by market cap is showing significant bearish momentum after failing to breach the $1,700 resistance level. Here are the critical levels traders should monitor:

    • Current resistance: $1,640
    • Major support: $1,580
    • 100-hourly SMA: Below $1,620
    • Key breakout level: $1,690

    Technical Indicators Signal Bearish Momentum

    Multiple technical indicators are aligning to suggest continued bearish pressure:

    • MACD showing increasing bearish momentum
    • RSI trading below 50, indicating bearish control
    • Break below bullish trendline at $1,625
    • 50% Fibonacci retracement test from $1,472 to $1,690

    SPONSORED

    Trade Ethereum with up to 100x leverage and maximize your profit potential

    Trade Now on Defx

    Potential Price Scenarios

    Two primary scenarios are emerging for ETH’s short-term price action:

    Bullish Case

    • Break above $1,640 resistance
    • Target levels: $1,690, $1,750, and $1,800
    • Required: Strong buying volume and market sentiment shift

    Bearish Case

    • Failure to clear $1,640
    • Support levels: $1,580, $1,555, and $1,525
    • Worst case scenario: Drop to $1,450

    Expert Analysis and Trading Strategy

    Given the current market conditions, traders should consider the following strategies:

    • Set stop losses below $1,555
    • Watch for reversal signals at $1,580
    • Consider scaling into positions near support levels
    • Monitor Bitcoin correlation for additional confirmation

    Frequently Asked Questions

    What’s causing Ethereum’s current price decline?

    The decline appears to be technical in nature, following rejection at the $1,700 resistance level and broader market uncertainty.

    When might ETH price recover?

    A recovery could begin once ETH establishes support above $1,640 with sustained buying volume.

    What’s the worst-case scenario for ETH price?

    Technical analysis suggests potential support at $1,450 if current levels fail to hold.

    Technical Indicators Summary:

    • MACD: Bearish momentum increasing
    • RSI: Below 50, indicating bearish control
    • Major Support: $1,580
    • Major Resistance: $1,640
  • Ethereum Price Eyes $1,800 Target as Bulls Defend $1,620 Support

    Ethereum (ETH) is showing strong bullish momentum as the second-largest cryptocurrency consolidates above crucial support levels, setting up for a potential move toward $1,800. Recent price action suggests accumulation at key technical zones, with multiple indicators pointing to sustained upward pressure.

    Key Technical Levels Signal Bullish Structure

    The latest market analysis reveals Ethereum has established a solid foundation above $1,620, with several technical factors supporting the bullish case:

    • Price maintaining position above the 100-hourly Simple Moving Average
    • Formation of a new bullish trend line with support at $1,625
    • Successful defense of the 50% Fibonacci retracement level
    • RSI readings remaining above 50, indicating sustained buying pressure

    This technical setup mirrors patterns seen in recent analysis suggesting an $1,800 breakout potential, as key supply zones continue to align favorably.

    Critical Resistance Levels to Watch

    For Ethereum to achieve its bullish potential, several key resistance levels must be cleared:

    • Immediate resistance: $1,660
    • Major hurdle: $1,680-$1,690 zone
    • Key target: $1,750
    • Ultimate objective: $1,800-$1,880 range

    SPONSORED

    Trade Ethereum with up to 100x leverage and maximize your profit potential

    Trade Now on Defx

    Support Zones and Downside Risks

    While the overall structure remains bullish, traders should monitor these key support levels:

    • Primary support: $1,620
    • Critical zone: $1,610 (coinciding with 61.8% Fibonacci level)
    • Secondary support: $1,575
    • Last line of defense: $1,550-$1,500 range

    Technical Indicators and Market Sentiment

    Current technical readings provide mixed but generally positive signals:

    • MACD: Showing decreased momentum but maintaining bullish zone presence
    • RSI: Holding above 50, suggesting continued buying pressure
    • Moving Averages: Price maintaining position above key EMAs

    FAQ Section

    What is the next major target for Ethereum price?

    The immediate target is $1,690, with potential for extension to $1,800 if momentum maintains.

    What are the key support levels to watch?

    Critical support lies at $1,620, with secondary support at $1,610 and $1,575.

    Is Ethereum likely to break above $1,700?

    Technical indicators suggest a break above $1,700 is possible if current support levels hold and market momentum continues.

  • Ethereum Price Faces Critical $1,580 Test: Bulls Fight to Maintain Momentum

    Ethereum (ETH) is approaching a decisive moment as the second-largest cryptocurrency battles to maintain its bullish momentum above crucial support levels. After reaching a local high of $1,687, ETH has entered a corrective phase that could determine its short-term trajectory.

    In a notable development that coincides with the current price action, recent data shows long-term ETH holders have been capitulating, potentially creating a historic buy signal for investors watching current price levels.

    Key Price Levels and Technical Analysis

    The current price action shows several critical technical developments:

    • Support established at $1,500, coinciding with the 61.8% Fibonacci retracement level
    • Resistance cluster forming around $1,580, including the 100-hour SMA
    • Bearish trend line emerging at $1,550, creating a significant technical barrier

    Bullish Scenario: Path to $1,800

    For bulls to regain control, several key levels must be conquered:

    Resistance Level Significance
    $1,580 Immediate resistance + 100-hour SMA
    $1,620 First major resistance zone
    $1,680 Recent local high
    $1,750 Next major target

    Bearish Scenario: Support Levels to Watch

    If selling pressure intensifies, these support levels become crucial:

    • $1,520: Initial support zone
    • $1,500: Major psychological support
    • $1,455: Secondary support level
    • $1,420: Critical support zone

    SPONSORED

    Trade Ethereum with up to 100x leverage and maximize your profit potential

    Trade Now on Defx

    Technical Indicators Signal Mixed Sentiment

    Current technical indicators present a mixed outlook:

    • MACD: Losing momentum in the bullish zone, suggesting potential weakness
    • RSI: Trading below 50, indicating bearish short-term sentiment
    • Moving Averages: Price below 100-hour SMA, suggesting immediate bearish pressure

    Frequently Asked Questions

    What is causing Ethereum’s current price correction?

    The correction appears to be technical in nature, following a strong rally above $1,600. Market participants are taking profits while new buyers assess entry points.

    Could Ethereum break above $1,800 in the near term?

    While possible, ETH needs to first clear the immediate resistance at $1,580 and maintain momentum above $1,680 to target the $1,800 level.

    What’s the most important support level to watch?

    The $1,500 level is crucial as it represents both a psychological support and coincides with the 61.8% Fibonacci retracement level.

    Traders should maintain strict risk management practices given the current market volatility. The next 24-48 hours could prove decisive for Ethereum’s short-term price direction.

  • Ethereum Price Struggles at $1,620: Key Support Levels Under Threat

    Ethereum Price Struggles at $1,620: Key Support Levels Under Threat

    Ethereum (ETH) continues to face significant bearish pressure as the second-largest cryptocurrency struggles to maintain crucial support levels. Recent market analysis showed a 14% crash to $1,540, and the current price action suggests more volatility ahead.

    Technical Analysis Shows Bearish Pattern Formation

    The latest price action reveals several concerning technical indicators:

    • Price failed to hold above the critical $1,700 support zone
    • Trading activity remains below the 100-hourly Simple Moving Average
    • Formation of a bearish trend line with resistance at $1,615
    • 23.6% Fibonacci retracement level showing weak recovery attempts

    Critical Support and Resistance Levels

    Traders should monitor these key price levels:

    Type Level Significance
    Major Resistance $1,720 Previous support turned resistance
    Immediate Resistance $1,620 Current bearish trend line
    Key Support $1,540 Recent bounce level
    Critical Support $1,505 Must hold to prevent further decline

    SPONSORED

    Trade ETH with up to 100x leverage on perpetual contracts

    Trade Now on Defx

    Market Sentiment and Technical Indicators

    Current technical indicators paint a mixed picture:

    • MACD: Losing bullish momentum
    • RSI: Hovering above 50, showing neutral sentiment
    • Volume: Declining, indicating potential consolidation

    Potential Scenarios and Price Targets

    Two primary scenarios are emerging:

    Bullish Case

    • Break above $1,720 could target $1,820
    • Further upside potential to $1,880 and $1,920
    • Requires significant volume increase

    Bearish Case

    • Failure at $1,620 risks drop to $1,505
    • Break below could see $1,420 tested
    • Worst case scenario targets $1,380

    FAQ

    Q: What’s causing Ethereum’s current price weakness?
    A: Multiple factors including broader market uncertainty, technical resistance, and declining trading volume.

    Q: Where is the next major support level?
    A: The critical support zone lies at $1,505, with secondary support at $1,420.

    Q: What needs to happen for ETH to recover?
    A: A clear break above $1,720 with strong volume would signal potential recovery.

    Conclusion

    Ethereum faces a critical juncture at current levels. Traders should watch the $1,620 resistance and $1,505 support levels closely while monitoring volume and technical indicators for potential trend reversals.

  • Ethereum Price Eyes $1,920 Breakout: Key Resistance Test Ahead

    Ethereum (ETH) is showing signs of strength as it approaches a critical resistance level at $1,920, with technical indicators suggesting a potential breakout could be imminent. As highlighted in our recent analysis on the ETH/BTC ratio hitting a 4-year low, Ethereum’s price action remains a focal point for traders.

    Ethereum’s Recovery Path: Technical Analysis

    The second-largest cryptocurrency by market cap has established a solid foundation above the $1,850 support level, demonstrating resilience in the face of recent market volatility. Key technical developments include:

    • Formation of a bullish trend line with support at $1,860
    • Price trading comfortably above the 100-hourly Simple Moving Average
    • Successful breach of multiple resistance levels ($1,820, $1,850, $1,880)
    • 50% Fibonacci retracement level cleared from $2,032 high to $1,767 low

    Critical Price Levels to Watch

    For traders and investors monitoring Ethereum’s price action, several key levels demand attention:

    Support Levels Resistance Levels
    $1,860 $1,920
    $1,845 $1,970
    $1,800 $2,020

    SPONSORED

    Trade ETH with up to 100x leverage on perpetual contracts

    Trade Now on Defx

    Bullish Scenario and Potential Targets

    A successful breakthrough above $1,920 could trigger a significant rally, with potential targets at:

    • Initial target: $1,970
    • Secondary target: $2,020
    • Extended target: $2,050-$2,120 range

    Risk Factors and Bearish Scenario

    Traders should remain cautious of potential downside risks:

    • Failure to breach $1,920 could trigger a reversal
    • Initial support at $1,860 must hold to maintain bullish momentum
    • Break below $1,845 could lead to further decline towards $1,800

    Technical Indicators Overview

    • MACD: Showing decreasing bullish momentum
    • RSI: Maintains position above 50, indicating moderate strength
    • Moving Averages: Price above 100-hourly SMA suggests short-term bullish bias

    Frequently Asked Questions

    What is the key resistance level for Ethereum right now?

    The critical resistance level is at $1,920, which coincides with the 61.8% Fibonacci retracement level.

    What could trigger an Ethereum breakout?

    A clear break above $1,920 with increased trading volume could trigger a rally toward $2,020 and beyond.

    What’s the main support level to watch?

    The primary support level is at $1,860, reinforced by the current bullish trend line.

  • Ethereum Price Tests $1,850 Resistance: Key Levels for April Recovery

    Ethereum Price Tests $1,850 Resistance: Key Levels for April Recovery

    Ethereum Price Tests $1,850 Resistance: Key Levels for April Recovery

    Ethereum (ETH) is facing a critical test at the $1,850 resistance level after experiencing a notable decline from recent highs. As technical indicators signal potential price reversals, traders are closely monitoring key support and resistance levels that could determine ETH’s trajectory in early April 2025.

    Current Market Position

    After failing to maintain momentum above $2,050, Ethereum has entered a consolidation phase with several technical developments:

    • Price trading below the 100-hourly Simple Moving Average
    • Break above bearish trend line at $1,810
    • Critical resistance zone between $1,850-$1,880
    • 23.6% Fibonacci retracement level tested

    SPONSORED

    Trade Ethereum with up to 100x leverage on perpetual contracts

    Trade Now on Defx

    Key Resistance Levels

    For Ethereum to initiate a recovery rally, several crucial resistance levels must be overcome:

    Level Significance
    $1,850 Immediate resistance
    $1,900 Major psychological level
    $2,000 Key breakthrough point

    Support Structure

    In case of continued bearish pressure, these support levels are crucial:

    • $1,800 – Initial support
    • $1,780 – Secondary support zone
    • $1,765 – Critical support level
    • $1,710 – Major support area

    Technical Analysis

    Current technical indicators present a mixed outlook:

    • MACD: Showing bearish momentum
    • RSI: Above 50, indicating neutral to slightly bullish conditions
    • Moving Averages: Price below 100-hour SMA suggests short-term weakness

    Potential Scenarios

    Bullish Case

    A breakthrough above $1,900 could trigger a rally toward:

    • $2,000 psychological resistance
    • $2,050 previous resistance zone
    • $2,120 extended target

    Bearish Case

    Failure to break $1,850 might lead to:

    • Retest of $1,780 support
    • Possible decline to $1,710
    • Risk of testing $1,665 support

    FAQ

    What’s causing Ethereum’s current price action?

    The current price movement is influenced by broader market conditions and technical factors, including the failure to maintain momentum above $2,050.

    When might Ethereum break above $2,000?

    A clear break above $1,900 with strong volume could signal a potential move toward $2,000 in the near term.

    What’s the most important support level to watch?

    The $1,800 level serves as crucial support, with a break below potentially triggering further declines.

    Conclusion

    Ethereum’s price action at the $1,850 resistance level will likely determine its short-term trajectory. Traders should monitor volume and technical indicators while maintaining appropriate risk management strategies.

  • Ethereum Price Drops Below $1,880: Key Support at $1,765 Under Threat

    Ethereum’s price trajectory has taken a bearish turn, with ETH dropping below the critical $1,880 level amid increasing market pressure. This technical analysis explores the key support and resistance levels that traders should monitor as Ethereum faces potential further downside.

    Key Takeaways:

    • ETH price failed to maintain momentum above $2,000 resistance
    • Critical support established at $1,765 with bearish trend line forming
    • Technical indicators suggest continued bearish momentum

    In a move that mirrors Bitcoin’s recent price decline below $84,000, Ethereum has entered a concerning downward trajectory. The second-largest cryptocurrency by market cap is showing signs of weakness after failing to breach the psychological $2,000 barrier.

    Technical Analysis: Breaking Down the Bearish Pattern

    The current price action reveals several critical technical factors:

    • Price trading below both $1,880 and the 100-hourly SMA
    • Formation of a bearish trend line with resistance at $1,820
    • 23.6% Fibonacci retracement level acting as immediate resistance

    SPONSORED

    Trade Ethereum with up to 100x leverage and maximize your profit potential

    Trade Now on Defx

    Key Resistance Levels to Watch

    Traders should monitor these crucial resistance points:

    • $1,820: Immediate resistance aligned with bearish trend line
    • $1,880: Major resistance zone with high selling pressure
    • $1,920: Critical breakout level for potential recovery

    Support Zones and Downside Risks

    If the bearish momentum continues, these support levels become crucial:

    • $1,765: Primary support zone currently being tested
    • $1,720: Secondary support level
    • $1,680: Major support area for potential bounce

    Technical Indicators Signal Caution

    Current technical indicators paint a cautionary picture:

    • MACD: Losing momentum in bearish territory
    • RSI: Trading below 50, indicating bearish control
    • Moving Averages: Price below key SMAs suggesting continued weakness

    FAQ Section

    What is causing Ethereum’s price decline?

    The current decline can be attributed to broader market weakness, increased selling pressure, and failure to maintain momentum above key resistance levels.

    Could Ethereum recover in the short term?

    A recovery would require clearing the $1,880 resistance and establishing support above $2,000. Current technical indicators suggest this may be challenging in the immediate term.

    What’s the worst-case scenario for ETH price?

    If support at $1,765 fails, ETH could test lower support levels at $1,680 or potentially $1,650 in a severe bearish scenario.

    Conclusion and Market Outlook

    Ethereum’s price action suggests continued bearish pressure in the short term. Traders should watch the $1,765 support level closely, as a breach could trigger further downside movement. However, successful defense of this level could provide a foundation for potential recovery attempts toward $1,880 and above.

  • Ethereum Price Struggles at $2,040: Key Support Levels for March 2025

    Ethereum Price Struggles at $2,040: Key Support Levels for March 2025

    Ethereum (ETH) continues to face significant resistance at the $2,040 level, with technical indicators suggesting potential bearish momentum in the short term. As previous analysis indicated potential resistance at $2,160, the second-largest cryptocurrency by market cap is showing signs of weakness below crucial technical levels.

    Current Market Position and Technical Analysis

    ETH price action reveals several critical developments:

    • Price currently consolidating below $2,020 and the 100-hourly SMA
    • Formation of a bearish trend line with resistance at $2,040
    • Critical support established at $1,980 with recent low at $1,982
    • 50% Fibonacci retracement level tested from $2,098 high to $1,982 low

    Key Resistance Levels to Watch

    Multiple resistance zones could impact ETH’s near-term trajectory:

    • Immediate resistance: $2,040
    • Secondary resistance: $2,050 (61.8% Fibonacci level)
    • Major resistance: $2,095
    • Extended targets: $2,150, $2,250, and $2,320

    SPONSORED

    Trade Ethereum with up to 100x leverage and maximize your profit potential

    Trade Now on Defx

    Support Zones and Downside Risks

    If bearish pressure continues, these support levels become crucial:

    • Primary support: $1,980
    • Secondary support: $1,880
    • Critical support: $1,820
    • Major support floor: $1,750

    Technical Indicators Signal Caution

    Current technical readings suggest increased bearish pressure:

    • MACD: Losing momentum in bearish zone
    • RSI: Trading below 50, indicating bearish sentiment
    • Moving Averages: Price below 100-hourly SMA

    Frequently Asked Questions

    What is the immediate price target for Ethereum?

    The immediate resistance target is $2,040, with potential for movement to $2,150 if this level is breached successfully.

    What are the key support levels to monitor?

    The primary support level is at $1,980, followed by $1,880 and $1,820 as secondary support zones.

    Could Ethereum break down further?

    If ETH fails to maintain support at $1,980, a decline toward $1,880 or even $1,750 becomes possible.

    Traders should maintain strict risk management practices given the current market volatility and watch for clear breakout signals above $2,040 or breakdown below $1,980 for confirmation of the next major move.