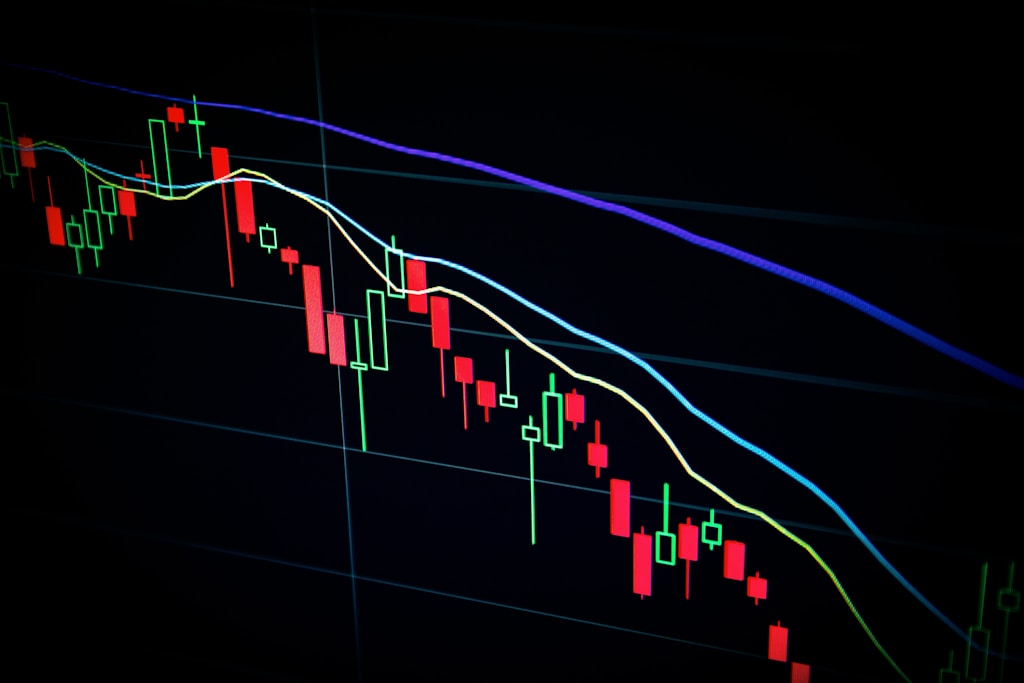
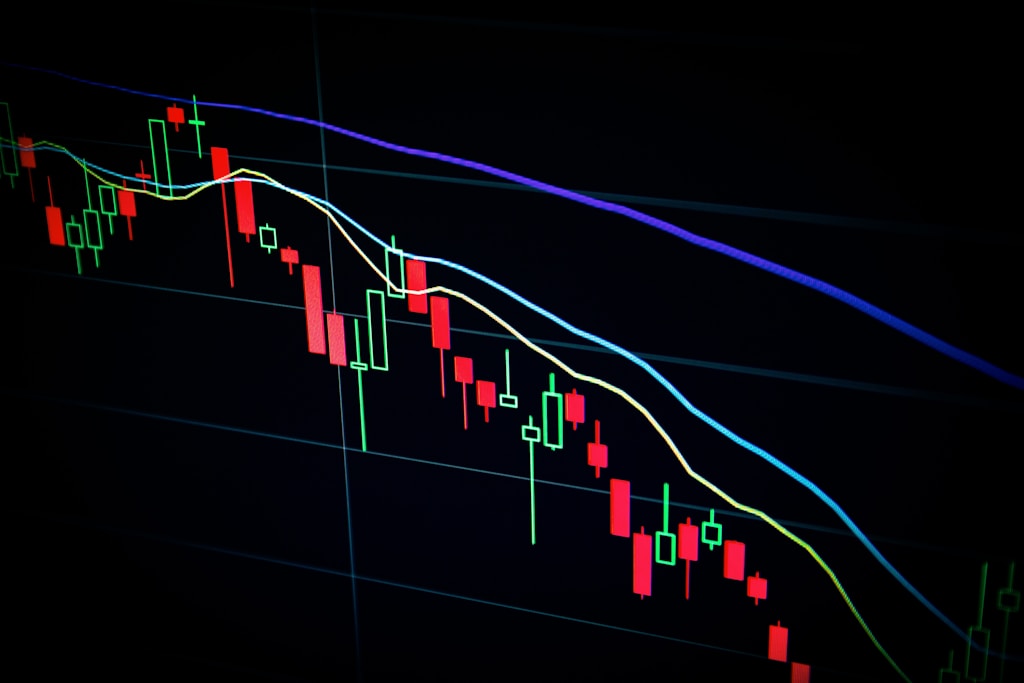
Tag: Golden Cross

  • Bitcoin Price Eyes 170% Rally After Golden Cross Pattern Forms

    Bitcoin Price Eyes 170% Rally After Golden Cross Pattern Forms

    Bitcoin continues to demonstrate remarkable resilience above the $100,000 level, with technical indicators suggesting a potential surge of up to 170% in the coming months. This analysis comes as the market tests key resistance levels near $110,000, setting up what could be a historic price movement.

    Golden Cross Formation Signals Major Upside Potential

    Crypto analyst Doctor Profit has identified a rare Golden Cross pattern on Bitcoin’s chart, historically a precursor to significant price rallies. The pattern, which emerged three weeks ago, typically initiates with a 10% correction – precisely what occurred when BTC dropped from $111,900 to $100,000. With this correction phase complete, historical data suggests the stage is set for substantial gains.

    Technical Analysis Supports Bullish Outlook

    The formation of a diagonal resistance level adds another layer to the bullish thesis. A breakthrough above this level could propel Bitcoin beyond $108,000, establishing new support levels for the next phase of growth. Recent on-chain metrics further support this potential upward movement, with accumulation patterns showing increased conviction among long-term holders.

    SPONSORED

    Maximize your trading potential with up to 100x leverage on perpetual contracts

    Trade Now on Defx

    Macro Economic Factors Align

    The upcoming CPI data release could act as a catalyst for the next move higher. While Wall Street expects a 2.5% figure, predictions of a lower 2.1-2.3% range could trigger increased risk appetite across markets. Additionally, the current negative funding rate suggests an oversold market condition, historically a precursor to strong rebounds.

    Price Targets and Market Outlook

    Initial resistance levels lie between $108,000-$110,000, but the Golden Cross pattern suggests potential gains of 70-170% in the coming months. This aligns with broader market predictions of a $200,000 Bitcoin price target, which some analysts now consider conservative.

    FAQ Section

    • What is a Golden Cross pattern?
      A Golden Cross occurs when a short-term moving average crosses above a long-term moving average, typically signaling a strong bullish trend.
    • How reliable are Golden Cross signals?
      Historically, Golden Cross patterns in Bitcoin have led to significant price appreciation 80% of the time.
    • What could prevent this rally from materializing?
      Key risks include unexpected regulatory changes, macro economic shocks, or significant institutional selling pressure.

  • Bitcoin Price Surge: Technical Analysis Points to 62% Rally Target

    Bitcoin’s recent price action has set the stage for what could be a massive 62% surge, according to detailed technical analysis that mirrors historical patterns. Following a notable dip triggered by the Trump-Musk feud that caused nearly $1B in liquidations, multiple technical indicators now suggest an imminent bullish breakout.

    Golden Cross Formation Signals Bullish Momentum

    The premier cryptocurrency, currently trading at $104,850, has formed a golden cross pattern as the 50-day simple moving average (50SMA) crosses above the 200-day simple moving average (200SMA). This technical formation, historically a reliable predictor of sustained bull runs, mirrors the setup that preceded Bitcoin’s Q4 2024 rally.

    Technical Confluence Supports Bullish Case

    Market analyst CrypFlow has identified three key technical factors supporting the bullish thesis:

    • Golden cross formation in early June 2025
    • Breakout above major downward trendline from December 2024
    • Price correction pattern matching November 2024’s pre-rally setup

    SPONSORED

    Trade Bitcoin with up to 100x leverage on perpetual contracts

    Trade Now on Defx

    Price Targets and Market Sentiment

    While CrypFlow’s analysis suggests a potential 62% surge to $170,000, the initial conservative target sits at $130,000. This aligns with broader market predictions of a major breakout toward $150,000.

    FAQ Section

    What is triggering Bitcoin’s potential price surge?

    The combination of a golden cross formation, trendline breakout, and historical pattern repetition suggests strong bullish momentum.

    What are the key resistance levels to watch?

    The immediate resistance lies at $111,970 (recent ATH), followed by psychological levels at $130,000 and $150,000.

    How reliable is the golden cross indicator?

    While not guaranteed, the golden cross has historically preceded significant Bitcoin rallies, including the Q4 2024 surge.

    Current market sentiment remains cautiously optimistic, with the Fear & Greed Index at 45 despite recent volatility. Coincodex projections support the bullish outlook, forecasting $134,074 within five days and $155,864 in three months.

  • Bitcoin Golden Cross Pattern Signals $150K Target After $100K Test

    Bitcoin (BTC) has formed a significant Golden Cross pattern that historically precedes major rallies, suggesting the recent pullback to $100,000 could be setting up for an explosive move to $150,000. Recent market turbulence triggered by the Trump-Musk dispute may actually be creating the perfect setup for Bitcoin’s next leg up.

    Understanding the Golden Cross Formation

    Technical analysis from prominent crypto analyst Chain Mind reveals that Bitcoin’s latest Golden Cross formation closely mirrors the pattern observed in November 2024. Following that cross, BTC experienced a brief 10% correction before launching into a powerful 62% rally. The current market structure shows remarkable similarities, with Bitcoin having dropped 8% after forming the Golden Cross in early June 2025.

    SPONSORED

    Trade Bitcoin with up to 100x leverage on perpetual contracts

    Trade Now on Defx

    Key Price Levels and Projections

    Chain Mind’s analysis projects a potential 51% rally from the current correction bottom, targeting the $150,000-$160,000 range by year-end. This aligns with historical halving data that suggests a major rally toward $180,000 could be in store.

    Critical Support Levels to Watch

    Market expert Crypto Fella identifies the $100,000-$112,049 range as crucial for maintaining bullish momentum. A break below $100,000 could trigger a correction to $95,000-$97,000 levels, representing a 7.66-9.56% decline from current prices.

    Frequently Asked Questions

    What is a Golden Cross in Bitcoin trading?

    A Golden Cross occurs when Bitcoin’s 50-day moving average crosses above its 200-day moving average, typically signaling the start of a major bullish trend.

    How reliable are Golden Cross patterns?

    Historical data shows Golden Cross patterns have preceded significant Bitcoin rallies with roughly 75% accuracy, though past performance doesn’t guarantee future results.

    What could invalidate this bullish scenario?

    A sustained break below the $100,000 support level could invalidate the immediate bullish outlook and trigger a deeper correction.

  • Altcoin Golden Cross Signals Potential 2025 Alt Season Breakout

    The cryptocurrency market is witnessing a significant technical development as the altcoin market capitalization forms a golden cross pattern, potentially signaling the start of a highly anticipated altcoin season. While Bitcoin continues its dominance above $100,000, this technical indicator suggests alternative cryptocurrencies may be preparing for a substantial rally.

    Understanding the Altcoin Golden Cross Formation

    Market expert Ted Pillows has identified a crucial golden cross formation on the altcoin market cap chart, coinciding with historical data patterns that previously preceded major altcoin rallies. This technical pattern occurs when a short-term moving average crosses above a longer-term moving average, typically signaling a shift from bearish to bullish momentum.

    SPONSORED

    Trade meme coins with up to 100x leverage and maximize your alt season gains

    Trade Now on Defx

    Key Technical Indicators Supporting the Altcoin Surge

    The altcoin market has been showing remarkable resilience, maintaining positions above both the 50 and 200-day EMAs since May. This consolidation phase, combined with the golden cross, suggests accumulation before a potential breakout. On-chain analyst Joao Wedson notes that many altcoins are decoupling from Bitcoin’s price action, a phenomenon historically associated with alt season beginnings.

    Market Implications and Trading Opportunities

    With Bitcoin trading above $100,000, the altcoin market’s technical setup suggests a potential redistribution of capital from BTC to alternative cryptocurrencies. This shift could trigger significant price appreciation across the altcoin market, particularly for projects with strong fundamentals and utility.

    Frequently Asked Questions

    What is a Golden Cross in Crypto Markets?

    A golden cross occurs when a short-term moving average crosses above a long-term moving average, typically signaling the potential start of a bullish trend.

    How Long Do Altcoin Seasons Typically Last?

    Historical data shows altcoin seasons can last anywhere from 3-6 months, though market conditions in 2025 may differ from previous cycles.

    What Triggers an Altcoin Season?

    Altcoin seasons are often triggered by Bitcoin price stabilization, increased market confidence, and capital rotation from BTC to alternative cryptocurrencies.

    Investors should maintain careful risk management practices despite the bullish technical indicators, as cryptocurrency markets remain highly volatile and subject to rapid changes in sentiment.

  • Bitcoin Price Golden Cross Signals $115K Target Despite Recent Dip

    Bitcoin Price Golden Cross Signals $115K Target Despite Recent Dip

    Bitcoin’s recent price action has caught the attention of traders and analysts alike, with renowned crypto analyst Doctor Profit highlighting a crucial technical formation that could signal further upside ahead. Recent analysis suggesting a $130K Bitcoin price target by September adds weight to the bullish outlook, despite the current market volatility.

    Golden Cross Formation Suggests Continued Bullish Momentum

    The appearance of a Golden Cross on Bitcoin’s weekly chart has emerged as a significant technical indicator, with historical data showing this pattern’s remarkable accuracy in predicting sustained bull runs. Doctor Profit, known for his precise market calls, emphasizes that this rare technical formation has maintained a perfect track record of predicting multi-month rallies.

    SPONSORED

    Trade Bitcoin with up to 100x leverage and maximize your profit potential

    Trade Now on Defx

    Technical Analysis Breakdown

    Key technical indicators supporting the bullish thesis include:

    • Weekly Golden Cross formation
    • Cup and Handle pattern targeting $113,000-$115,000
    • Higher highs and higher lows since $74,000 bottom
    • Price trading above all major moving averages
    • Bullish MACD crossover on the weekly timeframe

    Market Structure Remains Strong Despite Bearish Divergence

    While some traders have expressed concern over a bearish divergence on the weekly timeframe, Doctor Profit dismisses these worries, citing a similar pattern that appeared at $80,000 without impacting the broader uptrend. Recent data showing whale accumulation of 78,000 BTC further supports the bullish narrative.

    Institutional Factors Supporting Bitcoin’s Uptrend

    Several institutional developments continue to support Bitcoin’s positive outlook:

    • Low BlackRock ETF outflows despite market turbulence
    • Strong institutional holding patterns
    • Long-term holder accumulation continuing

    FAQ Section

    What is a Golden Cross in Bitcoin trading?

    A Golden Cross occurs when a shorter-term moving average crosses above a longer-term moving average, typically signaling a bullish trend change.

    Why is the $115,000 level significant?

    This level represents the upper boundary of the Cup and Handle pattern formation, which typically serves as a strong breakout target.

    What could invalidate this bullish scenario?

    A break below the recent low of $74,000 would invalidate the current bullish structure and potentially signal a trend reversal.

    As Bitcoin continues to navigate through these critical price levels, maintaining position above key moving averages while forming bullish technical patterns suggests the potential for continued upside. Traders should remain vigilant of key support and resistance levels while managing risk appropriately.

  • Bitcoin Price Target $120K: Golden Cross Pattern Signals 87% Success Rate

    Bitcoin Price Target $120K: Golden Cross Pattern Signals 87% Success Rate

    Bitcoin’s remarkable surge from $77,000 to $110,000 may be just the beginning, according to renowned crypto analyst Doctor Profit, who accurately predicted the recent rally. A powerful technical indicator suggests Bitcoin (BTC) could reach new heights of $117,000-$120,000 in the coming weeks, backed by strong institutional demand and favorable market conditions.

    Golden Cross Pattern Emerges as Key Bullish Signal

    The emergence of a Golden Cross pattern on Bitcoin’s chart has become the centerpiece of this bullish forecast. This technical formation has historically preceded major price rallies, with Doctor Profit noting an impressive 87.8% accuracy rate on higher timeframes.

    Historical data supports this optimistic outlook:

    • October 2023: 170% surge from $27,000 to $73,000
    • October 2024: 73% gain from $63,000 to $109,000
    • May 2025: New pattern formation above $110,000

    Institutional Demand Drives Price Momentum

    Beyond technical indicators, several fundamental factors support the continued upward trajectory:

    SPONSORED

    Trade Bitcoin with up to 100x leverage and maximize your profit potential

    Trade Now on Defx

    ETF Inflows Reach Record Levels

    Spot Bitcoin ETF demand has reached unprecedented levels, with daily inflows now exceeding mining production by 9x. This supply-demand imbalance continues to drive prices higher, while institutional accumulation reduces available market supply.

    Price Targets and Technical Levels

    Doctor Profit outlines several key price levels:

    • Immediate target: $113,000 (3.71% from current levels)
    • Major liquidity cluster: $113,000
    • Ultimate target range: $117,000-$120,000

    FAQ Section

    What is a Golden Cross pattern?

    A Golden Cross occurs when a shorter-term moving average crosses above a longer-term moving average, signaling a potential bullish trend reversal.

    How reliable are these price predictions?

    While past performance doesn’t guarantee future results, the Golden Cross pattern has demonstrated an 87.8% accuracy rate on higher timeframes.

    What could prevent Bitcoin from reaching these targets?

    Market volatility, regulatory changes, or macroeconomic factors could impact Bitcoin’s price trajectory.

    As Bitcoin continues its upward momentum, investors should monitor key technical levels and institutional flows while maintaining appropriate risk management strategies.

  • Bitcoin Price Dips Below $109K: Golden Cross Signals $113K Target

    Bitcoin (BTC) has retreated below the critical $109,000 level, marking a 3% decline from its recent all-time high of $111,800. This price action comes amid diverging analyst predictions about the leading cryptocurrency’s next major move, with technical indicators suggesting conflicting scenarios.

    As covered in our recent analysis of Bitcoin testing $110K resistance, the market continues to show significant volatility at these elevated levels.

    Golden Cross Formation Suggests Further Upside

    Prominent crypto analyst Doctor Profit has identified a rare Golden Cross formation on Bitcoin’s chart, historically a powerful bullish indicator with an impressive 87.8% accuracy rate on higher timeframes. This technical pattern has only appeared twice in the past two years, with each occurrence preceding substantial price rallies:

    • October 2023: 170% surge from $27,000 to $73,000
    • October 2024: 73% increase from $63,000 to $109,000

    SPONSORED

    Trade Bitcoin with up to 100x leverage on perpetual contracts

    Trade Now on Defx

    Institutional Flows Support Bullish Case

    Supporting the bullish outlook, Bitcoin ETF inflows are currently nine times greater than mining production, creating significant supply pressure. Strategy’s (formerly MicroStrategy) continued Bitcoin accumulation further compounds this effect, with their latest purchase occurring Monday.

    Potential Bull Trap Warnings

    However, analyst Cameron Fous presents a contrarian view, warning of a possible bull trap formation. His analysis suggests that Bitcoin’s current price action bears similarities to previous market cycle peaks, with particular attention to the 50-day moving average as a critical support level.

    Key Price Levels to Watch

    • Current Price: $108,739
    • Recent ATH: $111,800
    • Key Support: 50-day MA
    • Bullish Target: $113,000
    • Extended Target Range: $130,000 – $200,000

    Frequently Asked Questions

    What is a Golden Cross in Bitcoin trading?

    A Golden Cross occurs when the 50-day moving average crosses above the 200-day moving average, typically signaling a strong bullish trend.

    How reliable are Golden Cross signals?

    According to historical data, Golden Cross signals on Bitcoin have shown an 87.8% accuracy rate on higher timeframes.

    What could trigger a bearish reversal?

    A break below the 50-day moving average could signal a trend reversal, particularly if accompanied by declining trading volumes.

    As Bitcoin continues to navigate these critical price levels, traders should maintain strict risk management practices and monitor key technical indicators for confirmation of either bullish or bearish scenarios.

  • Bitcoin Golden Cross Signals $320K Target After Flash Sale Warning

    Bitcoin Golden Cross Signals $320K Target After Flash Sale Warning

    Bitcoin (BTC) has triggered a historic Golden Cross pattern, historically a precursor to major bull runs, with analysts projecting an eventual surge to $320,000 after a potential short-term correction. This technical development comes as Bitcoin continues testing resistance near its all-time high of $112,000.

    Understanding the Golden Cross Pattern

    The Golden Cross, a powerful technical indicator formed when the 50-day moving average crosses above the 200-day moving average, has historically preceded Bitcoin’s most significant rallies. Market expert Kyle Chasse’s analysis reveals impressive historical precedents:

    • 2016: 139% price increase following Golden Cross
    • 2017: Unprecedented 2,200% rally
    • 2020: 1,190% surge leading to previous $69,000 ATH

    SPONSORED

    Trade Bitcoin with up to 100x leverage and maximize your profit potential

    Trade Now on Defx

    Flash Sale Opportunity Ahead

    Despite the bullish signal, Chasse warns of an imminent 10-15% correction before the next leg up. This aligns with recent analysis showing Bitcoin’s UTXO profitability reaching 99%, potentially indicating a short-term pullback.

    Key Price Targets

    Analysts have mapped out several critical price levels:

    • Initial correction: 10-15% pullback expected
    • Reload zone: $98,000 – $101,000
    • Q3 2025 target: $130,000
    • Q4 2025 target: $160,000
    • Ultimate target: $320,000

    Impact on Altcoins

    The anticipated correction could hit altcoins harder, with predictions of 30-40% drops during Bitcoin’s consolidation phase. Investors are advised to manage risk accordingly.

    FAQ

    What is a Golden Cross?
    A Golden Cross occurs when the 50-day moving average crosses above the 200-day moving average, typically signaling the start of a bullish trend.

    How reliable are Golden Cross signals?
    Historically, Golden Crosses have preceded major Bitcoin rallies, with success rates above 70% in predicting significant uptrends.

    Should investors buy during the flash sale?
    While corrections offer buying opportunities, investors should consider their risk tolerance and avoid using excessive leverage during volatile periods.

    Time to read: 5 minutes

  • XRP Price Golden Cross Signal Hints at Potential 600% Rally Ahead

    XRP has flashed a critical technical signal that previously triggered a massive 600% price surge, suggesting another potential rally could be on the horizon. Recent technical analysis indicates strong bullish momentum as the token tests key resistance levels.

    Weekly RSI Golden Cross Returns After 200-Day Absence

    According to prominent crypto analyst Dark Defender, XRP’s weekly RSI indicator has produced a rare Golden Cross pattern – the same technical formation that preceded the token’s explosive 600% rally in November 2024. This development coincides with XRP breaking above a major weekly resistance trendline at $2.59, forming a bullish pin bar candlestick that reinforces the positive outlook.

    SPONSORED

    Trade XRP with up to 100x leverage on perpetual contracts

    Trade Now on Defx

    Key Price Targets: $3.33 and $5.85 in Focus

    The analysis outlines two critical price objectives for XRP:

    • Primary target: $3.33 (43% potential upside)
    • Secondary target: $5.85 (150% potential upside)

    These targets are supported by multiple technical factors:

    • Weekly RSI Golden Cross confirmation
    • Breakout above major resistance trendline
    • Elliott Wave structure entering Wave III (typically the strongest wave)
    • 261.8% Fibonacci extension level at $5.85

    Elliott Wave Analysis Points to Extended Rally

    The current Elliott Wave structure suggests XRP is entering Wave III, historically the most powerful phase of a bullish cycle. This technical pattern, combined with growing institutional interest in XRP futures, could provide the momentum needed for sustained price appreciation.

    Frequently Asked Questions

    What caused XRP’s previous 600% rally?

    The November 2024 rally was triggered by a combination of the weekly RSI Golden Cross, positive market sentiment, and increased institutional adoption.

    How reliable is the Golden Cross signal?

    While past performance doesn’t guarantee future results, the weekly RSI Golden Cross has historically been a strong indicator of sustained bullish momentum for XRP.

    What could prevent XRP from reaching these targets?

    Key risks include overall market conditions, regulatory developments, and potential technical resistance levels at $2.59 and $3.33.

    At time of writing, XRP trades at $2.34, showing strong momentum after recently testing the $2.47 level. Traders should monitor key support and resistance levels while maintaining appropriate risk management strategies.

  • Bitcoin Golden Cross Alert: Key $113K Target as Price Hits New ATH

    Bitcoin Golden Cross Alert: Key $113K Target as Price Hits New ATH

    Bitcoin’s remarkable price action continues to captivate the crypto market as the leading cryptocurrency pushes into uncharted territory. After breaking through the critical $105,503 resistance level, BTC has established new all-time highs, with analysts now eyeing the $120,000 level as the next major target.

    Golden Cross Formation: A Lagging Indicator?

    While the cryptocurrency community celebrates the formation of a golden cross between Bitcoin’s 50 and 200-day moving averages, prominent analyst FX_Professor offers a contrarian perspective on this widely-watched technical signal. According to his analysis, the golden cross may be more of a lagging confirmation rather than a leading indicator for price action.

    This assessment gains credibility as Bitcoin ETF inflows reach record levels, suggesting institutional interest preceded the technical formation.

    SPONSORED

    Trade Bitcoin with up to 100x leverage on perpetual contracts

    Trade Now on Defx

    Early Entry Zones: The Real Signal

    FX_Professor emphasizes the importance of identifying pressure zones before technical confirmations appear. His analysis highlights the $74,394-$79,000 range as a crucial accumulation zone that preceded the current rally. This approach aligns with traditional market structure analysis and has proven effective as Bitcoin continues its upward trajectory.

    Current Market Outlook

    Bitcoin currently trades at $110,734, representing a 3.1% increase over the past 24 hours. The recent pullback from $111,544 appears to be a healthy consolidation, with strong support levels established. Technical indicators suggest further upside potential, particularly as selling pressure remains notably low despite the new all-time highs.

    FAQ Section

    What is a Bitcoin golden cross?

    A golden cross occurs when the 50-day moving average crosses above the 200-day moving average, traditionally considered a bullish signal in technical analysis.

    Why are pressure zones important for Bitcoin trading?

    Pressure zones indicate areas of significant buying or selling interest before technical indicators confirm trends, potentially offering earlier entry points for traders.

    What’s the next major resistance level for Bitcoin?

    Based on current analysis and market structure, the next significant resistance level appears to be around $113,000, with potential for extension to $120,000.