Tag: Ltc Price

  • Litecoin Price Drops Below $87: Technical Indicators Signal Further Decline

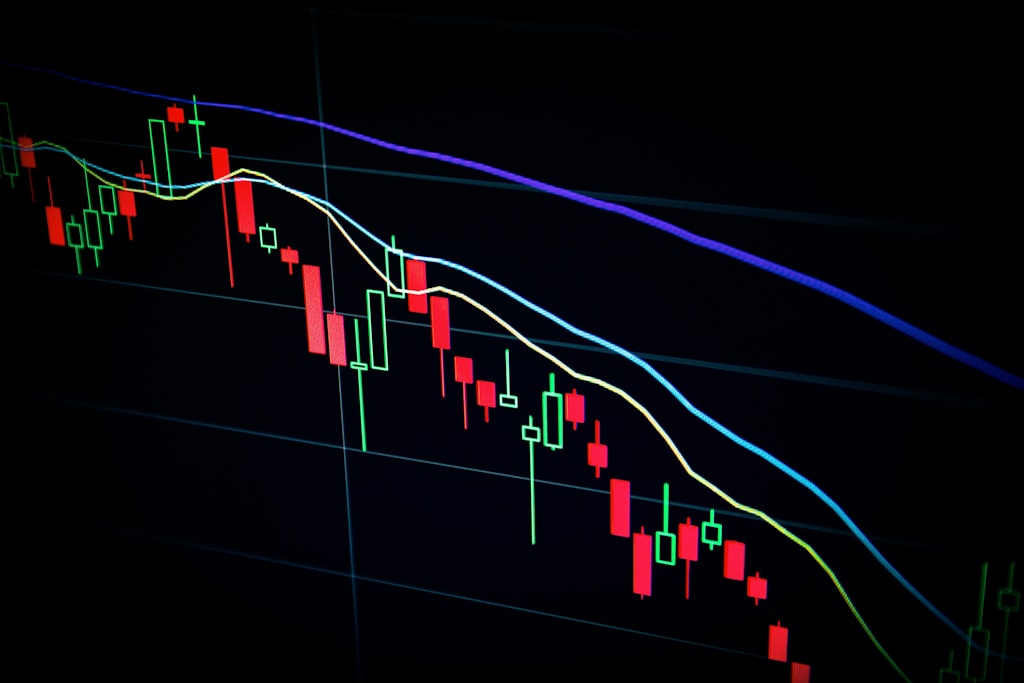
    Litecoin (LTC) continues to face significant downward pressure as the cryptocurrency struggles to maintain support levels, with technical indicators suggesting more bearish momentum ahead. According to crypto analyst Grayhoood, LTC has experienced a concerning 2.8% decline over the past 24 hours, dropping from $89.00 to a current price of $84.00.

    Technical Analysis Shows Mounting Bearish Pressure

    The recent price action has triggered multiple bearish signals across key technical indicators. The Relative Strength Index (RSI) is approaching oversold territory, while both the Stochastic indicator and Commodity Channel Index (CCI) paint a pessimistic picture for LTC’s short-term prospects. This technical weakness mirrors patterns seen in broader market RSI trends, though Bitcoin’s indicators currently point to potential upside.

    SPONSORED

    Trade Litecoin with up to 100x leverage on perpetual contracts

    Trade Now on Defx

    Short-Term vs Long-Term Outlook

    While short-term metrics paint a bearish picture, with LTC showing a -9.0% weekly decline and -12.5% biweekly drop, the longer-term outlook maintains some optimism. The cryptocurrency has managed to secure a 2.3% yearly gain, suggesting underlying strength in its fundamental value proposition.

    Key Support Levels and Price Targets

    Traders should watch the following critical support levels:

    • Primary Support: $84.00
    • Secondary Support: $82.50
    • Major Support: $80.00

    FAQ: Litecoin Price Movement

    Why is Litecoin dropping today?

    Litecoin’s decline is attributed to increasing selling pressure and bearish technical indicators, including RSI movement toward oversold territory.

    What are the key support levels to watch?

    The immediate support level is at $84.00, with secondary support at $82.50 and major support at $80.00.

    Is Litecoin still bullish long-term?

    Despite short-term weakness, Litecoin maintains a 2.3% yearly gain, suggesting potential long-term value for investors.
  • Litecoin Price at Crossroads: BTC Dominance Key for $128 Target

    Litecoin Price at Crossroads: BTC Dominance Key for $128 Target

    Litecoin (LTC) stands at a critical juncture after closing with an indecisive daily candle, as market participants closely monitor Bitcoin Dominance (BTC.D) for directional cues. According to leading analysts, LTC’s next significant move hinges on a potential shift in BTC.D, which could either catalyze a bullish breakout or extend the current consolidation phase.

    Technical Analysis Points to Key $96 Level

    Renowned crypto analyst CRYPTOWZRD has highlighted a crucial technical setup forming on Litecoin’s daily chart. The LTC/USDT and LTC/BTC pairs both displayed indecisive closes, typically signaling a period of market uncertainty. This price action aligns with broader market movements as Bitcoin tests key support levels, suggesting a correlation between major cryptocurrency price actions.

    SPONSORED

    Trade Litecoin with up to 100x leverage on perpetual contracts

    Trade Now on Defx

    Bitcoin Dominance: The Hidden Catalyst

    The analysis reveals that Bitcoin dominance trends could significantly impact Litecoin’s price trajectory. A decline in BTC.D historically benefits altcoins, potentially allowing LTCBTC to gain momentum. Technical indicators suggest the formation of a bullish “W” reversal pattern, which could signal the start of an upward trend if validated.

    Key Price Levels and Targets

    • Critical resistance: $96
    • Secondary target: $102
    • Major resistance: $128
    • Current market structure: Choppy with sideways bias

    Trading Strategy and Risk Management

    CRYPTOWZRD emphasizes the importance of waiting for confirmation above $96 before considering long positions. The analyst suggests that sustained price action above this threshold could trigger a rally toward $128, though traders should remain cautious given current market conditions.

    FAQ Section

    Q: What is the main factor affecting Litecoin’s price currently?
    A: Bitcoin Dominance (BTC.D) movements are currently the primary factor influencing Litecoin’s price action.

    Q: What price level needs to break for a bullish scenario?
    A: A sustained break above $96 could trigger a bullish move toward $128.

    Q: How does Bitcoin Dominance affect Litecoin?
    A: Decreasing Bitcoin Dominance typically allows altcoins like Litecoin to gain market share and value.

    Market Outlook and Conclusion

    While the immediate price action remains uncertain, the technical setup suggests potential for upside movement if key levels are breached. Traders should monitor Bitcoin’s performance and overall market sentiment for confirmation of directional bias.

  • Litecoin Price Eyes $150: Key Monthly Resistance Could Trigger 30% Rally

    Litecoin Price Eyes $150: Key Monthly Resistance Could Trigger 30% Rally

    Litecoin (LTC) appears poised for a significant breakout as technical analysis suggests a monthly close above key resistance could catalyze a major rally to levels not seen since 2021. This potential move comes amid Bitcoin’s recent surge to $111,000, which has helped lift the broader crypto market.

    Technical Analysis Points to Bullish Setup

    LTC has demonstrated remarkable strength with a 63% surge from April’s lows, reclaiming crucial support levels at $80 and $90. The cryptocurrency recently touched a two-month high of $107, forming a bullish flag pattern that suggests further upside potential.

    Analyst Carl Runefelt from The Moon Show identifies a clear technical setup targeting $117.50, representing a 20% move from current levels. The formation of a bullish flag pattern, combined with strong support at $92, provides a solid foundation for the anticipated breakout.

    SPONSORED

    Trade Litecoin with up to 100x leverage and maximize your potential returns

    Trade Now on Defx

    Key Resistance Level Could Trigger Major Rally

    Rekt Capital’s analysis highlights the critical $110-$125 horizontal resistance zone as the key to unlocking significant upside potential. Historical data shows this level has acted as a major pivot point, with rejections becoming progressively weaker since 2019.

    Monthly Close Critical for $150 Target

    A successful monthly close above the key horizontal level, followed by a retest and confirmation, could provide the momentum needed for a 30% rally toward $150. This move would represent LTC’s highest price level since the 2021 bull market.

    FAQ Section

    Q: What is the current price of Litecoin?
    A: Litecoin currently trades at $98.60, showing a 2.7% decline over the past week.

    Q: What is the key resistance level to watch?
    A: The critical resistance zone lies between $110-$125, with a monthly close above this range potentially triggering a rally to $150.

    Q: What technical pattern supports the bullish outlook?
    A: A bullish flag pattern has formed after the recent two-month high, suggesting a potential 20% move to $117.50.

  • Litecoin Price Eyes $117.50 Breakout After 69% Monthly Rally

    Litecoin Price Eyes $117.50 Breakout After 69% Monthly Rally

    Litecoin (LTC) is showing strong bullish momentum after surging 69% in the past month, with analysts eyeing a potential breakout to $117.50. The cryptocurrency is currently consolidating near critical support levels as Bitcoin trades near its all-time high of $109K, setting up what could be a significant move for LTC.

    Technical analyst Carl Runefelt has identified a bullish flag pattern forming on Litecoin’s chart, suggesting the potential for further upside. The pattern, typically a continuation signal, comes after LTC’s impressive rally from April lows of $66 to recent highs above $100.

    Technical Analysis Points to Key Support and Resistance Levels

    Litecoin is currently trading at $95.35, finding support above its 200-day EMA at $93.82. The critical resistance zone lies at the 200-day SMA near $100.76, with the psychological $100 level proving to be a significant hurdle. A breakthrough above these levels could trigger the projected move to $117.50.

    SPONSORED

    Trade Litecoin with up to 100x leverage on perpetual contracts

    Trade Now on Defx

    Market Structure Supports Bullish Thesis

    Volume analysis shows decreasing selling pressure during recent consolidation, supporting the bullish continuation thesis. The broader crypto market sentiment remains positive, with Bitcoin’s strength likely to provide additional tailwinds for altcoins like Litecoin.

    FAQ: Key Questions About Litecoin’s Current Setup

    What are the key support levels to watch?

    The primary support zone lies at $93.82 (200-day EMA), with secondary support at $90.00.

    What could trigger the breakout to $117.50?

    A decisive break above $100.76 with increased volume would confirm the bullish flag pattern and potentially trigger the move to $117.50.

    What are the main risks to this setup?

    A Bitcoin reversal from current levels could impact the broader market, potentially derailing Litecoin’s bullish setup.