Key Takeaways:
- Bitcoin trading at $108,776 with $2.16T market cap
- Technical indicators showing mixed signals at crucial resistance
- 24-hour trading volume reaches $32.47B amid consolidation
Bitcoin’s price action has reached a pivotal moment as the leading cryptocurrency trades near $108,776, supported by a substantial market capitalization of $2.16 trillion. As on-chain indicators continue flashing key signals at the $108K level, traders are closely monitoring technical patterns for signs of the next major move.
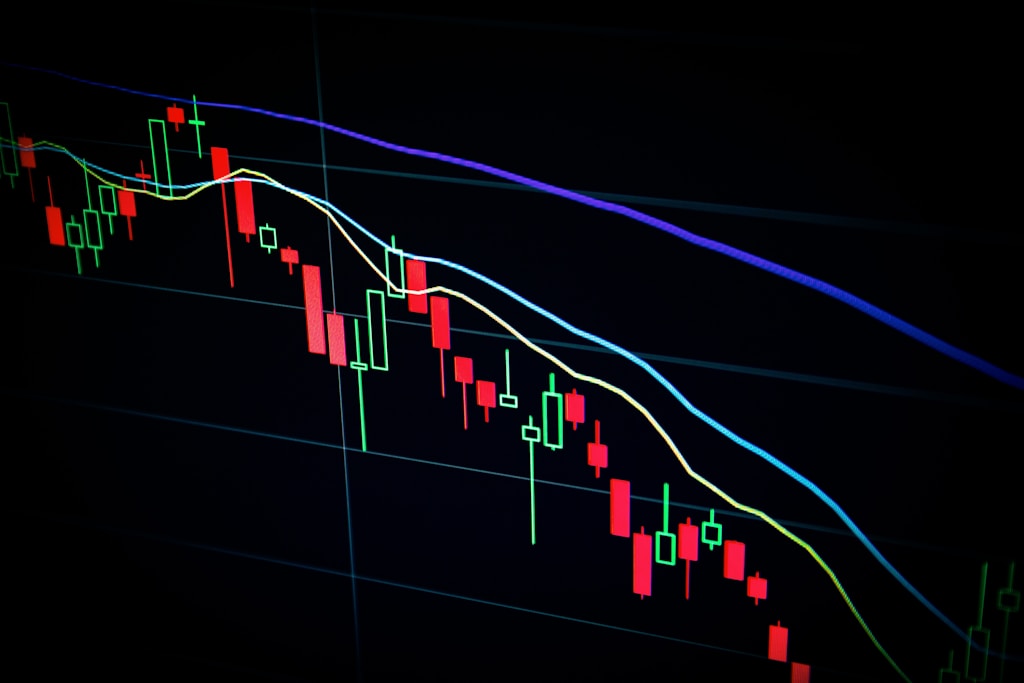
Technical Analysis: MACD and RSI Divergence
The current market structure shows conflicting signals from key technical indicators. The Moving Average Convergence Divergence (MACD) histogram suggests potential bearish divergence, while the Relative Strength Index (RSI) maintains bullish momentum above the 50 mark.
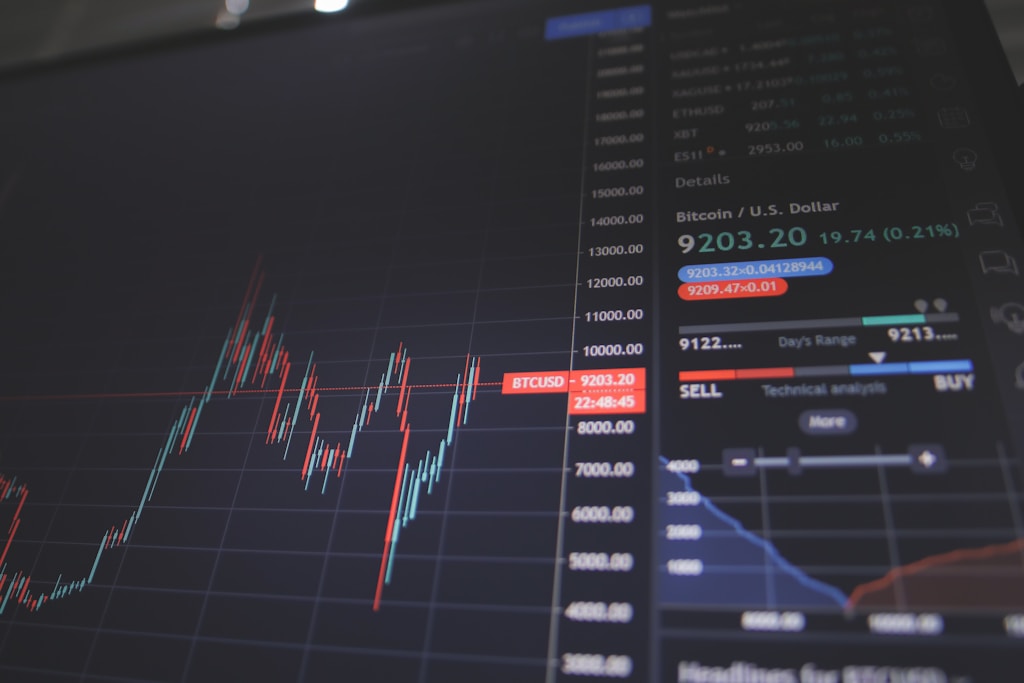
Trading Volume and Market Dynamics
With a 24-hour trading volume of $32.47 billion, Bitcoin’s price has established a clear trading range between $107,107 and $109,057. This consolidation phase comes as retail interest remains surprisingly low despite recent all-time highs.
SPONSORED
Maximize your trading potential with up to 100x leverage on perpetual contracts
Key Support and Resistance Levels
The daily chart indicates Bitcoin is maintaining an uptrend from the $91,700 level, with immediate resistance at $109,000 and support at $107,100. A breakthrough above current levels could target the recent high of $111,000.
Expert Analysis and Market Outlook
Market analysts suggest the current technical setup could precede a significant move, with some pointing to potential rallies targeting $162K by November.
FAQ Section
- What do mixed MACD and RSI signals indicate?
Mixed signals often suggest a period of consolidation before a decisive move in either direction. - Why is trading volume significant at current levels?
High trading volume during consolidation typically indicates strong market interest and potential for a breakout. - What are the key levels to watch?
Primary resistance at $109,000 and support at $107,100 are crucial for short-term price direction.