Tag: Market Analysis

  • Ethereum Price Targets $3,500 as Technical Indicators Signal 38% Rally

    Ethereum Price Targets $3,500 as Technical Indicators Signal 38% Rally

    Ethereum (ETH) appears poised for a significant breakout, with multiple technical indicators suggesting a potential 38% surge to $3,500. This analysis comes as Ethereum ETFs continue their impressive performance streak, adding fundamental strength to the technical outlook.

    Technical Analysis Points to Major Ethereum Breakout

    Renowned crypto analyst Crypto Bullet has identified the 50-day Exponential Moving Average (50EMA) as the final hurdle before ETH can initiate its next major rally. The analysis suggests that once this resistance is cleared, Ethereum could experience a parabolic surge of approximately 38%, targeting the $3,500 level.

    Supporting this bullish outlook, ETH has already demonstrated significant strength by breaking above the crucial $2,500 resistance level. This breakthrough has established a solid foundation for further upward movement, with the next major resistance zone lying between $3,000 and $3,300.

    SPONSORED

    Trade Ethereum with up to 100x leverage and maximize your profit potential

    Trade Now on Defx

    Multiple Analysts Confirm Bullish Outlook

    Trader Tardigrade, another respected market analyst, has identified an ascending triangle pattern that suggests ETH is preparing for a significant move above $3,000. This technical formation, combined with the recent close above $2,650, provides strong evidence for an imminent bull run.

    Key Technical Levels to Watch

    • Current Support: $2,400-$2,600 range
    • Immediate Resistance: 200-day Moving Average ($3,000-$3,300)
    • Target Level: $3,500
    • Ultimate Breakout Target: $4,000

    Frequently Asked Questions

    What is driving Ethereum’s current price movement?

    The combination of strong ETF inflows, technical breakouts, and increasing institutional interest is creating positive momentum for ETH.

    What are the key resistance levels to watch?

    The primary resistance zones are at $3,000-$3,300 (200-day MA) and $3,500 (target level).

    How likely is the predicted 38% surge?

    While no prediction is guaranteed, the confluence of multiple technical indicators and strong market fundamentals supports the possibility of this move.

    At press time, Ethereum is trading at $2,670, showing a 7% gain in the last 24 hours. With multiple technical indicators aligning and strong market fundamentals, the path to $3,500 appears increasingly probable.

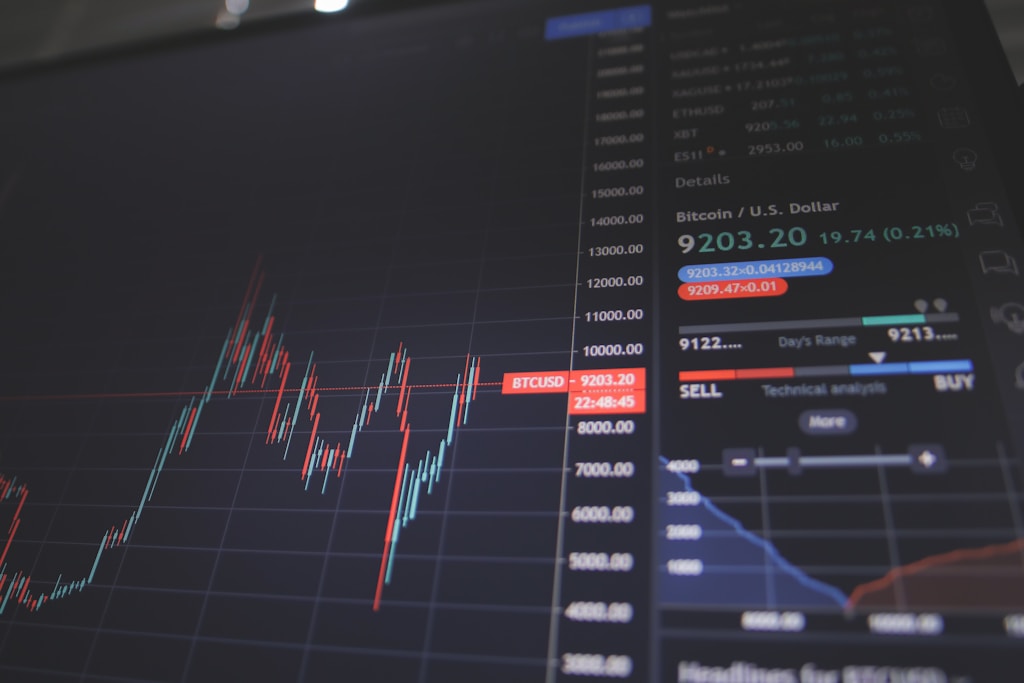
  • Bitcoin Hits $110K as Exchange Reserves Drop to Historic Low

    Bitcoin Hits $110K as Exchange Reserves Drop to Historic Low

    Bitcoin surged past $110,000 on Tuesday morning in Asia, marking a significant milestone as exchange reserves hit their lowest levels since 2018. This price movement comes amid a perfect storm of bullish indicators, including massive short liquidations and improving US-China trade relations.

    As Bitcoin’s market cap reaches $2.19 trillion, on-chain metrics reveal an increasingly supply-constrained market that could fuel further upside.

    Record Low Exchange Reserves Signal Strong HODLing

    CryptoQuant data shows centralized exchanges have experienced a dramatic outflow of 550,000 BTC since July 2024, with reserves plummeting from 1.55 million to just 1.01 million BTC. This exodus of Bitcoin from exchanges typically indicates long-term accumulation rather than short-term trading activity.

    SPONSORED

    Trade Bitcoin with up to 100x leverage on perpetual contracts

    Trade Now on Defx

    Short Squeeze Catalyzes Price Action

    The latest rally was amplified by a significant short squeeze, with Coinglass reporting $203 million in liquidations over 24 hours – 96% of which were short positions. This forced covering helped propel Bitcoin briefly above $110,000, settling around $109,450.

    Derivatives Market Shows Strength

    Trading volume in Bitcoin derivatives more than doubled, reaching $110 billion as open interest expanded 7.3% to $77 billion. These metrics suggest substantial new capital entering the market and growing trader confidence.

    Macro Factors Support Rally

    Recent US-China trade talks in London have contributed to improved risk sentiment across global markets. The positive momentum in diplomatic relations has provided additional tailwinds for Bitcoin’s ascent.

    What’s Next for Bitcoin?

    While some analysts project targets as high as $150,000 by year-end, maintaining this trajectory will require sustained institutional demand and continued outflows from exchanges. The combination of dwindling exchange reserves and increasing derivatives activity suggests the potential for further upside, though volatility remains a key consideration.

    FAQ

    Why are low exchange reserves bullish for Bitcoin?

    Lower exchange reserves typically indicate that investors are moving Bitcoin to cold storage for long-term holding, reducing available supply for trading and potentially driving up prices.

    What caused the recent short squeeze?

    The combination of positive macro news and strong buying pressure forced traders with short positions to cover, creating a cascade of buying that pushed prices higher.

    Could Bitcoin reach $150,000 this year?

    While possible, sustaining such levels would require continued institutional adoption, favorable regulatory developments, and stable macroeconomic conditions.

  • Bitcoin Price Holds Above $109K: Bulls Eye New ATH Push

    Bitcoin Price Holds Above $109K: Bulls Eye New ATH Push

    Key Takeaways:

    • Bitcoin trades between $109,748-$109,818 with $2.18T market cap
    • 24-hour trading volume reaches $38.10B amid strong momentum
    • Price consolidation suggests potential for further upside

    Bitcoin continues to demonstrate remarkable strength as it maintains its position above the crucial $109,000 level, following last week’s surge that liquidated $81M in short positions. The leading cryptocurrency is currently trading in a tight range between $109,748 and $109,818 as of Tuesday morning ET.

    The market capitalization stands at an impressive $2.18 trillion, while the 24-hour trading volume of $38.10 billion indicates robust market participation. This sustained activity comes as on-chain metrics signal strong accumulation near these levels.

    Technical Analysis and Market Structure

    The intraday trading range of $107,115 to $110,282 reveals significant buyer support at lower levels, with bulls defending the psychological $107K support zone. The consolidation pattern forming near all-time highs suggests potential for another leg up if current levels hold.

    SPONSORED

    Trade Bitcoin with up to 100x leverage and maximize your profit potential

    Trade Now on Defx

    Market Sentiment and Institutional Interest

    The sustained price action above $109K comes amid increasing institutional adoption, with BlackRock’s IBIT ETF recently hitting $70B in AUM. This institutional backing provides crucial support for current price levels.

    FAQs

    • What’s the next major resistance level for Bitcoin?
      The immediate resistance lies at $110,282, with the psychological $111K level serving as the next major barrier.
    • Is the current consolidation bullish or bearish?
      The high-level consolidation with strong volume typically suggests bullish continuation, especially given the recent market structure.
    • What factors are supporting the current price levels?
      Institutional adoption, strong on-chain metrics, and sustained retail interest are key factors maintaining current price levels.

    Traders should monitor key support levels and volume patterns for potential breakout signals as Bitcoin continues its impressive 2025 performance.

  • XRP Price Nears $2.50 Decision Zone: Key Technical Levels Ahead

    XRP Price Nears $2.50 Decision Zone: Key Technical Levels Ahead

    XRP is approaching a critical technical decision point near $2.50, as the cryptocurrency extends its recent bounce toward the upper range of its seven-month trading channel. Currently trading at $2.30, XRP’s price action suggests an impending major move that could determine the token’s trajectory for Q3 2025.

    Technical Analysis Points to Key Price Levels

    According to prominent crypto analyst Quantum Ascend, XRP has been confined to a consolidation range between $2.00 and $2.80 since December 2024. The current price structure shows signs of a completed Elliott Wave pattern, with the token having retraced over 50% of its previous upward movement – a classic technical setup that often precedes significant price action.

    The critical decision zone lies between $2.42 and $2.52, corresponding to the 0.618-0.786 Fibonacci retracement levels. This range will likely determine whether XRP continues its upward trajectory or faces a temporary pullback. Recent analysis has highlighted these key resistance levels as crucial for XRP’s next directional move.

    SPONSORED

    Trade XRP with up to 100x leverage on perpetual contracts

    Trade Now on Defx

    Bitcoin Correlation and Market Dynamics

    The token’s immediate future appears closely tied to Bitcoin’s performance, as noted by market observers. Bitcoin’s recent surge past $110,000 has created positive momentum across the crypto market, potentially supporting XRP’s push toward higher levels.

    Upcoming Catalysts and Price Targets

    A significant catalyst looms on June 17th as the SEC faces a deadline regarding Franklin Templeton’s spot-XRP ETF proposal. This development could mirror January’s Bitcoin ETF momentum, potentially driving XRP beyond its current range.

    FAQ Section

    What are the key resistance levels for XRP?

    The primary resistance zone lies between $2.42 and $2.52, with $2.80 serving as the upper range boundary.

    What is the next major catalyst for XRP?

    The SEC’s decision on Franklin Templeton’s spot-XRP ETF proposal, due June 17th, represents the next significant potential price catalyst.

    What is XRP’s current trading range?

    XRP has been trading between $2.00 and $2.80 since December 2024.

    At press time, XRP trades at $2.28, with market participants closely monitoring the token’s approach toward the crucial $2.42-$2.52 decision zone.

  • Bitcoin ETFs See $386M Inflow Surge as Ethereum ETFs Extend Rally

    Bitcoin ETFs See $386M Inflow Surge as Ethereum ETFs Extend Rally

    Bitcoin and Ethereum ETFs are demonstrating remarkable strength in the institutional investment space, with Bitcoin ETFs recording a substantial $386 million inflow while Ethereum ETFs maintain their impressive bull run. This latest development marks a significant shift in crypto investment trends, building on previous ETF adoption momentum highlighted by BlackRock’s analysis.

    Bitcoin ETFs Reverse Outflow Trend

    After experiencing a brief period of outflows, Bitcoin ETFs have staged a powerful comeback, attracting $386 million in fresh capital. This reversal has pushed the total assets under management (AuM) back above the crucial $130 billion threshold, demonstrating sustained institutional interest in digital asset investment vehicles.

    Ethereum ETFs’ Historic Streak Continues

    Ethereum ETFs have maintained their remarkable performance, marking their 16th consecutive day of net inflows with an additional $52.71 million in investments. This consistent growth aligns with recent Ethereum price movements and technical analysis, suggesting growing institutional confidence in the second-largest cryptocurrency.

    SPONSORED

    Trade crypto with up to 100x leverage on perpetual contracts

    Trade Now on Defx

    Market Impact and Analysis

    The renewed interest in crypto ETFs suggests a broader institutional adoption trend, potentially setting the stage for continued market growth. The simultaneous success of both Bitcoin and Ethereum ETFs indicates diversifying institutional strategies in the digital asset space.

    FAQ Section

    What is driving the current Bitcoin ETF inflows?

    The recent inflow surge is primarily driven by institutional investors returning to the market after a brief consolidation period, coupled with improving market sentiment.

    How significant is the 16-day Ethereum ETF inflow streak?

    This represents one of the longest consecutive inflow periods for Ethereum ETFs, indicating strong and sustained institutional interest in ETH exposure through regulated investment vehicles.

    What does this mean for crypto market outlook?

    The consistent ETF inflows suggest growing institutional confidence in both Bitcoin and Ethereum, potentially supporting sustained price appreciation and market stability.

  • ChatGPT Global Outage Disrupts Crypto Trading Bots and AI Markets

    ChatGPT Global Outage Disrupts Crypto Trading Bots and AI Markets

    A massive ChatGPT outage has sent shockwaves through the crypto and AI markets today, with OpenAI’s flagship service experiencing a three-hour worldwide disruption that affected millions of users, including crypto trading algorithms and market analysis tools.

    Key Impact Points of the ChatGPT Outage

    The widespread service interruption began early Tuesday, with OpenAI confirming they are investigating “elevated error rates” across most of their services. This outage has particularly impacted:

    • Automated crypto trading systems utilizing ChatGPT APIs
    • Market analysis tools powered by OpenAI’s language models
    • AI-driven portfolio management services
    • Crypto sentiment analysis platforms

    This disruption comes at a critical time, as recent AI-related protests in Los Angeles have highlighted growing tensions around artificial intelligence technology adoption.

    SPONSORED

    Trade automatically with advanced AI-powered trading bots on Defx

    Trade Now on Defx

    Market Impact Analysis

    The outage has revealed the crypto market’s growing dependence on AI technologies, with several key areas affected:

    Service Type Impact Level Recovery Status
    Trading Bots High Partial
    Market Analysis Medium Ongoing
    Risk Management Low Restored

    Expert Insights and Future Implications

    Industry experts suggest this outage could accelerate the development of more resilient AI systems for crypto trading. The incident has also sparked discussions about centralization risks in AI-dependent trading strategies.

    FAQ Section

    How did the ChatGPT outage affect crypto trading?

    The outage impacted automated trading systems and market analysis tools that rely on ChatGPT’s API, potentially affecting trading decisions and market analysis capabilities.

    What measures can traders take to protect against AI service disruptions?

    Experts recommend implementing backup systems and diversifying AI providers to maintain trading continuity during service interruptions.

    Will this incident affect the integration of AI in crypto markets?

    While the outage highlights potential risks, it’s likely to drive improvements in AI system reliability rather than slow adoption.

  • Russian Ruble Dominates 2025 Currency Markets Despite Sanctions

    Russian Ruble Dominates 2025 Currency Markets Despite Sanctions

    Russian Ruble Dominates 2025 Currency Markets Despite Sanctions

    The Russian ruble has emerged as 2025’s best-performing currency, defying international sanctions and showcasing the complex dynamics of global financial markets. This surprising development comes as Russian financial activities face increased scrutiny in the crypto sector, highlighting the divergence between traditional and digital finance.

    Key Findings on Ruble’s Performance

    • Bank of America confirms ruble’s position as top-performing currency in 2025
    • Central Bank of Russia’s strategic economic interventions prove effective
    • Capital controls play crucial role in maintaining currency stability

    Understanding the Ruble’s Resilience

    The ruble’s remarkable performance stems not from organic market confidence but rather from calculated economic measures implemented by Russian authorities. The Central Bank of Russia has deployed several key strategies:

    • Strict capital controls limiting currency outflows
    • Strategic interest rate management
    • Mandatory foreign currency conversion requirements

    SPONSORED

    Trade with confidence using advanced risk management tools

    Trade Now on Defx

    Impact on Global Markets

    The ruble’s performance has significant implications for international trade and cryptocurrency markets. As traditional currency markets show resilience to geopolitical pressures, digital assets continue to provide alternative channels for cross-border transactions.

    FAQ Section

    Why is the Russian ruble performing so well in 2025?

    The currency’s strength is primarily due to strict capital controls and central bank interventions rather than natural market forces.

    How do sanctions affect the ruble’s performance?

    While sanctions have limited Russia’s access to global markets, domestic monetary policies have helped maintain currency stability.

    What does this mean for global crypto markets?

    The situation highlights the growing importance of cryptocurrency as an alternative financial channel in regions facing traditional banking restrictions.

    Looking Ahead: Market Implications

    As the global financial landscape continues to evolve, the ruble’s performance serves as a case study in how traditional currency markets can be influenced by centralized control measures. This situation may accelerate the adoption of decentralized financial alternatives.

  • Bitcoin Price Eyes 170% Rally After Golden Cross Pattern Forms

    Bitcoin Price Eyes 170% Rally After Golden Cross Pattern Forms

    Bitcoin continues to demonstrate remarkable resilience above the $100,000 level, with technical indicators suggesting a potential surge of up to 170% in the coming months. This analysis comes as the market tests key resistance levels near $110,000, setting up what could be a historic price movement.

    Golden Cross Formation Signals Major Upside Potential

    Crypto analyst Doctor Profit has identified a rare Golden Cross pattern on Bitcoin’s chart, historically a precursor to significant price rallies. The pattern, which emerged three weeks ago, typically initiates with a 10% correction – precisely what occurred when BTC dropped from $111,900 to $100,000. With this correction phase complete, historical data suggests the stage is set for substantial gains.

    Technical Analysis Supports Bullish Outlook

    The formation of a diagonal resistance level adds another layer to the bullish thesis. A breakthrough above this level could propel Bitcoin beyond $108,000, establishing new support levels for the next phase of growth. Recent on-chain metrics further support this potential upward movement, with accumulation patterns showing increased conviction among long-term holders.

    SPONSORED

    Maximize your trading potential with up to 100x leverage on perpetual contracts

    Trade Now on Defx

    Macro Economic Factors Align

    The upcoming CPI data release could act as a catalyst for the next move higher. While Wall Street expects a 2.5% figure, predictions of a lower 2.1-2.3% range could trigger increased risk appetite across markets. Additionally, the current negative funding rate suggests an oversold market condition, historically a precursor to strong rebounds.

    Price Targets and Market Outlook

    Initial resistance levels lie between $108,000-$110,000, but the Golden Cross pattern suggests potential gains of 70-170% in the coming months. This aligns with broader market predictions of a $200,000 Bitcoin price target, which some analysts now consider conservative.

    FAQ Section

    • What is a Golden Cross pattern?
      A Golden Cross occurs when a short-term moving average crosses above a long-term moving average, typically signaling a strong bullish trend.
    • How reliable are Golden Cross signals?
      Historically, Golden Cross patterns in Bitcoin have led to significant price appreciation 80% of the time.
    • What could prevent this rally from materializing?
      Key risks include unexpected regulatory changes, macro economic shocks, or significant institutional selling pressure.
  • Bitcoin Surges Past $108K as US-China Trade Talks Spark Market Rally

    Bitcoin (BTC) demonstrated its growing strength as a macro-economic hedge, surging past $108,000 amid crucial US-China trade negotiations. The leading cryptocurrency gained 2% on Monday, touching $108,900 as investors responded positively to diplomatic developments between the world’s largest economies.

    Trade Talks Drive Bitcoin’s Price Movement

    After consolidating between $100,000 and $106,000 for the past week, Bitcoin’s breakthrough comes as US-China trade discussions impact the broader market. Treasury Secretary Scott Bessent and Chinese Vice Premier He Lifeng are leading critical negotiations in London, addressing tensions that have significantly influenced crypto market sentiment.

    SPONSORED

    Maximize your trading potential with up to 100x leverage on perpetual contracts

    Trade Now on Defx

    Market Impact and Price Analysis

    The recent price action has been particularly noteworthy, with Bitcoin approaching its previous all-time high of $111,800. The cryptocurrency’s resilience in the face of geopolitical tensions has strengthened its position as a strategic investment asset.

    Institutional Adoption Accelerates

    Beyond geopolitical factors, institutional involvement continues to drive market momentum. The cryptocurrency sector witnessed significant developments in the traditional finance space, with Circle’s successful NYSE debut and Gemini’s IPO filing highlighting growing mainstream acceptance.

    Expert Analysis and Future Outlook

    David Siemer, CEO of Wave Digital Assets, provides an optimistic outlook: “While the IPO excitement may be short-lived, the long-term positioning of institutional investors suggests a bullish outlook for Bitcoin’s performance through 2025.” This sentiment aligns with broader market projections targeting $200,000 as a conservative estimate.

    Technical Indicators and Trading Data

    • Current Price: $108,670
    • Monthly Gains: 6%
    • Distance from ATH: 2.7%
    • Previous Support Level: $100,000
    • Key Resistance: $111,800

    FAQ Section

    What caused Bitcoin’s latest price surge?

    The surge was primarily driven by optimism surrounding US-China trade negotiations and increased institutional adoption through IPO activities in the crypto sector.

    Will Bitcoin reach new all-time highs in 2025?

    Market analysts remain bullish, with institutional positioning and technical indicators suggesting potential for new highs, though investors should maintain cautious optimism.

    How do geopolitical events affect Bitcoin’s price?

    Bitcoin has shown increasing correlation with macro-economic events, particularly responding to international trade relations and monetary policy decisions.

  • Solana Price Eyes $164 Breakout: Triangle Pattern Signals 6% Rally

    Solana Price Eyes $164 Breakout: Triangle Pattern Signals 6% Rally

    Solana (SOL) has broken out of a key technical formation, suggesting an imminent rally to $164 as multiple analysts point to strengthening market fundamentals. The altcoin’s recent price action comes amid broader recovery signals in the crypto market, with SOL showing particular resilience after bouncing from local support levels.

    Technical Breakout Sets Stage for SOL Recovery

    After experiencing an 11% correction last week that pushed prices below $160, SOL has staged an impressive comeback, surging 2.45% over the past seven days. The recovery gained momentum after prices found strong support at $140, leading to the formation of a bullish ascending triangle pattern that crypto analyst Ali Martinez suggests could propel prices 6% higher.

    The breakout from this triangle formation occurred on Monday as SOL reclaimed the critical $155 level, setting up a potential move to $164. This price target represents a key resistance zone that hasn’t been tested in the past two weeks.

    SPONSORED

    Trade Solana with up to 100x leverage on perpetual contracts

    Trade Now on Defx

    Multiple Price Targets Paint Bullish Picture

    Beyond the immediate $164 target, analysts have identified several key resistance levels that could come into play. Crypto trader CW notes that a breakthrough above $160 could trigger rapid momentum toward $180, while market watcher Jeremy sees potential for SOL to reach $300 in the coming months, provided global market conditions remain stable.

    This bullish outlook aligns with recent institutional developments, including the Solana ETF listing on Nasdaq that sparked a $46M layer-2 investment rush, highlighting growing institutional interest in the ecosystem.

    Technical Patterns Support Upward Trajectory

    Adding weight to the bullish case, crypto trader Coinvo has identified a potentially significant megaphone pattern that’s been developing over the past 18 months. The pattern suggests SOL could be preparing for a major move toward previous all-time highs, with the fourth wave recently bouncing from the formation’s lower boundary during April’s pullback.

    Key Support and Resistance Levels to Watch

    • Immediate Resistance: $164
    • Secondary Resistance: $180
    • Major Resistance: $200
    • Current Support: $150
    • Critical Support: $142
    • Emergency Support: $135

    FAQ Section

    Q: What is the immediate price target for Solana?
    A: The immediate target is $164, based on the ascending triangle breakout pattern.

    Q: What could prevent SOL from reaching these targets?
    A: Global market instability, increased selling pressure above $160, or broader crypto market corrections could impede the projected rally.

    Q: What’s the significance of the $180 level?
    A: $180 represents a major resistance level that SOL hasn’t been able to break despite reaching $187 in recent rallies.

    As of this writing, Solana trades at $156, showing a 1.88% increase over the past 24 hours. The recent technical breakout, combined with strong fundamental factors and institutional interest, suggests SOL could be positioning for significant upside potential in the coming weeks.