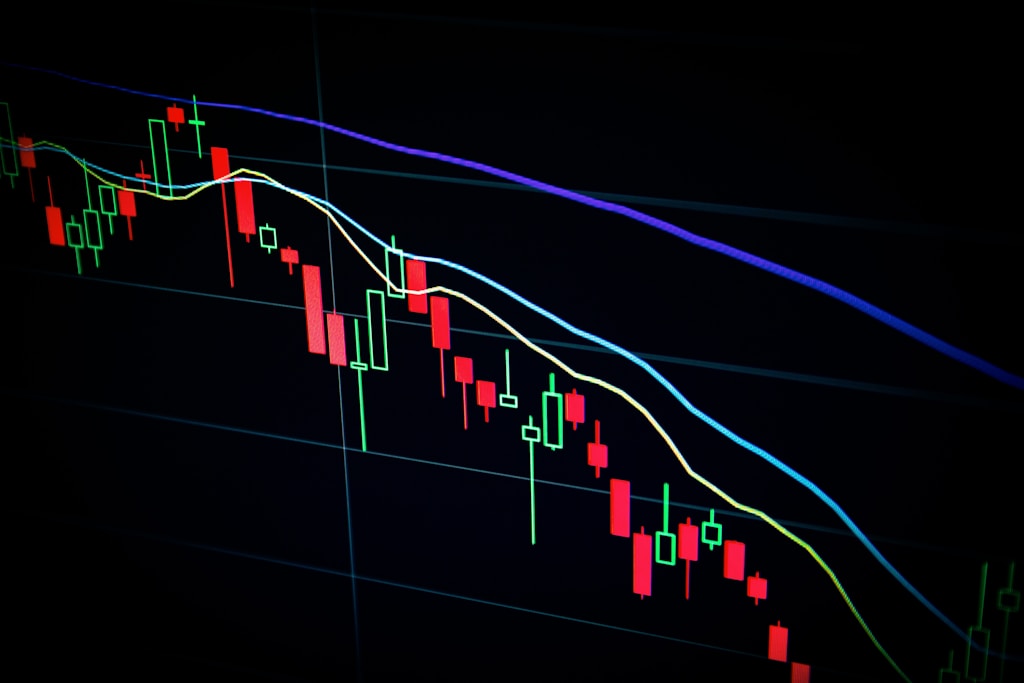
Tag: Market Analysis

  • Ethereum Whale Dumps $22M After 9 Years: Historic ETH Holder Exits at $1,412

    Ethereum Whale Dumps $22M After 9 Years: Historic ETH Holder Exits at $1,412

    A long-term Ethereum whale has made waves in the crypto market by liquidating $22 million worth of ETH holdings originally acquired in 2016, marking one of the most significant early-investor exits of 2025. The dramatic sell-off coincides with Ethereum’s recent price crash to two-year lows, raising questions about potential further downside.

    Analysis of the Whale’s Trading Pattern

    On-chain data reveals a methodical exit strategy by the whale wallet (0x0f520e011280a6685b992d21da2138857391a387), who executed the following trades:

    • 14,015 ETH converted to $22M USDC via Uniswap (15-hour period)
    • Previous sales of 6,630 ETH in May 2022
    • 4,035 ETH liquidated in June 2023
    • Remaining balance: 521 ETH ($830,000)

    Market Impact and Price Action

    The timing of this massive sell-off coincides with Ethereum’s decline from its recent cycle high of $4,000 in December to the current support level. However, ETH has shown signs of recovery, with:

    • 8.2% price increase in 24 hours to $1,598
    • 25% surge in trading volume to $33 billion
    • Market optimism following Trump’s tariff pause announcement

    SPONSORED

    Trade Ethereum with up to 100x leverage and maximize your profit potential

    Trade Now on Defx

    Historical Context and ROI Analysis

    The whale’s initial entry price of approximately $8 in 2016 represents an impressive return on investment:

    • Entry Price: $8 (2016)
    • Exit Price: ~$1,570 (average)
    • ROI: 19,525%
    • Holding Period: 9 years

    Expert Analysis and Market Implications

    Market analysts suggest this whale’s exit could signal broader concerns about Ethereum’s short-term price trajectory. The systematic selling during market dips indicates a possible loss of confidence in ETH’s ability to maintain higher price levels.

    FAQ Section

    What triggered the whale’s decision to sell?

    The sale coincided with ETH hitting a two-year low and significant market volatility, suggesting the whale may have lost confidence in near-term price recovery.

    Could this impact ETH’s price further?

    While significant, the sale has been absorbed by the market, with ETH showing resilience through an 8.2% recovery.

    What does this mean for other long-term holders?

    The sale represents an individual decision rather than a broader trend, though it may influence sentiment among other early investors.

  • Yuan Crisis: China Orders Banks to Halt Dollar Purchases Amid Record Lows

    Yuan Crisis: China Orders Banks to Halt Dollar Purchases Amid Record Lows

    Key Takeaways:

    • Chinese state banks instructed to curb USD purchases
    • Yuan hits multi-year low against dollar amid tariff tensions
    • Measures aim to prevent currency speculation and stabilize markets

    China has taken dramatic steps to defend its weakening currency, as state authorities have informally directed banks to restrict their dollar purchases. This move comes as the yuan hits concerning multi-year lows, highlighting escalating pressures in the ongoing tariff conflict. Recent calls for increased China tariffs have intensified market volatility.

    SPONSORED

    Trade with confidence during market volatility

    Trade Now on Defx

    Understanding China’s Currency Defense Strategy

    The People’s Bank of China’s latest directive represents a significant intervention in currency markets. State-owned banks have been instructed to limit their dollar purchases and implement stricter controls on customer foreign exchange transactions. This policy aims to curb speculation and stabilize the yuan’s value.

    Market Impact and Global Implications

    The yuan’s weakness has significant implications for global markets and crypto assets. Bitcoin’s recent price movements have shown sensitivity to these currency market developments, as investors seek alternative stores of value during periods of fiat currency instability.

    FAQ Section

    How does yuan weakness affect crypto markets?

    Currency instability often drives investors toward crypto assets as hedge against fiat volatility.

    What are the implications for global trade?

    Weakening yuan could escalate trade tensions and impact international commerce flows.

    How long might these restrictions last?

    Previous similar measures have typically remained in place until currency stability returns.

  • XRP Price Forms Bullish Pattern: Technical Analysis Points to $3.30 Target

    XRP Price Forms Bullish Pattern: Technical Analysis Points to $3.30 Target

    The XRP price is showing signs of a potential major reversal after forming a rounded bottom pattern within a descending channel. This technical development comes amid significant market volatility that has seen XRP lose nearly 50% of its value between late 2024 and early 2025. Recent data showing XRP’s realized cap plunging 50% adds crucial context to this price action.

    Technical Analysis Reveals Promising Formation

    A prominent crypto analyst on X (formerly Twitter) has identified a significant technical pattern that could signal an end to XRP’s recent downtrend. The cryptocurrency is currently trading within a descending channel, typically considered a bearish formation. However, the emergence of a rounded bottom pattern within this channel suggests a potential trend reversal.

    SPONSORED

    Trade XRP with up to 100x leverage on perpetual contracts

    Trade Now on Defx

    Key Support and Resistance Levels

    The analysis highlights several critical price levels:

    • Current support: $1.60
    • Optimal entry zone: $1.70-$1.85
    • Initial resistance: $2.00-$2.20
    • Target levels: $2.3385, $2.8160, and $3.3062

    Potential Risks and Bearish Scenario

    While the overall outlook appears bullish, investors should remain cautious of potential downside risks. Recent market turbulence has already pushed XRP below the $2 mark, highlighting the importance of proper risk management. The critical support at $1.60 must hold to prevent a deeper correction toward $1.30.

    FAQ Section

    What is a rounded bottom pattern?

    A rounded bottom pattern is a technical chart formation that signals a potential trend reversal from bearish to bullish, characterized by a U-shaped price movement.

    What are the key resistance levels for XRP?

    The main resistance levels to watch are $2.00-$2.20, followed by $2.3385, $2.8160, and $3.3062.

    What could invalidate this bullish setup?

    A break below the critical support level at $1.60 could invalidate the bullish scenario and potentially trigger a decline toward $1.30.

  • Solana (SOL) Tests $120 Resistance: Key Levels Signal 16% Upside

    Solana (SOL) Tests $120 Resistance: Key Levels Signal 16% Upside

    Solana (SOL) has initiated a significant upward movement, surging from the $100 support zone and challenging the critical $120 resistance level. This price action comes amid broader crypto market momentum, with SOL demonstrating particular strength in its technical indicators.

    SOL Price Action Analysis: Breaking Down the Rally

    In a notable development that aligns with recent market-wide gains triggered by Trump’s tariff pause, Solana has established a strong foundation above the $100 support level. The cryptocurrency has shown impressive momentum, breaking through several key resistance levels:

    • Initial breakout above $105 and $112 resistance zones
    • Successful breach of the bearish trend line at $107
    • Current consolidation near the crucial $120 resistance

    SPONSORED

    Trade Solana with up to 100x leverage on perpetual contracts

    Trade Now on Defx

    Technical Indicators and Price Targets

    The technical landscape for Solana presents a compelling case for continued upward momentum:

    • RSI maintains position above 50, indicating sustained bullish momentum
    • MACD shows positive divergence despite slight weakening in the bullish zone
    • 100-hourly simple moving average provides strong support at $105

    Key Support and Resistance Levels

    Support Levels Resistance Levels
    $112 $118
    $110 $120
    $105 $125
    $100 $132

    Potential Scenarios and Trading Implications

    Two primary scenarios emerge from current market conditions:

    Bullish Scenario

    A successful break above $120 could trigger a rally toward $125, with potential extension to $132 and $140. This represents a possible 16% upside from current levels.

    Bearish Scenario

    Failure to breach $120 might lead to a retest of $112 and potentially $110 support levels. The critical $100 support remains the major defensive line for bulls.

    Frequently Asked Questions

    What is driving Solana’s current price movement?

    The recent surge aligns with broader market recovery and improved technical indicators, particularly following the break above the bearish trend line at $107.

    What are the key levels to watch for SOL traders?

    The immediate focus is on the $120 resistance, with $125 and $132 as subsequent targets. Support levels at $112 and $110 are crucial for maintaining bullish momentum.

    Could SOL reach $140 in the near term?

    Technical analysis suggests $140 is achievable if SOL maintains momentum above $120 and successfully consolidates above $125.

  • Bitcoin Price Dips 9% to $76K as Global Tariff War Intensifies

    Bitcoin’s price has taken a significant hit amid escalating global trade tensions, dropping 9.1% over the past week as markets react to unprecedented tariff increases. The leading cryptocurrency is showing signs of weakness as the broader financial markets grapple with mounting economic uncertainty.

    In a dramatic escalation of trade tensions, President Trump’s implementation of a blanket 10% tariff has triggered retaliatory measures from China, sending shockwaves through both traditional and crypto markets. The immediate impact saw Bitcoin retreat from $87,100 to approximately $76,000.

    Market Impact and Technical Analysis

    The cryptocurrency market’s reaction has been swift and decisive, with Bitcoin’s price movement closely correlating with traditional market indicators. The probability of a global recession has spiked to 68%, while the Dow Jones Industrial Average has experienced a sharp 9.8% decline over five days.

    However, prominent analyst CryptoGoos suggests that the current dip may present a buying opportunity, noting that significant corrections are typical during bull markets. This perspective is supported by on-chain data showing unprecedented accumulation by crypto whales.

    SPONSORED

    Trade Bitcoin with up to 100x leverage on perpetual contracts

    Trade Now on Defx

    Expert Predictions and Support Levels

    Technical analysts are closely monitoring two critical support levels:

    • 50-week SMA near $73,000
    • 2-year rising trendline at $65,000

    Despite the bearish pressure, recent technical analysis suggests strong support at the $77K level, which could provide a foundation for recovery once market conditions stabilize.

    Looking Ahead: Market Outlook

    While short-term volatility remains a concern, institutional interest continues to provide underlying support for Bitcoin. A recent Binance Research report highlights the asset’s resilience despite mounting macroeconomic pressures.

    Frequently Asked Questions

    Q: How long could this dip last?
    A: Historical data suggests similar corrections during bull markets typically last 2-3 weeks.

    Q: What are the key levels to watch?
    A: Primary support levels are at $73,000 and $65,000, with resistance at $83,500.

    Q: How does this compare to previous market corrections?
    A: The current 9.1% drop is relatively modest compared to historical bull market corrections, which have averaged 15-20%.

  • Bitcoin Price Tests Critical $77K Support as Tariff Tensions Mount

    Bitcoin’s price action has entered a critical phase amid escalating global trade tensions, with the leading cryptocurrency testing a key support level at $77,000. Recent developments in the global trade war have sent shockwaves through crypto markets, triggering significant liquidations and heightened volatility.

    2-Year Realized Price: A Critical Support Level

    According to CryptoQuant analyst Onchained, Bitcoin is approaching a crucial threshold at its 2-Year Realized Price, a metric that has historically served as a reliable indicator of market sentiment and potential trend reversals. This on-chain metric, which calculates the average acquisition cost of coins moved within the past two years, has maintained support since October 2023.

    The convergence of spot prices with this key metric comes as Trump’s tariff policies continue to impact global markets, creating increased uncertainty across both traditional and crypto assets.

    SPONSORED

    Trade with confidence using up to 100x leverage on perpetual contracts

    Trade Now on Defx

    Record Liquidations Signal Market Stress

    The market witnessed its largest Bitcoin long liquidation event of the current bull cycle on April 6, with approximately 7,500 BTC in long positions being forcefully closed. This event, coinciding with heightened trade policy uncertainty, underscores the increasing correlation between macro events and crypto market dynamics.

    Expert Analysis and Market Outlook

    CryptoQuant analyst Darkfost emphasizes the importance of risk management during this period of elevated volatility: ‘This is a clear reminder that we need to stay cautious during periods of rising volatility like today. This is the time to care and preserve your capital.’

    FAQ Section

    What is the 2-Year Realized Price?

    The 2-Year Realized Price is an on-chain metric that calculates the average price of all Bitcoin moved on the blockchain within the last two years, serving as a key indicator of market value and potential support/resistance levels.

    How do tariffs affect Bitcoin price?

    Tariffs can impact Bitcoin price through increased market uncertainty, changes in capital flows, and shifts in investor risk appetite across global markets.

    What caused the recent liquidation event?

    The recent liquidation event was triggered by a combination of factors including escalating trade tensions, market uncertainty, and overleveraged positions in the derivatives market.

  • XRP Price Targets $2.00: Technical Analysis Signals Bullish Breakout

    XRP’s price action is showing strong bullish momentum as the digital asset eyes a critical breakout above the $2.00 resistance level. Recent technical analysis reveals multiple indicators supporting potential upside, with key support levels providing a foundation for further gains.

    As XRP’s network activity reaches record levels with 6.26M active wallets, the price action suggests growing market confidence. The asset has maintained steady support above $1.750, demonstrating resilience in current market conditions.

    Key Technical Indicators Signal Bullish Momentum

    • Price trading above $1.90 and 100-hourly SMA
    • Breakout above bearish trend line at $1.8650
    • RSI maintaining position above 50, indicating bullish control
    • MACD showing positive momentum despite slight deceleration

    SPONSORED

    Trade XRP with up to 100x leverage on perpetual contracts

    Trade Now on Defx

    Critical Price Levels to Watch

    Support Zones:

    • Primary support: $1.9750
    • Secondary support: $1.90
    • Critical floor: $1.80

    Resistance Levels:

    • Immediate resistance: $2.00
    • Secondary target: $2.0880
    • Extended target: $2.320

    Market Analysis and Future Outlook

    The current price action suggests XRP is positioning for a significant move above $2.00. The recent break above the bearish trend line at $1.8650 indicates growing buying pressure, while the maintenance of higher lows supports the bullish narrative.

    FAQ

    Q: What are the key resistance levels for XRP?
    A: The immediate resistance lies at $2.00, followed by $2.0880 and $2.320.

    Q: Where is the critical support level?
    A: The primary support zone is at $1.9750, with secondary support at $1.90.

    Q: What technical indicators support the bullish case?
    A: The RSI above 50, price above 100-hourly SMA, and broken bearish trend line all support bullish momentum.

  • Bitcoin Ownership Shifts: Long-Term Holders Absorb $10B Sell-Off

    Bitcoin Ownership Shifts: Long-Term Holders Absorb $10B Sell-Off

    Bitcoin’s recent price correction to $76,899 has triggered a significant shift in ownership patterns, with on-chain data revealing a massive $10 billion transfer from short-term to long-term holders. This structural change could signal a potential market bottom, according to latest analysis.

    The leading cryptocurrency has experienced a substantial 29.4% decline from its January all-time high above $109,000. Recent market turbulence linked to Trump’s tariff policies has contributed to sustained selling pressure, particularly among newer market participants.

    Short-Term Holders Record Historic Capitulation

    CryptoQuant data shows Short-Term Holders (STH) experiencing their largest single-day realized loss of the current cycle on April 7, with their realized cap dropping by $10 billion. This dramatic decline represents a significant capitulation event among recent market entrants.

    SPONSORED

    Trade Bitcoin with up to 100x leverage and maximize your profit potential

    Trade Now on Defx

    Long-Term Holders Display Strong Conviction

    Notably, Long-Term Holders (LTH) have absorbed nearly the entire sell-off, increasing their realized cap by $9.7 billion. This behavior demonstrates strong conviction among experienced investors who view current price levels as attractive entry points.

    Market Structure Analysis

    The transition of assets from short-term to long-term holders typically occurs near market bottoms or early recovery phases. Historical data suggests that such ownership shifts often precede sustained price recoveries.

    FAQ Section

    What does this ownership shift mean for Bitcoin’s price?

    Historical patterns suggest that large-scale transfers from short-term to long-term holders often precede market recoveries, though past performance doesn’t guarantee future results.

    How significant is the $10 billion capitulation?

    This represents the largest single-day realized loss for short-term holders in the current market cycle, indicating a potential exhaustion of selling pressure.

    What defines a long-term holder?

    Generally, addresses holding Bitcoin for more than 155 days are classified as long-term holders in on-chain analysis.

    As the market digests this significant ownership restructuring, investors should monitor for further signs of accumulation by long-term holders and potential price stabilization signals.

  • Ethereum Price Surges 15% as Trump’s Tariff Pause Ignites Crypto Rally

    Ethereum (ETH) has experienced a remarkable 15% surge, breaking above the critical $1,600 level as cryptocurrency markets respond to Trump’s unexpected tariff pause announcement. This price action mirrors the broader crypto market rally, with Bitcoin also soaring past $83K in response to the trade war de-escalation.

    Technical Analysis: ETH’s Bullish Breakout

    After establishing strong support at $1,380, Ethereum’s price action has shown impressive momentum, breaking through multiple resistance levels:

    • Cleared the bearish trend line at $1,470
    • Surpassed both $1,550 and $1,600 resistance zones
    • Currently trading above the 100-hourly Simple Moving Average
    • Formed a new local high at $1,687

    Key Price Levels to Watch

    For traders and investors monitoring Ethereum’s movement, several critical price levels demand attention:

    Resistance Levels:

    • Immediate resistance: $1,650
    • Major resistance: $1,720
    • Extended targets: $1,850-1,880 zone

    Support Levels:

    • Primary support: $1,615
    • Secondary support: $1,580
    • Critical support: $1,535

    SPONSORED

    Trade ETH with up to 100x leverage on perpetual contracts

    Trade Now on Defx

    Market Indicators Signal Strong Momentum

    Technical indicators are painting a bullish picture for Ethereum:

    • MACD: Showing increasing momentum in the bullish zone
    • RSI: Trading above 50, indicating healthy buying pressure
    • Fibonacci retracement: Price holding above 23.6% level

    Potential Scenarios and Risk Analysis

    While the current trend appears strongly bullish, traders should consider potential scenarios:

    Bullish Case:

    • Break above $1,720 could trigger rally to $1,850
    • Sustained trading above $1,650 supports continued upward momentum
    • Volume profile suggests strong buyer interest at current levels

    Bearish Case:

    • Failure to hold $1,650 might trigger correction to $1,580
    • Break below $1,535 could signal deeper retracement
    • Watch for potential divergence in momentum indicators

    FAQ

    What caused Ethereum’s recent price surge?

    The primary catalyst appears to be Trump’s announcement of a 90-day tariff pause, which has positively impacted global markets, including cryptocurrencies.

    Will Ethereum maintain its current momentum?

    Technical indicators suggest strong bullish momentum, but traders should monitor key resistance levels and global market conditions for confirmation.

    What are the key support levels to watch?

    The most important support levels are $1,615, $1,580, and $1,535, with the latter being crucial for maintaining the current uptrend.

  • Bitcoin Surges Past $83K as Trump’s Tariff Pause Sparks Rally

    Bitcoin’s price has surged above $83,000 in a dramatic market rally following Trump’s announcement of a global tariff pause. The leading cryptocurrency demonstrated remarkable strength, breaking through multiple resistance levels and signaling renewed bullish momentum.

    In a significant development that ties directly to Trump’s recent announcement of a 90-day global tariff pause, Bitcoin has shown impressive price action, climbing from $74,500 to establish new local highs.

    Technical Analysis Reveals Strong Momentum

    The current price action shows several bullish indicators:

    • Break above key bearish trend line at $78,800
    • Trading well above the 100-hour Simple Moving Average
    • RSI readings above 50, indicating strong momentum
    • MACD showing increasing bullish momentum

    Key Price Levels to Watch

    Critical support and resistance levels have emerged:

    Support Levels Resistance Levels
    $81,400 $83,500
    $80,500 $84,500
    $79,500 $85,800

    SPONSORED

    Trade Bitcoin with up to 100x leverage on perpetual contracts

    Trade Now on Defx

    Market Impact and Future Outlook

    The recent price surge coincides with increasing institutional interest in digital assets, suggesting sustained momentum could push Bitcoin toward the $88,000 level. However, traders should remain cautious of potential retracements to key support levels.

    Frequently Asked Questions

    What caused Bitcoin’s recent price surge?

    The primary catalyst was Trump’s announcement of a global tariff pause, which reduced market uncertainty and encouraged risk-on sentiment.

    What are the key resistance levels to watch?

    The immediate resistance levels are $83,500 and $84,500, with $85,800 serving as a major psychological barrier.

    Is this rally sustainable?

    Technical indicators and institutional interest suggest strong momentum, but traders should monitor support levels for potential consolidation.