Tag: Market Analysis

  • US Financial Crisis Warning: Former Treasury Chief Signals Crypto Safe Haven

    US Financial Crisis Warning: Former Treasury Chief Signals Crypto Safe Haven

    Former U.S. Treasury Secretary Lawrence Summers has issued a stark warning about an impending financial crisis, potentially positioning cryptocurrencies as a hedge against traditional market turmoil. As trade war tensions continue to impact traditional markets, the cryptocurrency sector may emerge as a beneficiary of this economic uncertainty.

    Key Takeaways:

    • Former Treasury Secretary Summers warns of “serious financial crisis” ahead
    • Escalating tariffs identified as primary catalyst for potential economic downturn
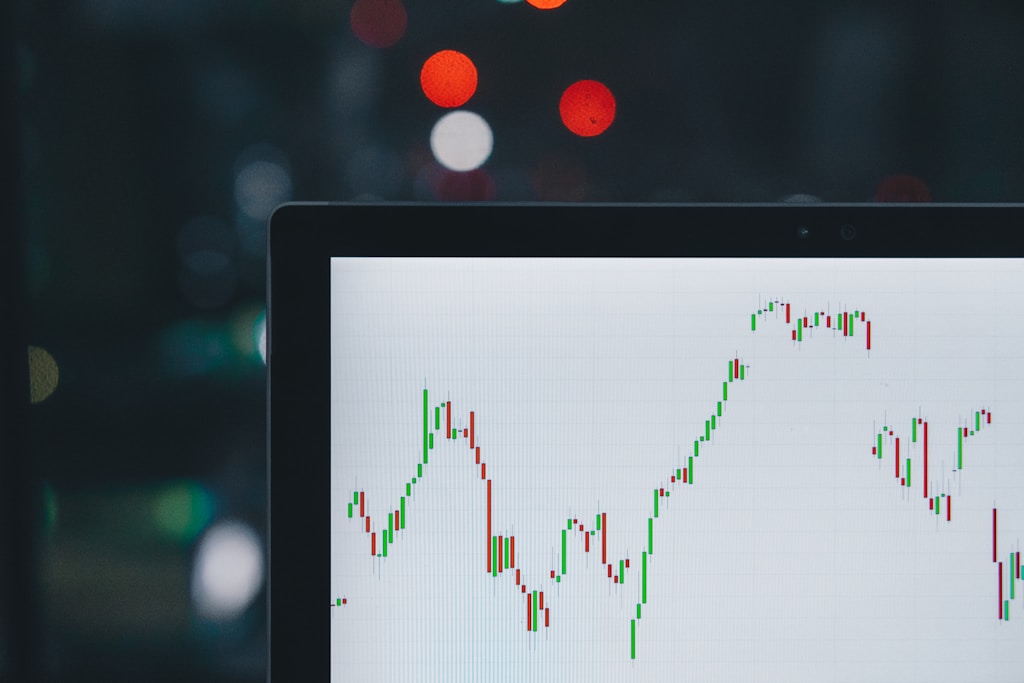
    • Crypto markets showing resilience amid traditional market uncertainty
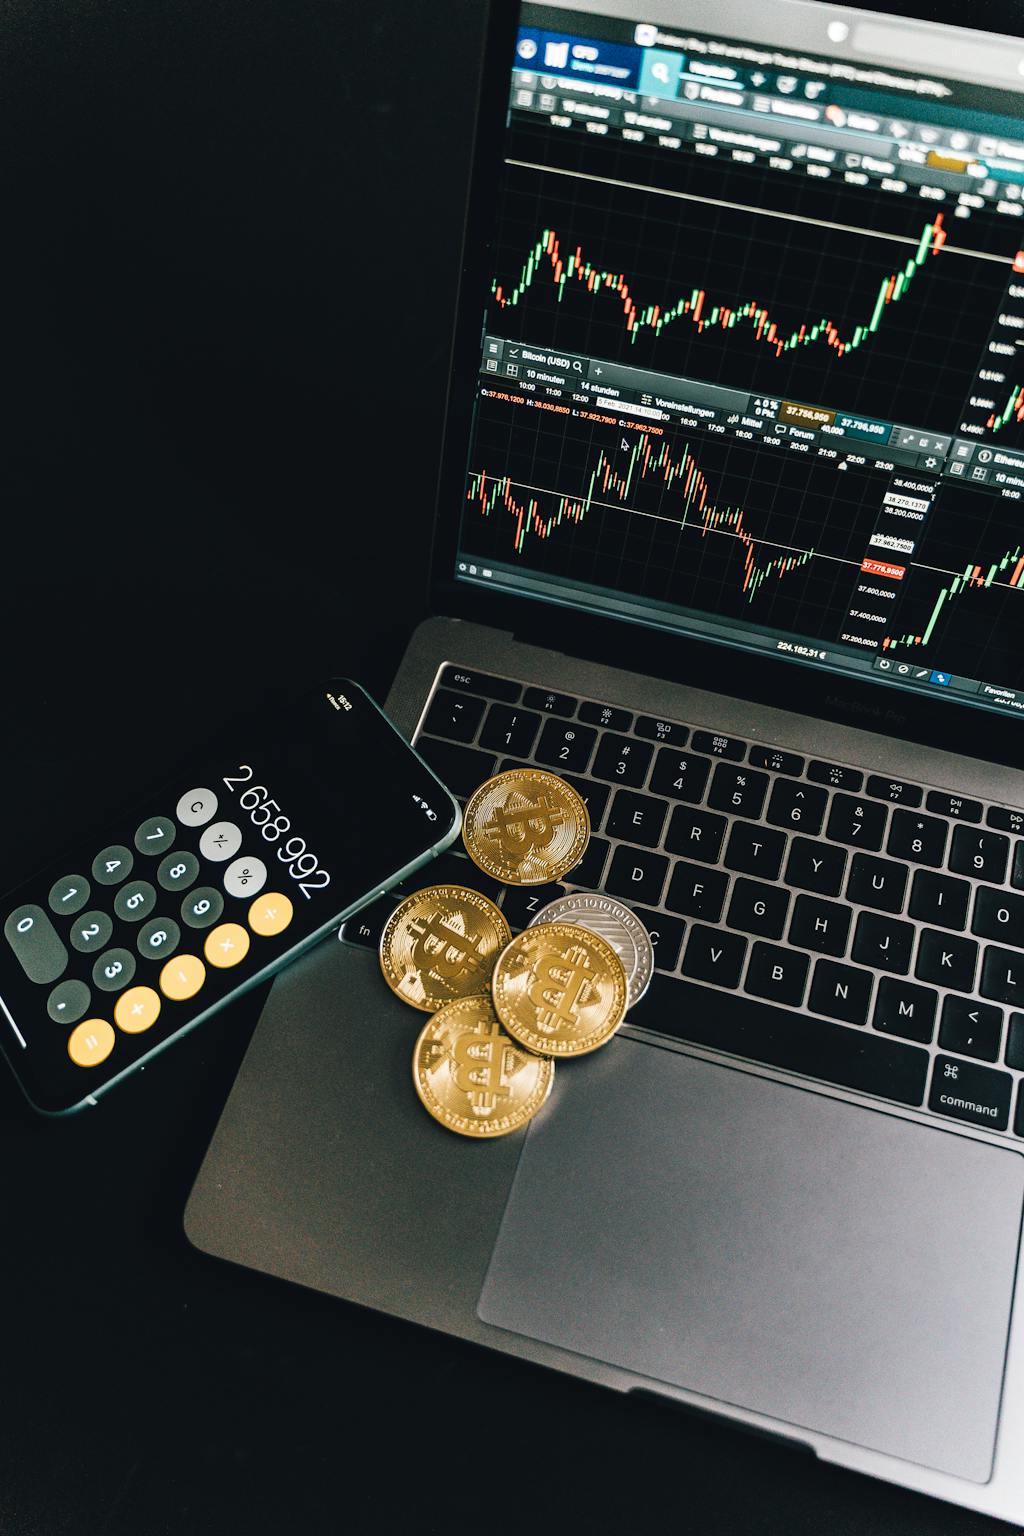
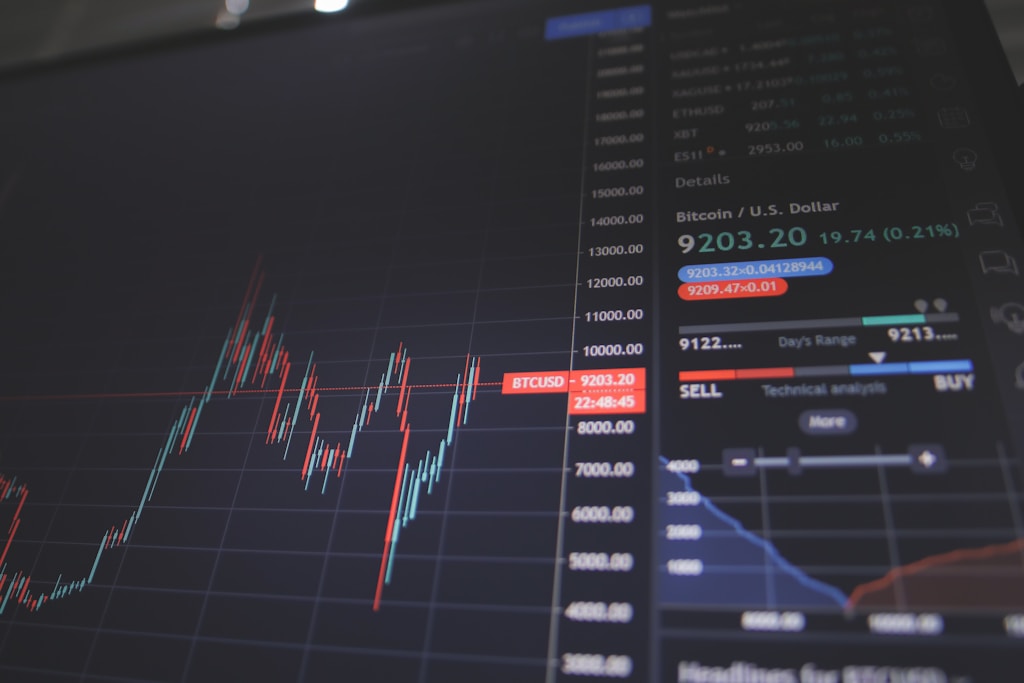
    • Bitcoin and other digital assets potentially positioned as safe-haven assets

    Understanding the Crisis Warning

    Summers’ warning comes at a critical juncture for the U.S. economy, with escalating trade tensions threatening global economic stability. The former Treasury chief specifically highlighted how current trade policies could trigger a cascade of negative economic effects.

    Cryptocurrency Market Response

    As traditional markets grapple with uncertainty, the crypto sector has shown remarkable resilience. Institutional investors are increasingly turning to digital assets, with 87% planning to increase their cryptocurrency holdings in 2025.

    SPONSORED

    Protect your portfolio with up to 100x leverage on perpetual contracts

    Trade Now on Defx

    Expert Analysis and Market Implications

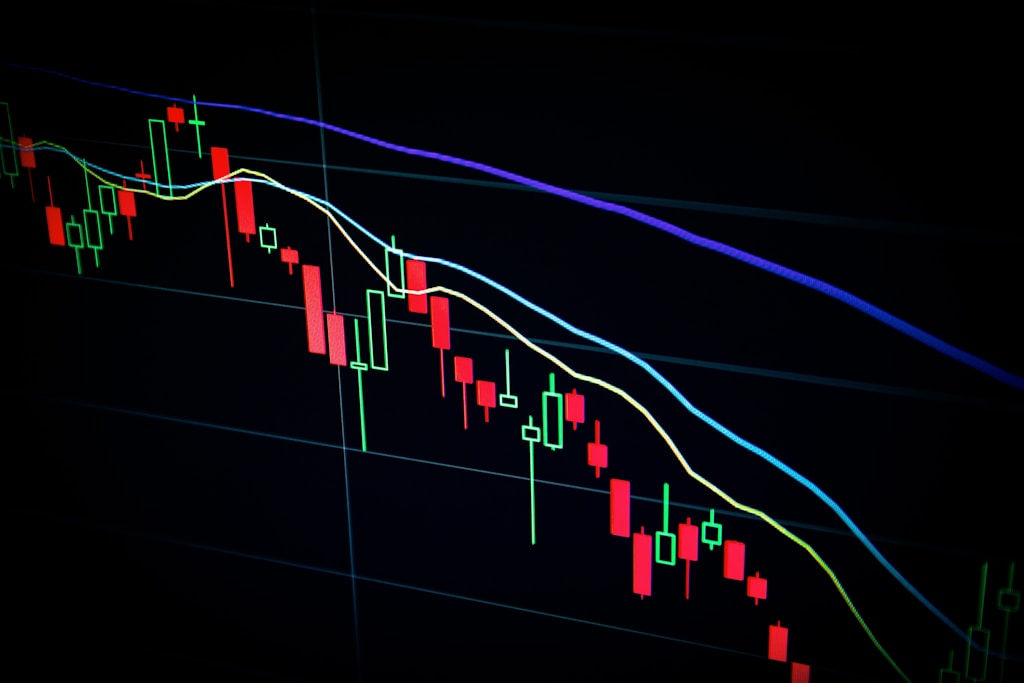
    Financial experts suggest that the current economic climate could accelerate cryptocurrency adoption as a hedge against traditional market volatility. The combination of rising inflation fears and trade tensions creates an environment where digital assets might thrive.

    FAQ Section

    How might a U.S. financial crisis affect cryptocurrency markets?

    Historical data suggests that cryptocurrencies often perform independently of traditional markets during periods of economic stress, potentially serving as a hedge against financial instability.

    What role do tariffs play in the potential crisis?

    Escalating tariffs can disrupt global trade flows, increase consumer prices, and potentially trigger a chain reaction of economic consequences that could lead to a broader financial crisis.

    How can investors prepare for the potential crisis?

    Experts recommend portfolio diversification, including consideration of digital assets as part of a balanced investment strategy.

  • Bitcoin Price Warning: LMACD Signal Could Invalidate $77K Bear Setup

    Bitcoin Price Warning: LMACD Signal Could Invalidate $77K Bear Setup

    Bitcoin’s price action has taken a bearish turn after failing to maintain the crucial $100,000 level, with the leading cryptocurrency now trading between $75,000-$79,000. However, a key technical indicator suggests there may still be hope for the bulls. Recent analysis had warned of a potential drop to $52K, but new data presents a possible counter scenario.

    Critical LMACD Crossover Could Determine Bitcoin’s Next Major Move

    Renowned crypto analyst Tony “The Bull” Severino has identified a crucial technical development that could invalidate the current bearish momentum. The focal point is Bitcoin’s 1-month LMACD (Logarithmic Moving Average Convergence Divergence) indicator, which is approaching a significant bearish crossover.

    This technical event gains additional significance as broader market pressures continue to mount amid ongoing trade tensions, affecting both crypto and traditional markets.

    SPONSORED

    Trade Bitcoin with up to 100x leverage on perpetual contracts

    Trade Now on Defx

    Technical Analysis Breakdown

    The LMACD indicator currently shows:

    • Blue line approaching crossover beneath orange signal line
    • First potential bearish momentum shift since July 2023
    • Correlation with traditional market indicators including S&P 500 and Nasdaq

    Market Implications and Trading Opportunities

    Despite the bearish setup, several factors suggest potential for reversal:

    • Current oversold conditions create potential for dramatic bounce
    • Window remains open for bulls to prevent bearish confirmation
    • Strong upward move could invalidate the entire bearish structure

    FAQ Section

    What is the LMACD indicator?

    The Logarithmic Moving Average Convergence Divergence (LMACD) is a technical indicator that tracks market momentum on a logarithmic scale, particularly useful for Bitcoin’s exponential price movements.

    Why is this crossover significant?

    This would be the first bearish LMACD crossover since July 2023, potentially signaling a major trend shift in Bitcoin’s momentum.

    What could prevent the bearish scenario?

    A strong rally before month-end could prevent the bearish crossover and potentially trigger a larger upward movement.

    At time of writing, Bitcoin trades at $77,260, showing 24-hour and weekly declines of 2.23% and 8.93% respectively.

  • XRP Price Could Flip Bitcoin by September, Analyst Predicts 1,335% Surge

    XRP Price Could Flip Bitcoin by September, Analyst Predicts 1,335% Surge

    The cryptocurrency market is witnessing a potential paradigm shift as XRP shows signs of challenging Bitcoin’s long-held dominance. Following an impressive rally from $0.5 to over $3, XRP’s momentum has caught the attention of analysts who see a possible repeat of its 2017 market cap flip scenario.

    XRP’s Path to Overtaking Bitcoin’s Market Dominance

    TradingView analyst Axel Rodd has identified striking similarities between current market conditions and those preceding XRP’s brief dominance over Bitcoin in late 2017. The analysis comes as technical indicators suggest a potential 94% rally to $3.30, adding credibility to the flip thesis.

    Bitcoin’s market dominance has experienced a dramatic decline from 63% to 15%, signaling what Rodd describes as a “violent shift” in market dynamics. This significant drop typically precedes major altcoin rallies, potentially setting the stage for XRP’s ascendance.

    SPONSORED

    Trade XRP with up to 100x leverage on perpetual contracts

    Trade Now on Defx

    Macroeconomic Catalysts Supporting the Flip Scenario

    The potential market cap flip is further supported by several macroeconomic factors. Trump’s recent policy shifts regarding global tariffs have created market uncertainty that could benefit alternative assets like XRP.

    Market Metrics and Technical Analysis

    Current market metrics reveal:

    • XRP Market Cap: $106.46 billion
    • Bitcoin Market Cap: $1.53 trillion
    • Required Growth for Flip: 1,335%
    • Current XRP Price: $1.82

    Frequently Asked Questions

    What would cause XRP to flip Bitcoin’s market cap?

    A combination of declining Bitcoin dominance, increased institutional adoption, and favorable macroeconomic conditions could drive XRP’s market cap above Bitcoin’s.

    When was the last time XRP nearly flipped Bitcoin?

    XRP briefly approached Bitcoin’s market cap in late 2017 during the height of the crypto bull run.

    What are the key resistance levels to watch?

    Major resistance levels include $2.50, $3.30, and the previous all-time high of $3.84.

    While the prediction may seem ambitious, recent institutional interest in XRP through ETF products suggests growing mainstream acceptance that could support such a dramatic market shift.

  • Crypto Market Soars 9%: Bitcoin Breaks $83K in Major Recovery Rally

    Crypto Market Soars 9%: Bitcoin Breaks $83K in Major Recovery Rally

    The cryptocurrency market staged a dramatic comeback on Wednesday, with total market capitalization surging over 9% as Bitcoin (BTC) breached the $83,000 level. This remarkable recovery follows last week’s steep decline that had analysts warning of a potential drop to $52,000.

    Market Recovery Highlights

    • Total crypto market cap increased by 9% in 24 hours
    • Bitcoin led the recovery with an 8.4% gain
    • Multiple altcoins outperformed BTC’s gains
    • Trading volume surged across major exchanges

    SPONSORED

    Trade Bitcoin with up to 100x leverage and maximize your profit potential

    Trade Now on Defx

    Technical Analysis and Market Sentiment

    The recovery comes as a direct response to recent positive developments in global trade tensions, with market sentiment shifting dramatically positive. Technical indicators suggest strong support at the current levels, with the RSI moving out of oversold territory.

    Institutional Impact

    This rally aligns with recent data showing 87% of institutions plan to increase their crypto holdings in 2025, suggesting strong fundamental support for the current price action.

    FAQ Section

    What caused the crypto market recovery?

    The recovery appears driven by improved global trade conditions, strong institutional interest, and oversold technical conditions.

    Will Bitcoin maintain these price levels?

    Technical indicators and institutional demand suggest strong support at current levels, though volatility should be expected.

    How does this recovery compare to previous rallies?

    This 9% daily gain represents one of the strongest single-day recoveries in 2025, though still below some historical rallies.

  • XRP ETF Launch Defies Bear Market with $5.43M Day One Volume

    XRP ETF Launch Defies Bear Market with $5.43M Day One Volume

    Teucrium’s newly launched 2x XRP ETF (XXRP) has demonstrated remarkable resilience in its NYSE debut, achieving $5.43 million in first-day trading volume despite challenging market conditions. This performance comes as XRP’s realized cap recently experienced a 50% decline, making the ETF’s strong start particularly noteworthy.

    XRP ETF Launch Highlights Market Resilience

    The ETF’s successful launch occurred against a backdrop of significant market headwinds, with XRP prices touching a five-month low of $1.61. Despite this bearish sentiment, Bloomberg Senior ETF Analyst Eric Balchunas praised the performance as “very respectable,” placing XXRP’s debut in the top 5% of all new ETF launches.

    SPONSORED

    Trade XRP with up to 100x leverage on perpetual contracts

    Trade Now on Defx

    Comparative Performance Analysis

    XXRP’s debut volume significantly outperformed Solana’s similar 2x ETF, achieving roughly four times higher trading activity. However, the figure remains modest compared to BlackRock’s Bitcoin ETF launch, which saw approximately 200 times more volume.

    Understanding XXRP’s Mechanics and Risks

    Unlike traditional spot ETFs, XXRP employs a leveraged strategy that aims to deliver twice the daily performance of XRP’s price movements. This structure amplifies both potential gains and losses, introducing significant risk factors that investors must consider.

    Market Impact and Future Outlook

    The launch coincides with broader market volatility, as XRP recently dipped below $2 amid global market pressures. More than 10 asset managers have filed for spot XRP ETF applications, suggesting growing institutional interest despite current market conditions.

    FAQ Section

    Q: How does the 2x XRP ETF work?
    A: The ETF uses financial instruments to deliver twice the daily performance of XRP’s price movements, without directly holding XRP tokens.

    Q: What are the main risks of investing in XXRP?
    A: Key risks include amplified losses due to leverage, volatility decay, and potential tracking errors in relation to XRP’s price.

    Q: How does XXRP compare to spot XRP ETFs?
    A: Unlike spot ETFs that directly hold XRP, XXRP uses derivatives to achieve leveraged exposure to XRP’s price movements.

  • Bitcoin Warning: Strategy May Sell BTC Holdings Amid $6B Q1 Loss

    Bitcoin Warning: Strategy May Sell BTC Holdings Amid $6B Q1 Loss

    Strategy, the software company led by Michael Saylor, has revealed it may need to liquidate some of its massive Bitcoin holdings to meet financial obligations, according to a recent SEC filing. This development comes as analysts warn of potential Bitcoin price volatility in the coming months.

    Strategy’s Q1 2025 Financial Challenges

    The company is facing significant financial pressure with an anticipated unrealized loss of nearly $6 billion for Q1 2025, despite having a $1.7 billion tax benefit. Strategy currently holds an impressive 528,000 BTC purchased at an average price of $67,450 per coin, representing a total investment exceeding $35 billion.

    Mounting Debt and Market Pressures

    Strategy’s financial obligations are substantial:

    • $8 billion in total debt
    • $35 million in annual interest payments
    • $150 million in required annual dividends

    SPONSORED

    Trade Bitcoin with up to 100x leverage and maximize your profit potential

    Trade Now on Defx

    Market Impact and Price Analysis

    Bitcoin currently trades at $76,100, down 8% over the past week. While this remains above Strategy’s average purchase price, recent market volatility and ETF outflows have increased pressure on the company’s position.

    Expert Outlook and Future Prospects

    Despite current challenges, some market experts remain optimistic. BitMEX co-founder Arthur Hayes projects Bitcoin could reach $110,000 in the coming months, citing potential central bank rate cuts as a catalyst for growth.

    FAQ Section

    Will Strategy be forced to sell its Bitcoin?

    While the possibility exists, the company is exploring alternative financing options, including a $2.1 billion preferred stock offering.

    What is Strategy’s average Bitcoin purchase price?

    The company’s average acquisition price is approximately $67,450 per Bitcoin.

    How much debt does Strategy currently have?

    Strategy carries approximately $8 billion in total debt obligations.

  • XRP Price Alert: Technical Indicators Signal Potential 94% Rally to $3.30

    XRP Price Alert: Technical Indicators Signal Potential 94% Rally to $3.30

    XRP’s price action is showing strong signs of a potential breakout, with multiple technical indicators aligning to suggest a major upward move could be imminent. Following Ripple’s recent $1.25B Hidden Road partnership, the technical setup is now painting an increasingly bullish picture for XRP holders.

    Technical Analysis Points to Significant Upside Potential

    The current technical landscape for XRP reveals a compelling convergence of bullish signals:

    • MACD indicator approaching a critical bullish crossover point
    • Regular Bullish Divergence forming on the daily timeframe
    • RSI showing signs of positive momentum buildup
    • Key support level at $1.70 holding strong

    Critical Price Levels to Monitor

    For traders and investors tracking XRP’s movement, these are the crucial price levels to watch:

    Level Type Price Point Significance
    Immediate Resistance $1.97 Primary breakout level
    Secondary Targets $2.64, $2.92 Next resistance zones
    Support Levels $1.70, $1.34 Key downside protection

    SPONSORED

    Trade XRP with up to 100x leverage on perpetual contracts

    Trade Now on Defx

    Expert Analysis and Market Sentiment

    Crypto analyst Javon Marks has identified a significant technical setup that could catalyze XRP’s next major move. The combination of the MACD crossover and bullish divergence suggests accumulation at current levels, potentially setting up for a powerful rally toward the $3.30 target.

    Frequently Asked Questions

    What is triggering XRP’s potential breakout?

    The convergence of technical indicators, including MACD crossover and bullish divergence, combined with strong support at $1.70, suggests mounting buying pressure.

    What is the projected timeframe for the potential rally?

    While exact timing remains uncertain, the technical setup suggests the breakout could occur within the next few weeks, pending volume confirmation.

    What are the key risks to this bullish scenario?

    A failure to break above $1.97 could lead to consolidation or deeper retracement, with support at $1.70 being crucial for maintaining bullish momentum.

    Traders should maintain strict risk management practices and consider the broader market context when making trading decisions. The current technical setup, while promising, requires confirmation through strong volume and a decisive break above key resistance levels.

  • Ethereum Open Interest Plunges 50% on Binance: Bottom Signal Emerges

    Ethereum Open Interest Plunges 50% on Binance: Bottom Signal Emerges

    Ethereum’s derivatives market is showing significant signs of cooling as open interest on Binance has dropped by nearly 50% since December, potentially signaling a major market shift. This dramatic decline comes as ETH price tests critical support levels, raising questions about the altcoin’s near-term trajectory.

    Binance Open Interest Decline Signals Market Caution

    According to CryptoQuant analyst Darkfost, Ethereum’s open interest on Binance has witnessed a sharp decline from its December peak of $7.78 billion to the current level of $3.1 billion. This 50% reduction represents a significant shift in market sentiment and trading activity on the world’s largest cryptocurrency exchange.

    SPONSORED

    Trade Ethereum with up to 100x leverage on perpetual contracts

    Trade Now on Defx

    Key Market Indicators and Technical Analysis

    The current market dynamics reveal several critical factors:

    • Open Interest falling below the 365-day Simple Moving Average (SMA)
    • Price support tested at $1,450 after failing to hold $1,600
    • Significant reduction in speculative trading activity
    • Increased risk aversion among derivatives traders

    Expert Predictions and Market Outlook

    Despite the bearish open interest data, some analysts maintain an optimistic outlook. Market expert Milkybull Crypto suggests that the current price level around $1,585 typically marks a macro bottom for ETH, projecting a potential rally to $10,000 if support holds.

    Frequently Asked Questions

    What does declining open interest mean for Ethereum?

    Declining open interest typically indicates reduced leverage in the market and could signal a period of consolidation before a potential trend reversal.

    How does this affect Ethereum’s price outlook?

    While short-term pressure may persist, historical patterns suggest that significant OI declines often precede major price recoveries.

    What should traders watch for next?

    Key indicators to monitor include trading volume, price action around the $1,450 support level, and any potential reversal in open interest trends.

    As the market continues to evolve, traders should maintain strict risk management practices and monitor these key indicators for potential trend reversals.

  • Cardano (ADA) Price Alert: Technical Analysis Points to $0.40 Target

    Cardano (ADA) Price Alert: Technical Analysis Points to $0.40 Target

    Cardano (ADA) is showing increasingly bearish signals as technical analysis suggests a potential drop to the $0.40 price level. This comes amid broader market turbulence, with the crypto market experiencing a 5% plunge as Bitcoin tests critical support levels.

    Technical Analysis Reveals Bearish Structure

    According to prominent analyst RLinda’s analysis on TradingView, ADA/USDT is displaying a concerning price structure that could lead to significant downside movement. The analysis, based on 4-hour candlestick data, identifies several critical price levels that traders should monitor:

    • Current resistance: $0.63 (previous support turned resistance)
    • Critical support: $0.581 (key trigger level)
    • Secondary support: $0.5092
    • Target zone: $0.40-$0.42

    Market Structure and Fibonacci Analysis

    The technical setup shows ADA has been forming lower highs since March 26, with the 0.5 Fibonacci retracement level adding additional resistance pressure. The price action suggests a classic liquidity retest pattern following a period of sideways consolidation between March 11 and May 6.

    SPONSORED

    Trade ADA with up to 100x leverage on perpetual contracts

    Trade Now on Defx

    Broader Market Context

    The bearish outlook for Cardano comes amid significant market volatility, partially triggered by recent developments in the global markets, including Trump’s tariff announcements that sent Bitcoin plunging to $76K. This macro uncertainty has created additional selling pressure across the cryptocurrency market.

    Key Support Levels and Trading Implications

    Traders should watch for these critical price levels:

    Price Level Significance
    $0.581 Primary support – breach could trigger cascade
    $0.5092 Secondary support – weak buying pressure expected
    $0.4564 Initial target in bearish scenario
    $0.40 Final target zone

    FAQ

    What is causing Cardano’s bearish outlook?

    Technical analysis shows a combination of lower highs, failed support levels, and broader market uncertainty contributing to bearish pressure.

    Where is the next major support for ADA?

    The critical support level lies at $0.581, with secondary support at $0.5092.

    What could prevent further price decline?

    A significant shift in broader market sentiment or strong buying pressure above $0.581 could help stabilize the price.

    Investors should maintain strict risk management practices given the current market conditions and potential for increased volatility.

  • Bitcoin Plunges to $76K as Trump Tariffs Trigger Bond Market Crisis

    Bitcoin Plunges to $76K as Trump Tariffs Trigger Bond Market Crisis

    The cryptocurrency market is facing severe turbulence as Bitcoin drops to $76,952 amid an unprecedented bond market crisis triggered by Trump’s new tariff policies. The turmoil in traditional markets is sending shockwaves through the crypto ecosystem, with experts warning of potential systemic risks.

    Jim Bianco of Bianco Research raised alarm bells on X, stating: “Something has broken tonight in the bond market. We are seeing a disorderly liquidation.” The 30-year US Treasury yield’s historic 56 basis point spike in just three days signals severe market stress not seen since 1982.

    This development comes as US Treasury yields surge to levels not witnessed since 1981, creating a perfect storm in global financial markets.

    Bond Market Crisis: What’s Really Happening?

    At the core of this market upheaval is the basis trade – a leveraged strategy used by hedge funds to profit from price differences between Treasury futures and bonds. The rapid unwinding of these positions has triggered a cascade of selling pressure, pushing yields to critical levels.

    SPONSORED

    Navigate market volatility with up to 100x leverage on perpetual contracts

    Trade Now on Defx

    Bitcoin’s Response to Market Chaos

    Bitcoin’s price action reflects growing correlation with traditional risk assets, dropping 8% as S&P futures plummeted 12%. This mirrors the broader market reaction to escalating trade war tensions and retaliatory tariffs.

    Expert Outlook and Market Implications

    Leading analysts, including Stack Hodler, suggest this crisis could be worse than 2008, presenting two potential outcomes: total market collapse or significant Fed intervention. The latter scenario could prove highly bullish for Bitcoin as a hedge against monetary policy actions.

    Key Market Indicators to Watch

    • US Dollar Index (DXY) movement
    • Treasury yield trajectories
    • Federal Reserve response
    • Global trade war developments

    FAQs About the Current Market Situation

    Q: How will this affect Bitcoin in the short term?
    A: Immediate pressure could persist, but potential Fed intervention could trigger a significant rally.

    Q: Is Bitcoin still a safe haven asset?
    A: While currently showing correlation with risk assets, Bitcoin’s fundamentals as a hedge against monetary intervention remain strong.

    Q: What should crypto investors do?
    A: Focus on long-term fundamentals and consider dollar-cost averaging during market volatility.