Tag: Market Analysis

  • XRP Price Surges in V-Shaped Recovery: $1.90 Level Reclaimed

    XRP Price Surges in V-Shaped Recovery: $1.90 Level Reclaimed

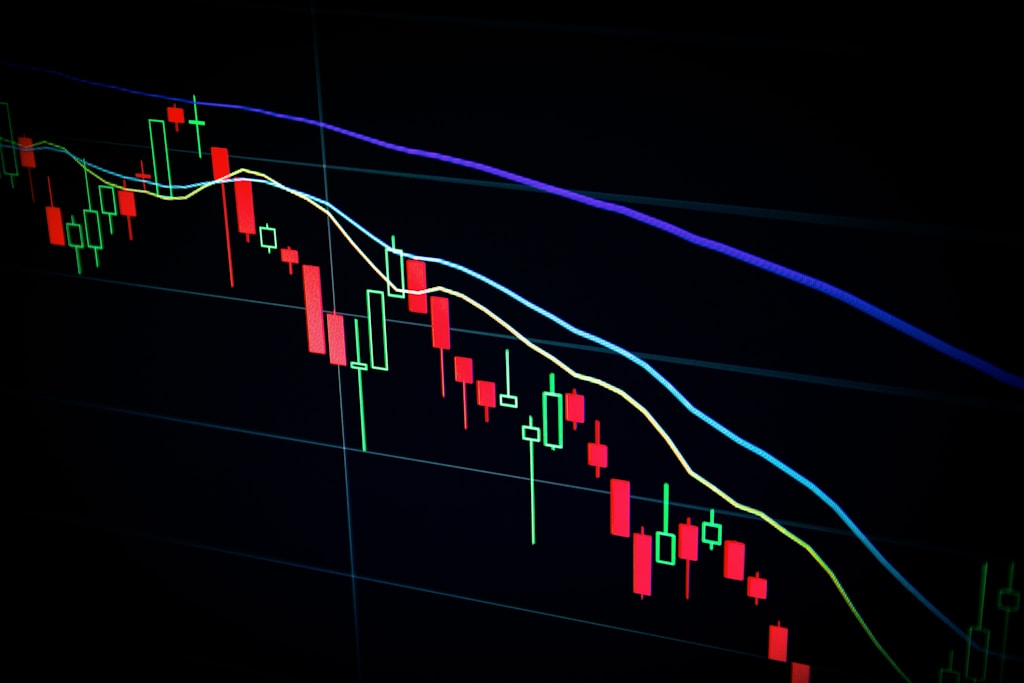
    XRP has staged a remarkable comeback in today’s trading session, demonstrating a textbook V-shaped recovery pattern that has caught the attention of crypto market participants. This price action follows last week’s sharp decline below $2, marking a significant shift in market sentiment.

    XRP Price Analysis: Key Metrics and Market Performance

    As of the latest market data, XRP is trading at $1.90, representing a substantial recovery from recent lows. The digital asset currently commands a market capitalization of $110 billion, positioning it firmly among the top cryptocurrencies by value. Trading volume has surged to $13.96 billion over the past 24 hours, indicating strong market participation and liquidity.

    Intraday Trading Range and Volatility

    Today’s trading session has witnessed significant price action, with XRP moving within a broad range:

    • Daily Low: $1.65
    • Daily High: $2.05
    • Current Price: $1.90

    Technical Analysis and Market Structure

    The 1-hour chart reveals several key technical developments:

    • Formation of a clear V-shaped recovery pattern
    • Increased buying pressure at lower levels
    • Strong volume confirmation of the recovery
    • Break above key moving averages

    SPONSORED

    Trade XRP with up to 100x leverage on perpetual contracts

    Trade Now on Defx

    Market Implications and Future Outlook

    The current recovery suggests renewed confidence in XRP’s market position. However, traders should remain cautious of potential resistance levels and market volatility. Key factors to watch include:

    • Support level at $1.75
    • Resistance zone around $2.05
    • Overall market sentiment and correlation with Bitcoin

    Frequently Asked Questions

    What caused XRP’s recent price recovery?

    The V-shaped recovery appears to be driven by strong buying pressure at lower levels and improved market sentiment following recent price corrections.

    What are the key resistance levels to watch?

    The immediate resistance lies at $2.05, with secondary resistance at the previous high of $2.20.

    Is this recovery sustainable?

    While technical indicators suggest strong momentum, traders should monitor volume profiles and broader market conditions for confirmation of sustained recovery.
  • Strategy Reports $5.91B Bitcoin Loss as Market Tests $77K Support

    Strategy Reports $5.91B Bitcoin Loss as Market Tests $77K Support

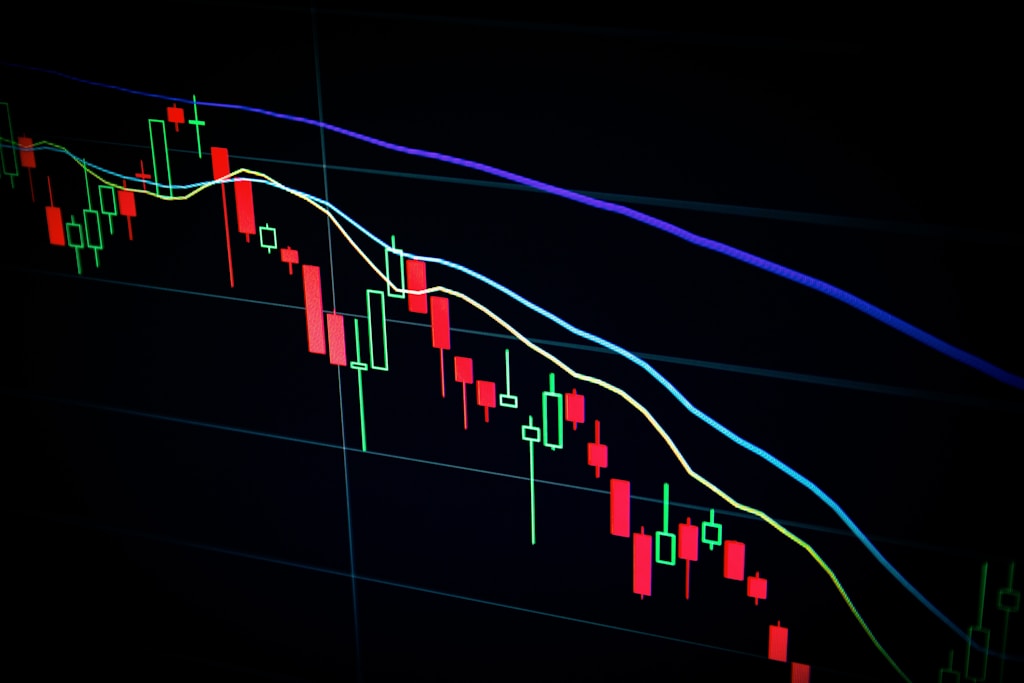
    Strategy (formerly Microstrategy) has reported a staggering $5.91 billion unrealized loss on its Bitcoin holdings for Q1 2025, as Bitcoin continues testing critical support levels amid recent market turbulence. The loss comes as new accounting rules require crypto assets to be marked to market, providing unprecedented transparency into institutional Bitcoin holdings.

    Key Highlights of Strategy’s Q1 2025 Bitcoin Holdings Report

    • Total unrealized loss: $5.91 billion
    • New mark-to-market accounting requirements implemented
    • Non-cash loss classification maintains company stability
    • Strategy continues to hold its Bitcoin position despite volatility

    Impact of New Accounting Standards on Crypto Holdings

    The implementation of new accounting standards requiring mark-to-market valuation for cryptocurrency assets represents a significant shift in how institutional Bitcoin holdings are reported. This change provides greater transparency but also exposes companies to increased earnings volatility.

    SPONSORED

    Trade Bitcoin with up to 100x leverage and maximize your profit potential

    Trade Now on Defx

    Market Implications and Future Outlook

    The significant unrealized loss comes at a crucial time as Bitcoin faces increased pressure at the $77K level. However, Strategy’s long-term conviction remains unchanged, with the company maintaining its position despite short-term market volatility.

    Frequently Asked Questions

    Q: Does this loss affect Strategy’s operational stability?
    A: No, as these are unrealized losses that don’t impact the company’s cash flow or operations.

    Q: Will Strategy consider reducing its Bitcoin position?
    A: Current statements from management indicate no plans to reduce holdings despite market conditions.

    Q: How do the new accounting rules affect other institutional holders?
    A: All public companies holding crypto assets must now report mark-to-market valuations, increasing transparency across the sector.

  • Bitcoin Price Alert: Analyst Warns of 60% Crash to $49K on Volume Drop

    Bitcoin Price Alert: Analyst Warns of 60% Crash to $49K on Volume Drop

    A prominent crypto analyst has issued a stark warning about Bitcoin’s price trajectory, suggesting a potential 60% crash to $49,000 based on concerning volume metrics. This analysis comes amid broader market turbulence that has already pushed Bitcoin below key support levels.

    Critical Volume Analysis Points to Major Correction

    According to respected analyst Melika Trader’s detailed TradingView analysis, Bitcoin is precariously positioned above critical support zones. The concerning pattern emerges from volume profile data on Binance, showing dangerously low trading activity at current price levels.

    Key warning signals include:

    • Loss of crucial $83,000 support level
    • Breakdown of $75,000 trend line support
    • Minimal trading volume above $70,000
    • High-volume zone clustering near $30,000

    SPONSORED

    Trade Bitcoin with up to 100x leverage and maximize your profit potential

    Trade Now on Defx

    Silver Lining: Only 20% of Traders at Risk

    Despite the bearish outlook, Melika Trader highlights an important nuance: approximately 80% of Bitcoin holders entered positions below $35,000. This suggests most investors remain in profit even if the predicted correction materializes.

    CryptoQuant CEO Confirms Bear Market Signals

    Supporting this bearish thesis, CryptoQuant’s CEO Ki Young Ju points to concerning metrics in the Realized Cap versus Market Cap relationship. The analysis shows capital inflow failing to drive price appreciation – a classic bear market indicator.

    Key Support Levels to Watch

    Critical support levels traders should monitor:

    • $75,000 – Previous trend line support
    • $49,000 – Projected bottom target
    • $35,000 – Major accumulation zone
    • $30,000 – High-volume support region

    FAQ: Bitcoin Price Correction

    How long could this bear market last?

    According to Ki Young Ju, historical data suggests real market reversals typically require at least six months to complete.

    What’s causing the current selling pressure?

    Multiple factors contribute, including significant ETF outflows and broader market concerns over potential trade tariffs.

    Should investors be concerned?

    Long-term holders who entered below $35,000 maintain strong profit margins even with a correction to $49,000.

    At press time, Bitcoin trades at $77,000, showing a 7% decline over 24 hours. Traders should maintain strict risk management given the potential for increased volatility.

  • Bitcoin Price Whipsaws Between $74K-$78K as Trump Tariffs Rock Markets

    Bitcoin’s price action turned extremely volatile on Monday, with the leading cryptocurrency experiencing a dramatic $4,000 trading range amid escalating concerns over President Trump’s aggressive trade policies. The sharp decline below $75K triggered widespread market panic, though buyers quickly emerged to defend key support levels.

    Key Takeaways:

    • Bitcoin plunged to $74,000 before recovering to $78,000
    • Trump’s tariff policies creating significant macro uncertainty
    • BTC showing relative strength compared to altcoins
    • Critical support zone established between $73K-$75K

    Market Analysis: Understanding Today’s Volatility

    The cryptocurrency market faced intense selling pressure early Monday as global markets reacted to Trump’s latest tariff announcements. Bitcoin’s initial drop to $74,000 represented a 15% decline from recent highs, though the quick recovery suggests strong buyer interest at lower levels.

    SPONSORED

    Trade Bitcoin with up to 100x leverage on perpetual contracts

    Trade Now on Defx

    Technical Analysis

    Key support levels to watch:

    • Primary support: $74,000
    • Secondary support: $72,500
    • Key resistance: $78,500
    • Volume profile suggests strong buying interest below $75,000

    Market Impact on Altcoins

    While Bitcoin experienced significant volatility, altcoins faced even steeper declines, with many dropping 20% or more. This relative strength in Bitcoin’s market position suggests institutional investors may be viewing BTC as a safer haven during market uncertainty.

    FAQ

    What caused today’s Bitcoin price volatility?

    The primary catalyst was President Trump’s announcement of new tariff policies, creating uncertainty in global markets.

    Is the $74,000 level likely to hold as support?

    Technical indicators suggest strong buyer interest at this level, though continued macro uncertainty could test this support.

    How does this affect Bitcoin’s long-term outlook?

    While short-term volatility remains high, institutional adoption and relative strength versus altcoins suggest underlying market resilience.

  • Bitcoin Whales Surge 4.6% as Price Tests $76K Support Level

    Bitcoin Whales Surge 4.6% as Price Tests $76K Support Level

    Bitcoin’s price action remains under pressure near $76,000, but on-chain data reveals a surprising surge in whale accumulation that could signal institutional confidence in the leading cryptocurrency. Recent market turbulence triggered by Trump’s trade policies has created an opportunity for large players to accumulate BTC at lower prices.

    Key Takeaways:

    • 76 new Bitcoin whales (holding >1,000 BTC) emerged in the past two months
    • 4.6% increase in large holders despite broader market weakness
    • BTC trading at critical $76,000 support after losing $81,000 level
    • Institutional accumulation historically precedes price recoveries

    Whale Accumulation Accelerates Despite Market Pressure

    According to recent Glassnode data, the number of addresses holding over 1,000 BTC has increased by 76 in just two months, representing a 4.6% surge in whale-sized wallets. This accumulation pattern is particularly noteworthy given emerging bear market warnings from technical indicators.

    SPONSORED

    Trade Bitcoin with up to 100x leverage on perpetual contracts

    Trade Now on Defx

    Technical Analysis: Critical Support Levels

    Bitcoin currently trades at $76,000, having lost several key support levels including the crucial $81,000 mark. The immediate challenge for bulls is reclaiming these lost levels while defending current support zones:

    • Critical Support: $75,000
    • Major Resistance: $81,000
    • Secondary Support: $70,000
    • Last Line of Defense: $66,000

    Institutional Perspective

    The increase in whale addresses suggests institutional players may be taking advantage of recent price weakness to build positions. Historically, such accumulation patterns during market downturns have preceded significant recovery phases.

    FAQ

    What defines a Bitcoin whale?

    A Bitcoin whale is typically defined as an address holding more than 1,000 BTC, worth approximately $76 million at current prices.

    Why is whale accumulation significant?

    Whale accumulation often indicates strong hands entering the market, potentially signaling long-term confidence in Bitcoin’s value proposition.

    What could trigger a market recovery?

    A combination of sustained institutional buying, improved macro conditions, and technical breakouts above key resistance levels could catalyze a broader market recovery.

    Market Outlook

    While short-term price action remains bearish, the substantial increase in whale addresses provides a potentially bullish counter-signal for long-term investors. Traders should monitor the $75,000 support level closely while watching for signs of institutional buying momentum.

  • Bitcoin Price Could Crash to $10K, Bloomberg Analyst Warns

    Bitcoin Price Could Crash to $10K, Bloomberg Analyst Warns

    Bloomberg Intelligence’s senior commodity strategist Mike McGlone has issued a stark warning about Bitcoin’s price trajectory, suggesting the leading cryptocurrency could plummet to $10,000 amid growing macroeconomic pressures. This bearish prediction comes as Bitcoin recently experienced significant downward pressure due to Trump’s tariff announcements.

    Key Points from McGlone’s Analysis

    • Potential 87% drop from recent highs
    • Macroeconomic headwinds as primary catalyst
    • Trump policies affecting crypto markets
    • Correlation with traditional market turbulence

    Market Context and Technical Analysis

    This bearish outlook aligns with recent market developments, as CryptoQuant’s CEO recently confirmed bearish signals in Bitcoin’s market structure. The convergence of multiple bearish indicators suggests increased downside risk for the cryptocurrency market.

    SPONSORED

    Protect your portfolio with up to 100x leverage on perpetual contracts

    Trade Now on Defx

    Historical Precedent and Market Implications

    McGlone’s analysis draws parallels to previous market cycles, highlighting potential support levels and resistance zones that could come into play during a significant downturn. The strategist’s track record in predicting market movements adds weight to this bearish scenario.

    FAQ Section

    What factors could trigger a Bitcoin crash to $10,000?

    Macroeconomic pressures, regulatory changes, and market sentiment shifts could contribute to a significant price decline.

    How likely is McGlone’s prediction to materialize?

    While the prediction represents an extreme scenario, historical volatility shows such moves are possible in crypto markets.

    What should investors do to prepare?

    Risk management, portfolio diversification, and maintaining adequate cash reserves are recommended strategies.

    Expert Perspectives and Market Outlook

    The analysis comes amid broader market uncertainty, with several indicators suggesting potential weakness in crypto markets. Traders and investors are advised to maintain cautious positioning given the current market dynamics.

  • Solana Meme Coin Surges 2,700% After Fortnite CEO’s ‘Scam’ Warning

    A Solana-based meme coin inspired by Fortnite’s storyline experienced a dramatic 2,700% price surge after Epic Games CEO Tim Sweeney publicly denounced it as a scam, highlighting the often unpredictable nature of the meme coin market.

    Key Takeaways:

    • The Fortnite-themed Solana meme coin pumped 2,700% following negative comments from Epic Games CEO
    • Price surge demonstrates the ‘Streisand effect’ in crypto markets
    • Subsequent crash reinforces volatile nature of meme coin investments

    Epic Games CEO’s Warning Triggers Unexpected Rally

    In an ironic turn of events that exemplifies the unpredictable nature of crypto markets, Tim Sweeney’s public warning about the unauthorized Fortnite-themed token had the opposite of its intended effect. Rather than deterring investors, the high-profile criticism appeared to attract increased attention and trading volume to the token.

    This incident follows a broader trend of meme coin volatility in the crypto market. Recent market turbulence has seen major meme coins like DOGE, SHIB, and PEPE experience significant price drops, making this unexpected rally particularly noteworthy.

    SPONSORED

    Trade meme coins with leverage in spot margin on Solana

    Trade Now on Defx

    Market Impact and Analysis

    The token’s dramatic price movement demonstrates several key characteristics of the current meme coin market:

    • Heightened sensitivity to social media attention
    • Rapid price volatility
    • Impact of high-profile figures on token valuations
    • Short-lived nature of speculation-driven rallies

    Risk Considerations for Investors

    While the massive price surge may appear attractive to speculators, the subsequent crash reinforces the high-risk nature of meme coin investments. Investors should consider:

    • Limited utility and use cases
    • Potential regulatory concerns
    • High volatility and crash risk
    • Importance of thorough due diligence

    FAQ Section

    What caused the meme coin’s price surge?

    The price surge was triggered by increased attention following Epic Games CEO Tim Sweeney’s public criticism of the token as a scam.

    Is this Fortnite-themed token officially associated with Epic Games?

    No, the token has no official association with Epic Games or Fortnite, as confirmed by CEO Tim Sweeney’s statements.

    What are the risks of investing in meme coins?

    Meme coins typically carry high risks including extreme price volatility, limited utility, potential regulatory issues, and susceptibility to market manipulation.

  • Bitcoin Price Crashes 10% as QCP Warns of Economic War Escalation

    Global cryptocurrency markets faced severe turbulence today as Bitcoin plunged amid escalating U.S.-China trade tensions, with leading crypto intelligence firm QCP Capital warning of an impending “full-scale economic war.” This market correction follows last weekend’s $160 billion crypto market selloff.

    Market Impact and Technical Analysis

    Bitcoin’s price action showed initial resilience to equity market weakness before succumbing to broader risk-off sentiment. The leading cryptocurrency’s correlation with traditional risk assets has strengthened significantly as institutional adoption increases.

    Key levels to watch according to QCP Capital:

    • Critical support: $75,000
    • Next major resistance: $82,500
    • Volume profile showing heavy accumulation zone: $73,000-$77,000

    Trade War Escalation Triggers

    The current market downturn stems from several key factors:

    • New tariff announcements between U.S. and China
    • Supply chain disruption concerns
    • Global risk asset correlation
    • Institutional deleveraging

    SPONSORED

    Navigate market volatility with up to 100x leverage on perpetual contracts

    Trade Now on Defx

    Expert Analysis and Market Outlook

    QCP Capital’s analysis suggests this could be the beginning of a broader market correction, potentially leading to:

    • Increased volatility across crypto markets
    • Further correlation with traditional finance
    • Potential flight to stablecoins

    FAQs About the Market Correction

    What caused the recent Bitcoin price drop?

    The primary catalyst was escalating trade tensions between the U.S. and China, leading to broader market uncertainty and risk-off sentiment.

    How long might this market downturn last?

    According to QCP Capital, market participants should prepare for extended volatility until trade tensions show signs of resolution.

    What are the key support levels to watch?

    Critical support exists at $75,000, with secondary support at $73,000. Breaking below these levels could trigger further selling pressure.

  • Bitcoin Mining Power Hits Historic 1 Zetahash Milestone Amid Price Drop

    Bitcoin Mining Power Hits Historic 1 Zetahash Milestone Amid Price Drop

    Bitcoin’s network has achieved an unprecedented milestone, reaching 1 Zetahash per second (ZH/s) in mining power for the first time in its 16-year history. This remarkable technical achievement comes as Bitcoin’s price experiences significant volatility, dropping below $80K and erasing $160B in market value.

    Breaking Down Bitcoin’s Historic Mining Achievement

    Multiple blockchain tracking services have confirmed this groundbreaking achievement between April 4-5, 2025. According to mempool.space, Bitcoin’s hashrate peaked at 1.025 ZH/s on April 5, while BTC Frame reported a slightly earlier breakthrough at 1.02 ZH/s on April 4. Coinwarz data showed an even higher peak of 1.1 ZH/s.

    SPONSORED

    Trade Bitcoin with up to 100x leverage and maximize your profit potential

    Trade Now on Defx

    Understanding the Scale of Growth

    To put this achievement in perspective, the current hashrate represents a 1,000-fold increase since January 2016, when Bitcoin first reached 1 Exahash per second. The network now processes approximately 40,000 times more calculations per second than Litecoin, the second-largest proof-of-work cryptocurrency network.

    Commercial Mining Operations Lead the Charge

    The surge in hashrate coincides with increased competition among commercial Bitcoin mining firms. At least 24 publicly listed companies now operate Bitcoin mining equipment, with MARA Holdings leading at over 50 EH/s of computing power. However, as Bitcoin’s price recently dropped 8% to $77K, analysts warn that less efficient miners may face challenges ahead.

    Market Impact and Future Outlook

    This technical milestone occurred during a broader market downturn, with Bitcoin’s price experiencing significant pressure. The contrast between growing network strength and price volatility highlights the complex dynamics of the cryptocurrency market in 2025.

    Frequently Asked Questions

    What is a Zetahash?
    A Zetahash (ZH/s) is a unit of computational power equal to 1,000 Exahashes per second, used to measure Bitcoin’s mining network strength.

    How does this affect Bitcoin security?
    Higher hashrates indicate stronger network security, making it increasingly difficult and costly to attempt a 51% attack.

    Will this impact Bitcoin’s price?
    While network strength typically correlates with long-term value, short-term price movements are influenced by multiple factors beyond hashrate.

  • Bitcoin Price Whipsaws on False Tariff News as Markets React

    Bitcoin Price Whipsaws on False Tariff News as Markets React

    In a dramatic display of market sensitivity, Bitcoin and traditional markets experienced significant volatility today following misreported news about potential tariff negotiations. This incident, which connects to recent market fears around global tariffs, highlights the increasing correlation between crypto and mainstream financial markets.

    Market Reaction to Misreported News

    The cryptocurrency market demonstrated extreme sensitivity to macroeconomic news when prices suddenly surged following incorrect reports about a 90-day pause in tariffs. The false information, which originated from mischaracterized comments by a White House advisor, spread rapidly across social media platform X (formerly Twitter), triggering immediate market movements.

    Impact on Bitcoin and Traditional Markets

    The incident caused a rapid sequence of events:

    • Initial pump: Markets responded positively to the false news
    • Quick reversal: Prices crashed once the information was revealed to be incorrect
    • Increased volatility: Trading volumes spiked during both movements

    SPONSORED

    Navigate volatile markets with up to 100x leverage on perpetual contracts

    Trade Now on Defx

    Market Implications

    This event underscores several critical factors affecting current market conditions:

    • High sensitivity to macro news
    • Growing correlation between crypto and traditional markets
    • Impact of social media on market movements
    • Need for verified information sources

    FAQ Section

    What caused the market volatility?

    The volatility was triggered by misreported news about a potential 90-day pause in tariffs, which was later proven false.

    How did social media affect the market movement?

    Social media platform X amplified the spread of the incorrect information, leading to rapid market reactions before verification.

    What lessons can traders learn from this incident?

    This event emphasizes the importance of verifying news sources and maintaining cautious trading strategies during periods of high market sensitivity.