Bitcoin’s market dynamics are showing significant bullish signals as the Taker Buy Volume reaches a critical milestone amid recent macroeconomic tensions. Bitcoin’s resilience as a hedge against market uncertainty is being tested once again as new trade tariffs shake traditional markets.
Bitcoin Price Holds Strong Despite Market Turbulence
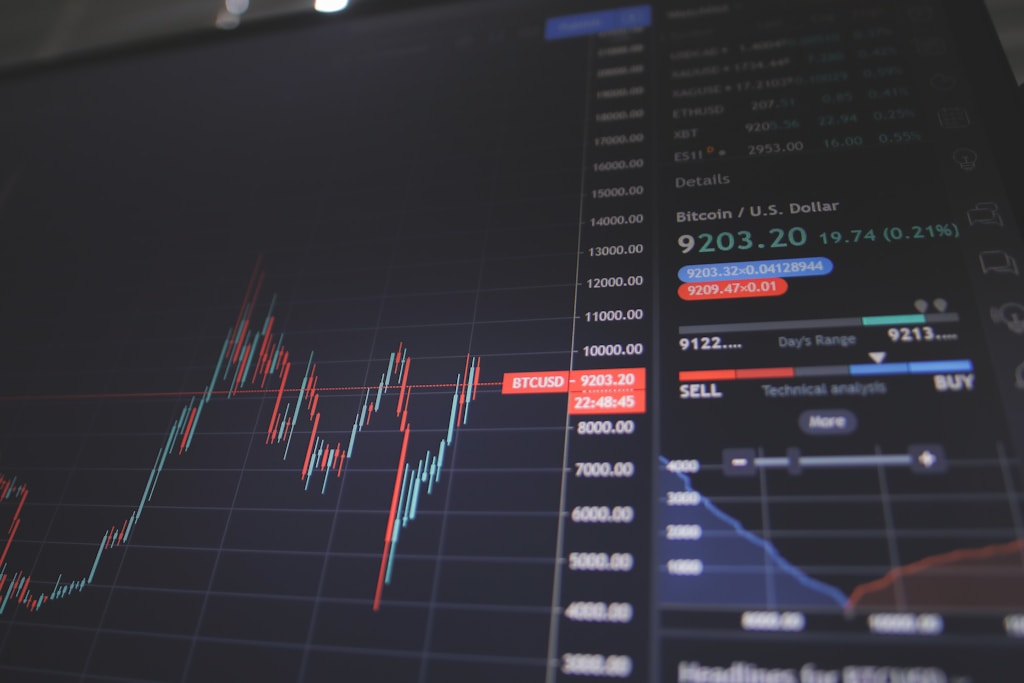
In a remarkable display of market strength, Bitcoin has maintained its position around $84,000 despite significant headwinds in traditional markets. While the Nasdaq faces mounting pressure from trade tensions, Bitcoin’s price action suggests a potential decoupling from traditional market correlations.
Understanding Taker Buy Volume
The Taker Buy Volume metric has emerged as a crucial indicator for Bitcoin’s price trajectory. This technical indicator measures the total volume of buy orders filled by takers in perpetual swap markets, providing valuable insights into market sentiment and potential price movements.
SPONSORED
Trade Bitcoin with up to 100x leverage and maximize your profit potential
Key Market Indicators
- Current Bitcoin Price: $84,000
- 24-hour Change: +2%
- Taker Buy Volume: 101.18 million BTC
- Market Sentiment: Bullish
Expert Analysis and Price Predictions
According to crypto analyst Maartunn, the surge in Taker Buy Volume beyond 100 million BTC represents a significant milestone. Historical data suggests that such volume increases often precede substantial price movements, potentially signaling an imminent bullish breakout.
Frequently Asked Questions
What is Taker Buy Volume?
Taker Buy Volume represents the total amount of cryptocurrency purchased by market participants who execute orders against existing sell orders in the order book.
Why is the 100M BTC milestone significant?
This level historically indicates strong buying pressure and has preceded significant price movements in previous market cycles.
How does this metric compare to previous bull runs?
Current Taker Buy Volume levels mirror patterns seen during previous bull market phases, suggesting similar price action may follow.
Market Implications and Trading Opportunities
The combination of strong Taker Buy Volume and Bitcoin’s resilience against macro headwinds presents a compelling case for potential price appreciation. Traders should monitor key support levels and volume patterns for confirmation of this bullish setup.