Tag: Market Analysis

  • Ethereum Death Cross Alert: Key Indicator Signals Major Price Reversal

    A concerning technical pattern has emerged for Ethereum (ETH) as a prominent death cross forms in its funding rates indicator, potentially signaling extended bearish momentum ahead. This development comes as ETH whales show significant accumulation activity despite recent market turbulence.

    Understanding the Ethereum Funding Rate Death Cross

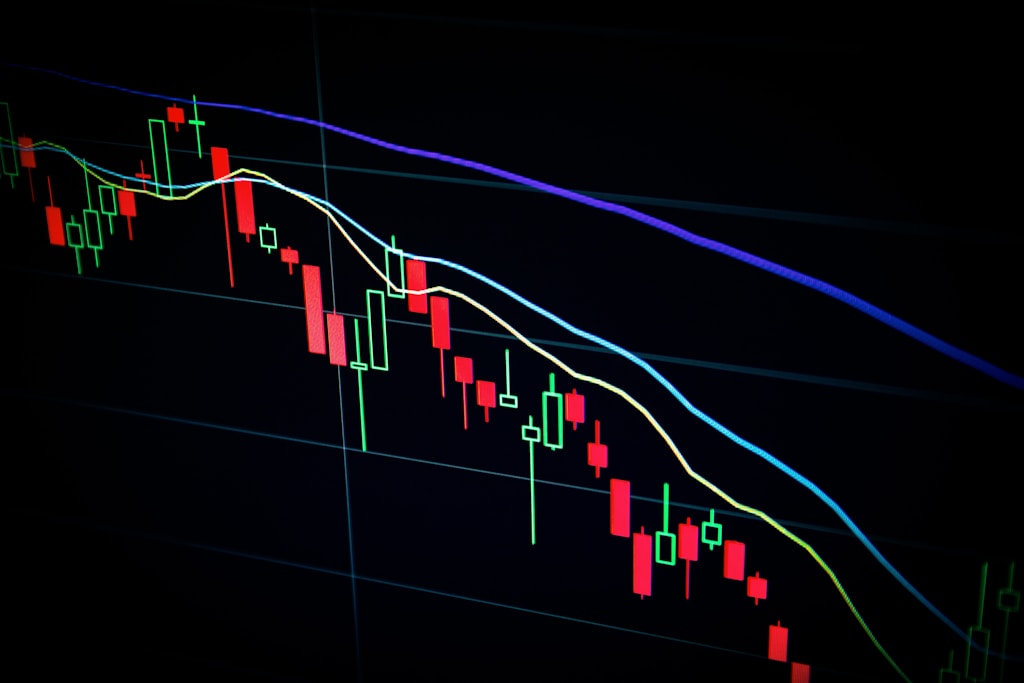
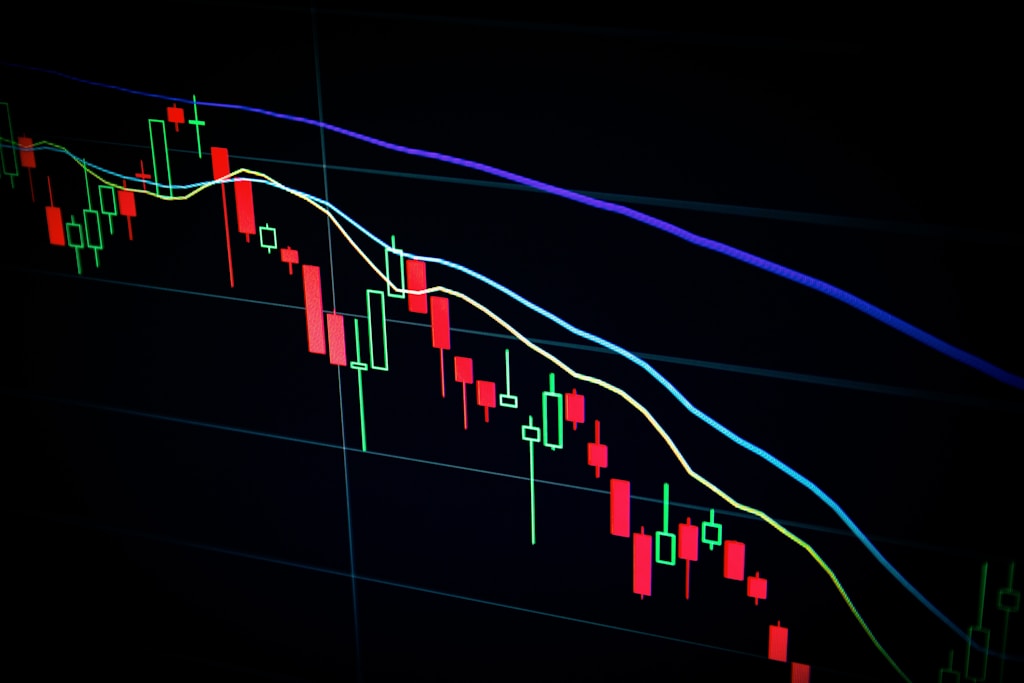
    According to recent CryptoQuant analysis, Ethereum’s funding rates have displayed a critical bearish signal, with the 50-day Simple Moving Average (SMA) crossing below the 200-day SMA in January 2025. This technical event, known as a death cross, has historically preceded significant price corrections in the cryptocurrency market.

    SPONSORED

    Trade Ethereum with up to 100x leverage and maximize your profit potential

    Trade Now on Defx

    Historical Context and Market Implications

    The current market structure bears striking similarities to previous bearish cycles:

    • Early 2024: Similar death cross preceded a 25% price decline
    • 2023 Pattern: Funding rate crossovers accurately predicted major trend reversals
    • Current Status: 50-day and 200-day SMAs show significant divergence

    Key Recovery Catalysts to Watch

    For Ethereum to reverse this bearish trend, several key factors must align:

    1. Bullish crossover in funding rates
    2. Return of leveraged speculation
    3. Institutional investment flows
    4. Overall market sentiment shift

    Expert Analysis and Price Outlook

    Market analysts suggest that Ethereum’s long-term price potential remains strong, despite current technical weakness. The $1,800 support level represents a critical threshold that bulls must defend to prevent further deterioration.

    FAQ Section

    What is a death cross in crypto markets?

    A death cross occurs when a short-term moving average crosses below a long-term moving average, typically signaling bearish momentum.

    How long do crypto death crosses typically last?

    Historical data suggests death cross periods can last anywhere from 2-6 months before a reversal occurs.

    What are funding rates in cryptocurrency trading?

    Funding rates are periodic payments between long and short traders in perpetual futures markets, indicating market sentiment and positioning.

    Market Impact and Trading Implications

    Current market conditions suggest traders should:

    • Monitor funding rate convergence for reversal signals
    • Watch key support levels around $1,800
    • Consider risk management strategies during high volatility
    • Track institutional flow data for sentiment shifts

    Time will tell if this technical pattern leads to extended bearish price action or if Ethereum can buck the trend with a swift recovery. Traders and investors should remain vigilant and adjust their strategies accordingly.

  • Bitcoin Whales Tighten Grip: 4 Entities Now Control 7.53% of BTC Supply

    In a significant development for Bitcoin’s institutional adoption landscape, Strategy (formerly Microstrategy) has expanded its Bitcoin holdings to 528,185 BTC, contributing to an unprecedented concentration of Bitcoin ownership among major players. This latest acquisition, combined with other institutional holdings, means just four entities now control 7.53% of Bitcoin’s total supply.

    Strategy’s Latest Bitcoin Acquisition Signals Institutional Momentum

    As reported in Strategy’s recent announcement, the company purchased an additional 22,048 BTC, reinforcing its position as the second-largest corporate holder of Bitcoin. This move comes at a time when institutional buyers are showing remarkable strength in the market.

    The Big Four: Breaking Down Bitcoin’s Largest Holders

    Entity BTC Holdings Percentage of Supply
    BlackRock’s IBIT ETF 656,421 BTC 3.12%
    Strategy (MicroStrategy) 528,185 BTC 2.51%
    Grayscale Bitcoin Trust 240,000 BTC 1.14%
    Fidelity’s FBTC 158,550 BTC 0.76%

    SPONSORED

    Trade Bitcoin with up to 100x leverage on perpetual contracts

    Trade Now on Defx

    Market Implications and Future Outlook

    The concentration of Bitcoin ownership among major institutional players raises important questions about market dynamics and price stability. While institutional adoption provides validation for Bitcoin as an asset class, it also introduces new considerations about market influence and centralization risks.

    FAQ Section

    What does this concentration of ownership mean for Bitcoin?

    While institutional adoption demonstrates confidence in Bitcoin, high concentration among few entities could potentially impact market dynamics and price movements.

    How does Strategy’s acquisition strategy affect Bitcoin’s price?

    Large-scale acquisitions typically reduce available supply in the market, potentially contributing to upward price pressure when demand remains constant or increases.

    What are the risks of concentrated Bitcoin ownership?

    Concentrated ownership could lead to increased market volatility if large holders decide to sell significant portions of their holdings simultaneously.

    Time to Read: 5 minutes

  • Bitcoin Price Plunges to $81.5K as Trump Tariff Deadline Looms

    Bitcoin Price Plunges to $81.5K as Trump Tariff Deadline Looms

    Leading cryptocurrencies faced significant volatility on Monday as markets react to the approaching Trump tariff deadline, with Bitcoin (BTC) dropping to a concerning $81,500 level. This price action comes amid broader market uncertainty about potential economic impacts.

    Market Impact of Trump’s Tariff Deadline

    As previously reported, Bitcoin’s price has been particularly sensitive to developments surrounding Trump’s proposed tariff policies. The leading cryptocurrency’s recent price movement suggests growing concern among investors about potential economic ripple effects.

    Key Price Levels to Watch

    • Current support: $81,500
    • Next major support: $80,000
    • Key resistance: $83,000
    • 24-hour trading volume: Elevated with increased selling pressure

    Cross-Asset Market Response

    The impact isn’t limited to Bitcoin, as both Ethereum and Solana are experiencing similar market turbulence. Ethereum has retreated from recent highs, while Solana’s price action mirrors the broader crypto market uncertainty.

    SPONSORED

    Navigate market volatility with up to 100x leverage on perpetual contracts

    Trade Now on Defx

    Expert Analysis and Market Outlook

    Market analysts suggest this could be a temporary dip, with technical analysis indicating the top isn’t in yet despite current struggles. Institutional interest remains strong, as evidenced by recent market activities.

    FAQ Section

    How long might this market uncertainty last?

    Market experts suggest volatility could persist until there’s clarity on the tariff situation, potentially extending through early April.

    What are the key support levels to watch?

    The critical support zone lies between $80,000 and $81,500, with strong buyer interest noted at these levels.

    How are other cryptocurrencies affected?

    Major altcoins are showing correlated movement, with Ethereum and Solana particularly sensitive to Bitcoin’s price action.

  • Bitcoin Price Warning: Hedge Fund Predicts 40% Drop to $50K Range

    Leading crypto hedge fund manager Quinn Thompson of Lekker Capital has issued a stark warning for Bitcoin investors, predicting BTC could plummet below $60,000 by year-end amid mounting macroeconomic pressures. This bearish forecast comes as Bitcoin continues to struggle below the $82,000 level due to escalating Trump tariff concerns.

    Key Points:

    • Current BTC price: $83,000
    • Predicted target range: $50,000-$59,999
    • Potential decline: ~40% from recent $109,000 peak
    • Timeline: Gradual decline through 2025

    Four Major Headwinds Threatening Crypto Markets

    Thompson identifies four critical factors that could trigger a sustained crypto market downturn:

    1. D.O.G.E. Spending Cuts

    The Department of Government Efficiency (D.O.G.E.), led by Elon Musk, aims to slash $1 trillion in government spending by May. While Musk has recently clarified confusion around D.O.G.E.’s connection to cryptocurrency, these aggressive spending cuts could significantly impact economic growth.

    2. Immigration Policy Impact

    Stricter border controls and increased deportations are expected to create labor market pressures, potentially driving up wages and straining businesses.

    3. Trump Tariff Uncertainty

    Fluctuating tariff policies are creating market uncertainty, leading businesses to delay investments and hiring decisions.

    4. Federal Reserve Stance

    Despite expectations for rate cuts, the Fed remains cautious due to persistent inflation concerns. Thompson projects only modest cuts between 25-75 basis points in late 2025.

    SPONSORED

    Trade Bitcoin with up to 100x leverage on perpetual contracts

    Trade Now on Defx

    Market Impact Analysis

    Thompson characterizes the potential downturn as a “slow grind” rather than a sudden crash, making it potentially more challenging for traders to time the bottom. This pattern differs from previous crypto market corrections, which typically featured sharp, volatile moves.

    FAQ: Bitcoin Price Outlook

    When will Bitcoin hit bottom?

    Thompson suggests the bottom could form in early 2026, ahead of U.S. midterm elections.

    What could prevent this decline?

    A shift in government policy or stronger institutional buying could provide support.

    How does this compare to previous corrections?

    This projected decline would be less severe than the 2022 crash but could last longer.

    Key Takeaways for Investors

    Investors should prepare for potential extended downside while monitoring key support levels and macroeconomic indicators. Risk management and position sizing become crucial in this environment.

  • Bitcoin Price Dips Below $82K as Trump Tariff Fears Intensify

    Bitcoin’s price volatility continues to escalate as markets react to looming Trump tariff deadlines, with the leading cryptocurrency briefly touching $81,500 on Monday. This latest price action highlights the growing intersection between macro political events and crypto market dynamics.

    Market Impact of Trump’s Trade Policy

    As previously reported, Bitcoin’s price has been particularly sensitive to developments surrounding potential new tariffs. The current market uncertainty stems from former President Trump’s proposed trade policies, which could significantly impact global markets.

    Technical Analysis and Support Levels

    Key support levels to watch:

    • Primary support: $81,500
    • Secondary support: $80,000
    • Major resistance: $83,500

    Institutional Response

    Despite the short-term volatility, institutional interest remains strong. Recent data shows significant ETF inflows, suggesting that large investors may be viewing these dips as buying opportunities.

    SPONSORED

    Trade Bitcoin with up to 100x leverage and maximize your profit potential

    Trade Now on Defx

    FAQ Section

    How will Trump’s tariffs affect Bitcoin?

    The proposed tariffs could increase market volatility and potentially drive investors toward Bitcoin as a hedge against economic uncertainty.

    What are the key price levels to watch?

    Current critical support lies at $81,500, with major resistance at $83,500.

    Is this a buying opportunity?

    While some institutional investors are accumulating during this dip, individual investors should conduct their own research and risk assessment.

  • Bitcoin Price Analysis: Top Not In Yet Despite $82K Struggles

    Bitcoin Price Analysis: Top Not In Yet Despite $82K Struggles

    Bitcoin’s price action continues to generate intense debate among analysts, with the flagship cryptocurrency currently testing support at $82,000. Despite recent bearish sentiment, prominent crypto analysts argue that BTC has not yet reached its cycle peak, suggesting significant upside potential remains.

    As covered in our recent analysis Bitcoin Price Volatility Alert: 5 Critical Factors for April 2, multiple catalysts could impact BTC’s trajectory in the coming days.

    Why Analysts Believe Bitcoin’s Top Isn’t In

    Crypto analyst BitQuant has presented compelling evidence suggesting that Bitcoin’s current price action differs significantly from previous market cycle tops. Drawing parallels to the last bull run, BitQuant notes that while $60,000 displayed textbook topping patterns in 2021, similar technical formations are notably absent in the current cycle.

    SPONSORED

    Trade Bitcoin with up to 100x leverage on perpetual contracts

    Trade Now on Defx

    Key Price Levels to Watch

    According to analyst Kevin Capital, Bitcoin faces critical support between $70,000 and $73,000 if the current correction deepens. The immediate focus remains on the golden pocket at $81,000, with a breach potentially triggering a measured move to lower levels.

    Macro Factors Influencing Bitcoin’s Price

    Several significant macro events could impact Bitcoin’s price trajectory this week:

    • Trump tariff implementation on April 2nd
    • Labor market data release
    • US Treasury run-off reduction from $25B to $5B

    As highlighted in Macro Forces Overshadow Crypto: Fed Policy, War Drive Markets, these broader economic factors continue to play a crucial role in cryptocurrency market movements.

    Technical Analysis and Price Projections

    Current technical indicators suggest:

    • Strong support at $81,000 (golden pocket)
    • Secondary support zone: $70,000-$73,000
    • Current price: $82,000 (-2% in 24 hours)

    FAQ Section

    When will we know Bitcoin has reached its top?

    According to BitQuant, a clear 25% pullback combined with specific technical formations will signal the actual market top.

    What are the key support levels to watch?

    Primary support exists at $81,000, with secondary support between $70,000-$73,000.

    How do macro events affect Bitcoin’s price?

    Upcoming events like Trump’s tariffs and Treasury policy changes could create short-term volatility while potentially offering buying opportunities.

  • Ethereum Price Dips 12%: Whales Accumulate 66M ETH at Key Support

    Ethereum (ETH) is experiencing its worst first-quarter performance on record, yet major investors are viewing this dip as a strategic buying opportunity. Data reveals massive accumulation of over 66 million ETH by institutional players, suggesting strong confidence in the asset’s long-term potential.

    Institutional Investors Capitalize on ETH Price Correction

    According to data from IntoTheBlock, more than 12.43 million investors have purchased approximately 66.18 million ETH between $2,200 and $2,580, forming a significant support zone. This accumulation pattern mirrors previous bull market cycles, particularly those seen in 2017 and 2021.

    Noted crypto analyst Ali Martinez highlights that this substantial buying activity could catalyze a breakout above current resistance levels. Recent analysis suggesting a $20,000 ETH price target adds weight to the bullish sentiment, though adoption metrics remain crucial for such projections.

    SPONSORED

    Trade Ethereum with up to 100x leverage on perpetual contracts

    Trade Now on Defx

    Technical Analysis Points to Critical Support Levels

    ETH currently sits at a crucial technical junction, forming a Descending Triangle pattern on the 4-hour timeframe. Technical analyst Jonathan Carter identifies key resistance levels at:

    • $1,950 (immediate resistance)
    • $2,080 (secondary resistance)
    • $2,230 (major resistance)
    • $2,320 (breakout target)

    Bullish Case for ETH in 2025

    Market analyst CryptoELITES projects a potential 700% surge for ETH in 2025, targeting the $15,000 level. This forecast is based on historical price patterns and current market dynamics. Supporting factors include:

    • Similar bottom formation to 2017 and 2021 cycles
    • Strong institutional accumulation at current levels
    • Technical pattern suggesting potential breakout

    Frequently Asked Questions

    Why are investors accumulating ETH during this dip?

    Institutional investors view the current price levels as a strategic entry point, similar to previous bull market cycles. The massive accumulation of 66.18 million ETH suggests strong confidence in future price appreciation.

    What are the key price levels to watch?

    Critical support exists between $2,200-$2,580, while resistance levels are at $1,950, $2,080, $2,230, and $2,320. Breaking above these levels could trigger a significant rally.

    Could ETH really reach $15,000 in 2025?

    While ambitious, analysts base this projection on historical patterns and current accumulation trends. However, investors should conduct thorough research and consider market risks before making investment decisions.

  • Bitcoin Price Surges to $83K as Institutional Buyers Show Strength

    Bitcoin’s price has demonstrated remarkable resilience, bouncing back to $83,000 after a brief dip to $81,000, driven by significant institutional buying pressure. This recovery comes as major players continue to accumulate BTC, signaling strong fundamental support for the leading cryptocurrency.

    Key Highlights of Bitcoin’s Recent Price Action

    • Weekend dip to $81,000 support level
    • Quick recovery to $83,000 within 24 hours
    • Strategy (MSTR) announces $1.92 billion BTC purchase
    • Metaplanet adds $13.3 million in Bitcoin to holdings

    As reported in recent coverage of Strategy’s massive Bitcoin acquisition, institutional interest in Bitcoin continues to grow despite short-term price volatility. This latest recovery demonstrates the market’s maturity and the increasing role of institutional capital in stabilizing price movements.

    Institutional Buying Analysis

    The recent dip presented an opportunity for institutional investors to accumulate Bitcoin at more attractive price levels. Strategy’s purchase of $1.92 billion worth of BTC represents one of the largest single acquisitions in recent months, bringing their total holdings to 528,185 BTC.

    SPONSORED

    Trade Bitcoin with up to 100x leverage and maximize your profit potential

    Trade Now on Defx

    Market Implications and Technical Outlook

    The swift recovery from $81,000 suggests strong buying pressure at key support levels. Technical indicators point to continued institutional accumulation, with several key metrics showing bullish divergence.

    FAQ Section

    Q: What caused Bitcoin’s recent price dip?
    A: The weekend dip to $81,000 was primarily driven by profit-taking and temporary market uncertainty.

    Q: How significant is the institutional buying?
    A: The combined purchases from Strategy and Metaplanet total over $1.93 billion, representing substantial institutional confidence in Bitcoin.

    Q: What are the key support levels to watch?
    A: Current technical analysis indicates strong support at $81,000, with secondary support at $78,500.

    Looking Ahead

    With institutional buying providing strong support and market sentiment remaining positive, Bitcoin’s price action suggests potential for further upside. Traders and investors should monitor institutional flow data and technical levels for additional confirmation of the bullish trend.

  • XRP Price Alert: Technical Analysis Signals Major Support Test at $2

    XRP Price Alert: Technical Analysis Signals Major Support Test at $2

    Multiple cryptocurrencies including XRP, Ethereum Classic (ETC), Bitcoin Cash (BCH), and yearn.finance (YFI) are showing remarkably similar technical patterns that could signal significant price movements ahead. Let’s analyze what these patterns mean for XRP and the broader altcoin market.

    Critical Technical Patterns Emerge Across Major Altcoins

    According to renowned crypto analyst Ali Martinez, XRP is currently testing a crucial support level after forming what appears to be a textbook head-and-shoulders pattern. This development comes as XRP tests the critical $2 support level, making this technical analysis particularly timely for traders.

    SPONSORED

    Trade XRP with up to 100x leverage on perpetual contracts

    Trade Now on Defx

    Understanding the Head-and-Shoulders Pattern

    The head-and-shoulders pattern in XRP’s chart consists of three distinct peaks:

    • Left shoulder: Initial price peak
    • Head: Higher central peak
    • Right shoulder: Final peak at similar height to left shoulder

    Key Support Levels to Watch

    Asset Current Price Support Level Pattern Type
    XRP $2.06 $2.00 Head & Shoulders
    BCH Current Triangle Base Symmetrical Triangle
    ETC Current Channel Bottom Parallel Channel

    Market Implications and Trading Considerations

    The convergence of these patterns across multiple altcoins suggests a broader market trend that traders should monitor carefully. The current 16% weekly decline in XRP’s price adds weight to the bearish scenario suggested by the technical analysis.

    Frequently Asked Questions

    Q: What does a head-and-shoulders pattern typically indicate?
    A: This pattern usually signals a potential trend reversal from bullish to bearish when completed.

    Q: How reliable are these technical patterns?
    A: While technical patterns provide valuable insights, they should be used alongside other analysis tools and indicators for confirmation.

    Q: What’s the next major support level if $2 breaks?
    A: Traders should watch the previous consolidation zone around $1.80 as the next significant support level.

    Conclusion

    As XRP and its peers approach critical technical junctures, traders should maintain strict risk management practices and watch for confirmation of these patterns before making trading decisions. The next few days will be crucial in determining whether these technical signals result in the predicted market movements.

  • Dogecoin Price Drops 3.8% as Musk Clarifies D.O.G.E. Confusion

    Dogecoin Price Drops 3.8% as Musk Clarifies D.O.G.E. Confusion

    Elon Musk has officially addressed speculation surrounding Dogecoin’s potential involvement with the Department of Government Efficiency (D.O.G.E.), leading to a 3.8% price decline in the popular meme cryptocurrency. This development comes as technical analysts were previously tracking positive RSI patterns in DOGE.

    Key Takeaways:

    • Musk confirms no connection between Dogecoin and government efficiency initiative
    • DOGE price drops 3.8% following the clarification
    • Broader crypto market shows similar downward movement

    Musk’s Official Statement

    Speaking at an America PAC event in Green Bay, Wisconsin on March 30, 2025, Musk emphasized that the similarity between Dogecoin and the Department of Government Efficiency (D.O.G.E.) was purely coincidental. He explained that the department’s name evolved from the initially proposed ‘Government Efficiency Commission’ based on public feedback.

    “There are no plans for the government to use Dogecoin or anything like that as far as I know,” Musk stated definitively.

    Market Impact Analysis

    The cryptocurrency market responded to Musk’s clarification with a broader selloff:

    • Dogecoin: -3.8%
    • Bitcoin: -3.0%
    • Ethereum: -4.0%
    • Ripple: -3.0%

    SPONSORED

    Trade Dogecoin with up to 100x leverage on perpetual contracts

    Trade Now on Defx

    Expert Analysis

    Cryptocurrency analysts suggest that while the D.O.G.E. rumors may have contributed to recent price movements, fundamental market factors remain the primary drivers. The current price action appears to be part of a natural market correction rather than a direct response to Musk’s statements.

    Looking Ahead

    Despite the short-term price decline, technical indicators suggest strong support levels remain intact. Traders are advised to monitor key resistance levels and broader market sentiment for potential recovery signals.

    FAQ

    Will this affect Dogecoin’s long-term value?

    Analysts suggest the impact will likely be temporary, with fundamental factors driving long-term value.

    Is there any possibility of future government adoption?

    While currently denied, cryptocurrency adoption in government sectors remains an evolving situation.

    How does this compare to previous Musk-related Dogecoin events?

    Historical data shows Musk’s statements typically cause short-term volatility but rarely impact long-term trends.