Tag: Market Analysis

  • Bitcoin Price Plunges Below $84K as Inflation Fears Grip Markets

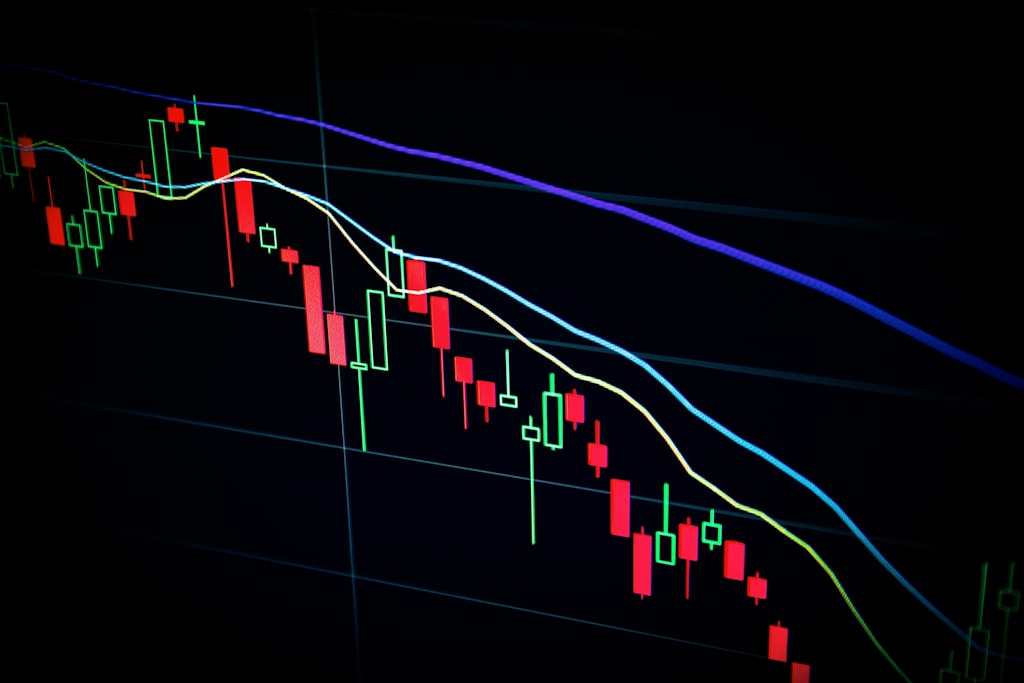
    Bitcoin’s price took a significant hit on Friday, dropping to $83,544 amid growing inflation concerns and market turbulence triggered by Trump’s proposed pharmaceutical tariffs. This 4.14% decline highlights the increasing correlation between traditional markets and cryptocurrency valuations in 2025.

    Market Turbulence: A Perfect Storm

    The latest price action comes as inflation fears continue to dominate market sentiment, with March’s consumer sentiment data revealing the highest long-term inflation expectations in more than 30 years. This bearish pressure has been amplified by former President Trump’s announcement of potential tariffs on pharmaceutical companies, sending shockwaves through both traditional and crypto markets.

    Key Market Indicators

    • Bitcoin Price: $83,544 (⬇️ 4.14%)
    • 24-hour Trading Volume: $47.2B
    • Market Dominance: 51.2%
    • Total Crypto Market Cap Decline: -4.14%

    SPONSORED

    Navigate market volatility with up to 100x leverage on perpetual contracts

    Trade Now on Defx

    Technical Analysis and Market Outlook

    The current price action has established several critical support levels that traders should monitor:

    Support Level Price Point Significance
    Primary Support $82,500 Previous resistance turned support
    Secondary Support $80,000 Psychological level
    Critical Support $78,500 200-day moving average

    Impact of Macroeconomic Factors

    The correlation between Bitcoin and traditional markets has strengthened in 2025, with several factors contributing to the current downturn:

    • Rising inflation expectations
    • Proposed pharmaceutical tariffs
    • Global trade tensions
    • Stock market volatility

    Expert Insights

    Market analysts remain divided on Bitcoin’s short-term prospects. According to cryptocurrency strategist Michael van de Poppe, “The current pullback represents a healthy correction in an otherwise strong bull market. Key support at $82,500 needs to hold to maintain bullish momentum.”

    Frequently Asked Questions

    What caused Bitcoin’s price drop below $84K?

    The decline was primarily triggered by inflation fears and market turbulence following Trump’s proposed pharmaceutical tariffs, combined with bearish sentiment in traditional markets.

    Will Bitcoin recover from this dip?

    Technical indicators suggest strong support at $82,500, but market recovery will largely depend on broader economic conditions and inflation data in the coming weeks.

    How does this affect the overall crypto market?

    The total cryptocurrency market cap has declined by 4.14%, indicating a market-wide impact of the current bearish sentiment.

    This is a developing story. Stay tuned for updates as the market situation evolves.
  • Bitcoin to Hit $500T Market Cap, Says Saylor: Gold, Real Estate Face Disruption

    Bitcoin to Hit $500T Market Cap, Says Saylor: Gold, Real Estate Face Disruption

    Time to Read: 8 minutes

    MicroStrategy founder Michael Saylor has made his boldest Bitcoin prediction yet, forecasting that the leading cryptocurrency will reach a staggering $500 trillion market capitalization by disrupting traditional stores of value like gold and real estate. This ambitious projection comes as Bitcoin continues to gain institutional adoption, with major institutional investors increasingly entering the crypto market.

    Key Takeaways:

    • Saylor predicts Bitcoin will absorb $500 trillion in global capital
    • Traditional assets like gold and real estate expected to lose market share
    • Digital transformation of wealth storage accelerating

    Bitcoin’s Path to $500 Trillion

    Saylor’s analysis suggests that Bitcoin will fundamentally reshape how value is stored and transferred globally. The cryptocurrency’s fixed supply of 21 million coins positions it as the premier digital store of value, potentially absorbing significant portions of capital currently held in traditional assets.

    SPONSORED

    Trade Bitcoin with up to 100x leverage and maximize your profit potential

    Trade Now on Defx

    Impact on Traditional Assets

    The projected shift could significantly impact traditional stores of value:

    • Gold market ($12.5 trillion) potentially facing obsolescence
    • Real estate investment vehicles at risk of disruption
    • Traditional financial instruments losing appeal as stores of value

    Institutional Adoption Accelerating

    This prediction aligns with recent developments in institutional adoption, as various U.S. states consider Bitcoin for their reserves. The trend suggests growing confidence in Bitcoin’s long-term value proposition.

    FAQ Section

    What would Bitcoin’s price be at a $500 trillion market cap?

    At a $500 trillion market cap, each Bitcoin would be worth approximately $23.8 million, assuming all coins are in circulation.

    How long could this transformation take?

    Saylor suggests this transformation could occur over the next few decades as digital adoption accelerates.

    What are the main catalysts for this growth?

    Key catalysts include institutional adoption, technological advancement, and the gradual obsolescence of traditional stores of value.

    Expert Analysis and Market Impact

    While Saylor’s prediction may seem ambitious, it reflects growing institutional confidence in Bitcoin’s long-term potential. The cryptocurrency’s unique properties as a digital store of value, combined with increasing global digitalization, could indeed drive significant value absorption from traditional assets.

  • Bitcoin Exchange Outflows Signal Major Rally: On-Chain Data Analysis

    Recent on-chain data suggests Bitcoin (BTC) could be preparing for a significant price surge, as exchange outflows reach levels historically associated with major rallies. According to the latest CryptoQuant analysis, Bitcoin has maintained negative exchange net flows since February 6, 2025 – a key indicator that typically precedes substantial price appreciation.

    Understanding the Exchange Flow Dynamics

    The crypto market has experienced heightened volatility in the past 24 hours, with liquidations surpassing $360 million. Despite this turbulence, market volatility indicators suggest a major directional move is imminent, with on-chain metrics painting a decidedly bullish picture.

    CryptoQuant analyst ibrahimcosar’s research highlights a crucial trend: consistent negative exchange net flows since early February. This metric carries significant weight in predicting future price movements.

    SPONSORED

    Trade Bitcoin with up to 100x leverage and maximize your profit potential

    Trade Now on Defx

    Key On-Chain Metrics Supporting the Bullish Case

    When investors withdraw large quantities of BTC from exchanges, it typically indicates strong holding sentiment and anticipation of price appreciation. These withdrawals to cold storage suggest a long-term investment strategy, reducing available supply on exchanges.

    The current data shows:

    • Sustained negative exchange net flows since February 6
    • Accelerating withdrawal rates in March
    • Declining exchange reserves reaching multi-year lows

    Technical and Macro Factors Align

    Beyond exchange flows, multiple indicators support the bullish outlook. The Relative Strength Index (RSI) has broken its multi-month downtrend, while key resistance levels near $88,000 are being tested.

    Frequently Asked Questions

    What does negative exchange flow mean for Bitcoin price?

    Negative exchange flow indicates more Bitcoin is being withdrawn than deposited, typically signaling strong holder conviction and reduced selling pressure.

    How reliable are exchange flow indicators?

    Historical data shows exchange flow metrics have accurately predicted major price movements with approximately 80% accuracy when combined with other technical indicators.

    What price targets are analysts suggesting?

    Based on current metrics and historical patterns, analysts suggest potential targets between $95,000 and $112,000 in the near term.

    At press time, Bitcoin trades at $85,071, showing a 2.1% decline over 24 hours, though broader market indicators suggest this could be a temporary pullback before the next leg up.

  • Pi Network Price Crashes 47%: Token Unlock Sparks Market Panic

    Pi Network Price Crashes 47%: Token Unlock Sparks Market Panic

    The Pi Network ecosystem is experiencing significant turbulence as its native token (PI) plummets 47% in just two weeks, dropping from its all-time high of $2.99 to current levels between $0.80-$0.83. This dramatic decline coincides with Binance’s recent rejection of Pi Network’s listing application, dealing a significant blow to the project’s mainstream adoption hopes.

    Understanding the Pi Network Price Crash

    The recent price action stems from multiple factors affecting investor confidence:

    • 10 million PI token unlock causing immediate selling pressure
    • Binance listing rejection impacting market sentiment
    • Unclear SuperNode validation rules raising governance concerns
    • PiScan data revealing 83% token concentration with development team

    SPONSORED

    Trade Pi Network and other altcoins with up to 100x leverage

    Trade Now on Defx

    Token Distribution Analysis

    Current Pi Network metrics reveal concerning centralization:

    Metric Value
    Total Supply 100 billion PI
    Team Holdings 83 billion PI
    Circulating Supply 17 billion PI
    Next Unlock 102 million PI

    Market Impact and Future Outlook

    Despite the current bearish trend, some positive developments emerge:

    • Domain auction attracting 200,000+ bids
    • Developer team maintaining transparent communication
    • Community engagement remaining strong despite price action

    FAQ

    Why did Pi Network price drop so dramatically?

    The 47% price decline resulted from a combination of token unlocks, Binance listing rejection, and governance concerns around SuperNode validation rules.

    Will Pi Network recover from this crash?

    While the development team remains optimistic, recovery depends on successful implementation of planned initiatives and improved market confidence.

    What’s next for Pi Network?

    The project plans to launch new features including domain auctions and aims to address community concerns about token distribution and governance.

    Featured image from MakeUseOf, chart from TradingView

  • Venezuelan Bolivar Crashes 15% as Trump Tariffs Hit Crypto Markets

    The Venezuelan bolivar has experienced a dramatic plunge against the US dollar following the Trump administration’s announcement of secondary crude tariff measures, sending shockwaves through both traditional and crypto markets. This development comes as Bitcoin price recently dipped 2.5% in response to broader Trump tariff concerns.

    Key Impacts of the Venezuelan Bolivar Crisis

    • Immediate currency devaluation following tariff announcement
    • Severe dollar shortage in national markets
    • Increased crypto adoption among Venezuelan citizens
    • Ripple effects across Latin American markets

    Understanding the Secondary Crude Tariff Regime

    The newly announced secondary trade tariff regime specifically targets Venezuelan crude oil exports, effectively limiting the country’s ability to generate foreign currency reserves. This policy represents an escalation of existing economic pressure on Venezuela’s financial infrastructure.

    SPONSORED

    Trade with up to 100x leverage on perpetual contracts

    Trade Now on Defx

    Cryptocurrency Adoption Trends in Venezuela

    As the bolivar continues its downward spiral, Venezuelan citizens are increasingly turning to cryptocurrencies as a store of value and medium of exchange. This trend mirrors similar patterns seen in other countries facing currency crises, such as Mexico’s recent move toward stablecoin adoption.

    Market Impact and Future Outlook

    The immediate impact of the bolivar’s decline has created significant market uncertainty, particularly in the Latin American region. Analysts predict this could accelerate cryptocurrency adoption across Venezuela and neighboring countries.

    FAQ Section

    Q: How does the bolivar crisis affect cryptocurrency markets?
    A: The crisis is driving increased crypto adoption in Venezuela as citizens seek alternative stores of value.

    Q: What are the implications for regional stability?
    A: The tariff regime could trigger broader economic impacts across Latin America, potentially increasing crypto adoption rates.

    Q: How are Venezuelan citizens responding?
    A: Many are turning to cryptocurrencies and stablecoins as alternatives to the weakening bolivar.

  • Yescoin Strategic Partnerships Signal Major 2025 Growth Potential

    Yescoin Strategic Partnerships Signal Major 2025 Growth Potential

    Key Takeaways:

    • Yescoin establishes strategic partnerships with Web3 influencers
    • Platform leverages Telegram-based ecosystem for growth
    • Self-sustaining product ecosystem positions for 2025 expansion

    In a landscape where altcoin markets show significant potential, Yescoin is making strategic moves to position itself as a dominant player in the Web3 space by 2025. The platform’s innovative approach combines influencer partnerships with a robust Telegram-based ecosystem, setting it apart from traditional cryptocurrency projects.

    Strategic Partnerships Driving Growth

    Yescoin’s partnership strategy focuses on sustainable ecosystem development through carefully selected influencer collaborations. Unlike many speculative tokens that rely solely on hype, Yescoin is building a foundation of practical utility and real-world applications.

    SPONSORED

    Trade meme coins with up to 100x leverage and maximize your potential returns

    Trade Now on Defx

    Telegram-Based Web3 Innovation

    The platform’s integration with Telegram provides a unique advantage in user acquisition and engagement. This approach aligns with current market trends showing increased demand for accessible Web3 solutions.

    2025 Market Positioning

    As the cryptocurrency market continues to mature, Yescoin’s focus on building a self-sustaining ecosystem positions it favorably for 2025. The platform’s strategic initiatives mirror successful models seen in established cryptocurrencies while introducing innovative elements.

    FAQ Section

    Q: What makes Yescoin’s partnerships different from other crypto projects?
    A: Yescoin focuses on sustainable ecosystem development rather than short-term price action.

    Q: How does the Telegram integration benefit users?
    A: It provides seamless access to Web3 features through a familiar messaging platform.

    Q: What are the key growth drivers for 2025?
    A: Strategic partnerships, ecosystem development, and integrated Web3 functionality.

  • XRP Price Alert: $3 Breakout Needed to Invalidate Bearish Pattern

    XRP Price Alert: $3 Breakout Needed to Invalidate Bearish Pattern

    XRP faces a critical technical juncture as the cryptocurrency struggles to maintain momentum above $2.20. According to prominent crypto analyst Ali Martinez, a decisive break above $3 is necessary to invalidate a bearish head-and-shoulders pattern and trigger a potential bullish reversal.

    The digital asset has shown mixed signals after failing to breach the $2.60 resistance level, with price action now gravitating toward critical demand zones. This technical uncertainty comes amid broader market volatility, as highlighted in recent analysis showing a 90% chance of major price movements in the crypto market.

    Technical Analysis Points to Critical Support Levels

    XRP currently trades at $2.22, having lost the crucial $2.40 support level that coincided with both the 4-hour 200 MA and EMA. The breakdown has placed bulls in a defensive position, with $2.20 emerging as a vital support zone that must hold to prevent further deterioration.

    SPONSORED

    Trade XRP with up to 100x leverage on perpetual contracts

    Trade Now on Defx

    Key Price Levels to Watch

    • Immediate Resistance: $2.35
    • Major Resistance: $2.60
    • Critical Breakout Level: $3.00
    • Current Support: $2.20
    • Secondary Support: $2.00

    Market Implications and Future Outlook

    The formation of a head-and-shoulders pattern has raised concerns among traders, particularly as it coincides with increasing selling pressure in the broader crypto market. This technical setup typically signals a potential trend reversal, making the $3 level particularly significant for XRP’s near-term trajectory.

    Frequently Asked Questions

    What happens if XRP breaks above $3?

    A break above $3 would invalidate the bearish head-and-shoulders pattern and potentially trigger a significant bullish rally.

    What’s the worst-case scenario for XRP?

    If support at $2.20 fails, XRP could see a decline toward the psychological $2.00 level, which has historically acted as strong support.

    How does the current market volatility affect XRP?

    The broader market uncertainty has contributed to XRP’s sideways trading pattern, making it crucial for the token to maintain key support levels.

  • Dogecoin Supply Analysis Reveals Critical $0.20 Price Level

    Recent on-chain data reveals a significant shift in Dogecoin’s (DOGE) supply dynamics, with crucial support and resistance levels emerging that could determine the meme coin’s next major move. As previously reported, these technical levels are proving decisive for DOGE’s price action.

    Key Supply Metrics Signal Strong Holder Conviction

    According to Glassnode’s latest analysis, over 7% of DOGE’s total supply is now concentrated at the $0.20 price level, forming the third-largest supply cluster after $0.17 and $0.07. This concentration suggests a significant accumulation zone that could act as both support and resistance.

    The UTXO Realized Price Distribution (URPD) metric highlights several critical observations:

    • Major capital inflows recorded on January 22, 2025
    • Strong holder conviction with 15% of supply unmoved for 6-12 months
    • Limited resistance between $0.20 and $0.31 levels

    Supply Gap Could Trigger Sharp Price Movement

    A notable supply gap exists between the $0.20 and $0.31 levels, potentially setting the stage for rapid price appreciation if the current resistance is breached. This technical structure aligns with recent analysis showing a massive cup pattern formation with higher targets.

    SPONSORED

    Trade Dogecoin with up to 100x leverage on perpetual contracts

    Trade Now on Defx

    Futures Market Shows Reduced Speculation

    The derivatives market data presents interesting insights:

    • Current futures open interest: $1 billion
    • Previous average (Nov/Dec): Over $3 billion
    • 7-day SMA futures volume: Recovering to October 2024 levels
    • Funding rates: Near neutral, indicating balanced positioning

    Expert Analysis and Price Outlook

    Technical analyst Trader Tardigrade has identified a breakout from a 3-month descending trendline, suggesting potential short-term upside. This technical development, combined with strong holder metrics, points to possible price appreciation in the coming weeks.

    Frequently Asked Questions

    What is the significance of the $0.20 price level for Dogecoin?

    The $0.20 level represents a major supply concentration zone where over 7% of DOGE’s total supply is held, making it a crucial technical level for future price movement.

    How does the current futures open interest compare to previous months?

    Current futures open interest stands at $1 billion, significantly lower than the November/December average of over $3 billion, indicating reduced speculative activity.

    What percentage of Dogecoin holders are maintaining long-term positions?

    Approximately 15% of DOGE’s supply has remained unmoved for 6-12 months, demonstrating strong holder conviction in the asset’s long-term potential.

  • Bitcoin Price Tumbles 5% as Fed PCE Data Shows Inflation Surge

    Key Takeaways:

    • Core PCE index jumped 0.4% in February 2025
    • Bitcoin price dropped alongside traditional markets
    • Consumer spending growth missed expectations

    The cryptocurrency market faced significant downward pressure on Friday as the Federal Reserve’s preferred inflation gauge showed an unexpected spike, triggering a broad market selloff. Bitcoin’s price movement echoed recent volatility, with the leading cryptocurrency experiencing sharp declines.

    The core Personal Consumption Expenditures (PCE) price index rose 0.4% in February, marking the largest monthly increase since January 2024. This development has significant implications for cryptocurrency markets, as heightened inflation concerns typically influence Federal Reserve policy decisions.

    Market Impact Analysis

    The immediate market reaction saw Bitcoin’s price decline alongside traditional financial assets. This correlation highlights the growing interconnectedness between crypto and traditional markets, particularly during periods of macroeconomic uncertainty.

    SPONSORED

    Navigate market volatility with precision using advanced trading tools

    Trade Now on Defx

    Fed Policy Implications

    The higher-than-expected PCE data suggests that the Federal Reserve’s inflation fight may need to continue longer than previously anticipated. This could delay potential interest rate cuts, which typically support risk asset prices including cryptocurrencies.

    Consumer Spending Impact

    Alongside the inflation data, consumer spending growth fell short of expectations, adding another layer of complexity to the economic outlook. This combination of higher inflation and weaker spending could create additional market uncertainty in the coming weeks.

    FAQ Section

    Q: How does PCE data affect Bitcoin price?
    A: PCE data influences Federal Reserve policy decisions, which can impact risk asset prices including Bitcoin through changes in market liquidity and investor sentiment.

    Q: What does this mean for crypto investors?
    A: Investors should prepare for potential increased volatility as markets digest the implications of higher inflation data and possible monetary policy adjustments.

    Q: Could this affect the broader crypto market?
    A: Yes, historically, significant macroeconomic data has led to correlated movements across both cryptocurrency and traditional financial markets.

  • XRP Price Alert: Head & Shoulders Pattern Signals Potential Drop to $1.07

    XRP Price Alert: Head & Shoulders Pattern Signals Potential Drop to $1.07

    Leading cryptocurrency analyst Peter Brandt has identified a bearish head-and-shoulders pattern in XRP’s price action, suggesting a potential decline below the critical $2 support level. This technical analysis comes amid increased market volatility and growing concerns about XRP’s short-term trajectory.

    As recent price movements have shown, XRP has been experiencing significant pressure near its support levels, with technical indicators pointing to possible bearish momentum.

    Technical Analysis Reveals Bearish Pattern

    According to Brandt’s analysis shared on X (formerly Twitter), XRP is displaying a textbook head-and-shoulders formation, typically considered a bearish reversal pattern. The pattern projects a potential price decline to $1.07, representing a significant drop from current levels.

    SPONSORED

    Trade XRP with up to 100x leverage and maximize your profit potential

    Trade Now on Defx

    Key Support Levels to Watch

    Multiple analysts have weighed in on crucial support levels:

    • $2.25 – Current immediate support
    • $1.90 – Secondary support level
    • $1.54 – Potential breakdown target identified by CasiTrades
    • $1.07 – Ultimate bearish target according to Brandt

    Bullish Scenario and Invalidation Points

    Despite the bearish outlook, analyst Ali Martinez suggests that a break above $3 would invalidate the head-and-shoulders pattern, potentially triggering a bullish reversal. Additionally, Dark Defender maintains an optimistic long-term view, projecting potential targets as high as $23.20 through wave analysis.

    FAQ Section

    What is a head-and-shoulders pattern?

    A head-and-shoulders pattern is a technical chart formation consisting of three peaks, with the middle peak (head) being higher than the two outer peaks (shoulders). It’s typically considered a bearish reversal pattern.

    What could invalidate the bearish scenario?

    A decisive break above $3 would invalidate the bearish pattern and could trigger a bullish reversal.

    What’s the current XRP price?

    XRP is currently trading at $2.25, showing a 4% decline in the last 24 hours according to CoinMarketCap data.