Tag: Market Analysis

  • Bitcoin Eyes $95K: Market Greed Hits Peak as Miners Hold Strong

    Bitcoin Eyes $95K: Market Greed Hits Peak as Miners Hold Strong

    Bitcoin’s meteoric rise to $88,500 has ignited fresh speculation about an imminent push to $95,000, though market indicators suggest caution may be warranted. Recent analysis of key resistance zones points to potential consolidation before the next major move.

    Market Sentiment: Greed Takes Center Stage

    According to Santiment’s latest market intelligence data, crypto investors are displaying increasing signs of greed, with social media mentions of Bitcoin reaching $100,000 or even $159,000 flooding platforms. This surge in optimistic sentiment comes after Bitcoin’s recovery from February lows of $78,000.

    However, as historical market metrics indicate, extreme greed often precedes significant price corrections. Traders should exercise caution as these sentiment peaks typically signal potential market adjustments.

    Mining Community Shows Confidence

    A particularly bullish signal comes from the mining sector, where CryptoQuant data reveals miners are holding onto their Bitcoin reserves, now totaling 1.81 million BTC (approximately $159 billion). This accumulation behavior suggests miners anticipate higher prices ahead.

    SPONSORED

    Trade Bitcoin with up to 100x leverage and maximize your profit potential

    Trade Now on Defx

    Institutional Momentum Builds

    The institutional landscape continues to strengthen, with U.S. Bitcoin spot ETFs recording significant inflows. BlackRock led the charge with $42 million in daily inflows, pushing their total net assets above $50 billion. Despite outflows from smaller players like Bitwise and WisdomTree, the overall trend remains positive.

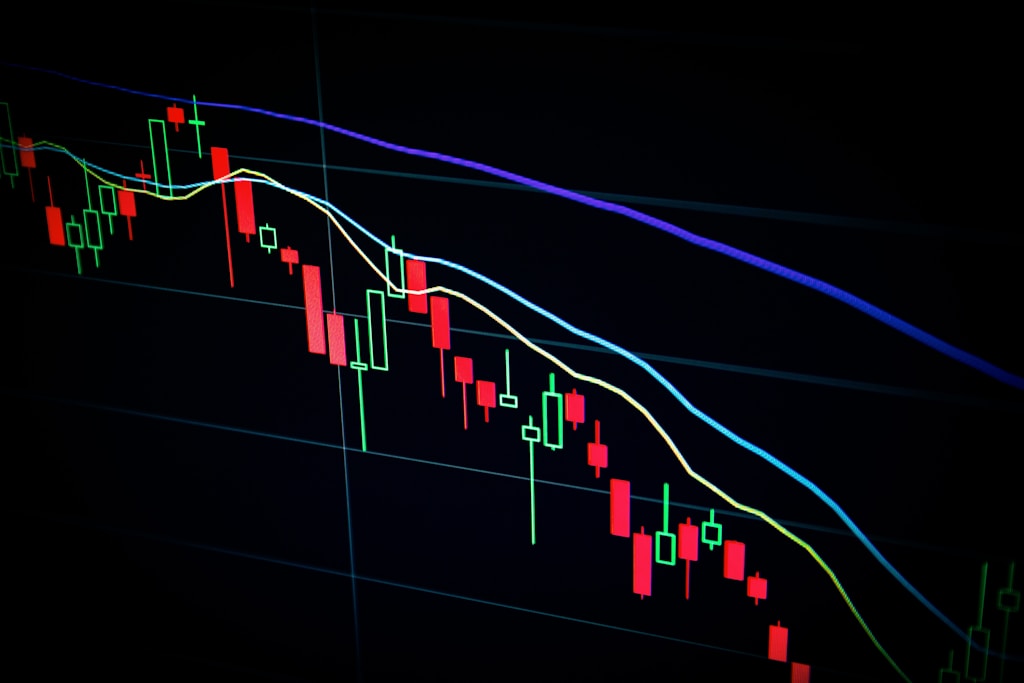
    Technical Analysis Points to Consolidation

    Short-term technical indicators suggest Bitcoin might need to consolidate before attempting the push to $95,000. The formation of a double top pattern on the 4-hour chart indicates potential resistance, with support at $86,146 serving as a crucial level to watch.

    FAQ Section

    Q: What is causing Bitcoin’s current price surge?
    A: A combination of strong institutional demand, miner accumulation, and positive market sentiment are driving the current rally.

    Q: Could Bitcoin reach $95,000 in the near term?
    A: While technical indicators suggest potential for reaching $95,000, a period of consolidation may occur first, with key support at $86,146.

    Q: What are the main risks to consider?
    A: High levels of market greed, technical resistance patterns, and historical tendency for corrections after such rallies are the primary risk factors.

  • Bitcoin Best Time to Buy Now as Last Risk Removed, Says Bitwise

    Bitcoin Best Time to Buy Now as Last Risk Removed, Says Bitwise

    Investment giant Bitwise Asset Management has declared that now represents “the best time in history” to invest in Bitcoin, citing the removal of the last major risk factor through recent US government actions. In a groundbreaking investor memo titled “The Great Derisking of Bitcoin,” Bitwise CIO Matt Hougan presents compelling evidence for Bitcoin’s maturation into a mainstream asset class.

    This assessment comes as US Bitcoin reserve plans take shape amid broader financial shifts, marking a pivotal moment in cryptocurrency’s evolution from a speculative investment to a strategic national asset.

    The Evolution of Bitcoin’s Risk Profile

    Hougan’s analysis traces Bitcoin’s journey from its early days when investing $1,000 could have yielded $88 million today, to its current status as an increasingly derisked asset. The transformation has been marked by several key milestones:

    • Enhanced custody solutions and trading infrastructure
    • Regulatory clarity through spot ETF approvals
    • Institutional adoption and mainstream acceptance
    • Government strategic alignment through the US Bitcoin Reserve initiative

    SPONSORED

    Trade Bitcoin with up to 100x leverage on perpetual contracts

    Trade Now on Defx

    Institutional Allocation Trends

    The report highlights a significant shift in institutional investment patterns, with Bitcoin allocations moving from 1% to 3% of portfolios. This trend aligns with recent price predictions targeting $110K, suggesting growing institutional confidence in Bitcoin’s long-term value proposition.

    FAQs About Bitcoin Investment Timing

    Q: Why is now considered the best time to invest in Bitcoin?
    A: The removal of major risk factors, including regulatory uncertainty and government opposition, has created an unprecedented opportunity for investment with reduced risk.

    Q: What percentage should investors allocate to Bitcoin?
    A: Bitwise suggests allocations may rise from current 3% levels to 5% or higher as institutional adoption increases.

    Q: How has the US government’s stance affected Bitcoin’s risk profile?
    A: The establishment of a US Strategic Bitcoin Reserve has effectively eliminated the risk of an outright ban, significantly reducing political and regulatory uncertainty.

    Market Implications

    At press time, Bitcoin trades at $87,865, reflecting strong market fundamentals and increased institutional interest. The removal of existential risks, combined with growing mainstream adoption, suggests potential for continued price appreciation in the medium to long term.

  • Tokenization Market Shows Strong Fundamentals, Says Hashgraph CEO

    Time to Read: 8 minutes

    The CEO of Hashgraph has taken a bold stance on the future of tokenization, arguing that unlike previous crypto market cycles, the current tokenization trend represents a fundamental shift in how digital assets will reshape traditional markets.

    This perspective comes at a crucial time, as tokenized treasuries recently surpassed $5 billion in value, with major players like Fidelity joining the real-world asset (RWA) revolution.

    Why Tokenization Is Different From Previous Crypto Cycles

    The Hashgraph CEO draws important distinctions between the current tokenization wave and previous crypto market cycles:

    • Infrastructure maturity and institutional adoption
    • Regulatory clarity in major markets
    • Real-world use cases with measurable impact
    • Integration with traditional finance systems

    Key Market Indicators Supporting Sustainable Growth

    Several factors indicate the tokenization market’s stability:

    Indicator Impact
    Institutional Investment Growing steadily
    Regulatory Framework Increasingly clear
    Market Infrastructure More robust

    SPONSORED

    Trade tokenized assets with up to 100x leverage on perpetual contracts

    Trade Now on Defx

    FAQ: Understanding Tokenization Market Dynamics

    What makes tokenization different from ICOs?

    Unlike ICOs, tokenization represents actual assets with inherent value, backed by legal frameworks and regulatory oversight.

    How are institutions approaching tokenization?

    Major financial institutions are developing comprehensive tokenization strategies, focusing on real-world assets and securities.

    What are the key risks to consider?

    While the fundamentals are strong, regulatory changes and technical challenges remain important considerations.

    Looking Ahead: Tokenization Market Projections

    Industry analysts project the tokenization market to reach $16.1 trillion by 2030, driven by:

    • Real estate tokenization growth
    • Securities market transformation
    • Cross-border transaction efficiency
    • Emerging market opportunities
  • Bitcoin Price Eyes 14% Jump to $100K as Key $90K Level Nears

    Bitcoin Price Eyes 14% Jump to $100K as Key $90K Level Nears

    Bitcoin (BTC) has demonstrated remarkable resilience, climbing nearly 5% over the past week and setting its sights on a potential 14% surge to the coveted $100,000 level. The leading cryptocurrency’s recent price action suggests a significant breakout could be imminent as it approaches crucial resistance zones.

    Bitcoin’s Technical Setup Shows Bullish Momentum

    After successfully reclaiming the $84,000-$85,000 range that had previously acted as resistance, Bitcoin has established a solid foundation for further upward movement. The flagship cryptocurrency has maintained steady momentum, breaking above $88,000 and showing signs of strength at current levels.

    SPONSORED

    Maximize your trading potential with up to 100x leverage on perpetual contracts

    Trade Now on Defx

    Critical Price Levels to Watch

    According to analyst Alex Clary, Bitcoin’s technical indicators are aligning favorably, with the cryptocurrency showing:

    • RSI bullish divergence
    • V-shaped recovery pattern
    • Breakout above downtrend resistance
    • Strong support at $86,000

    Weekly Close Requirements for Continued Uptrend

    Rekt Capital’s analysis highlights two critical levels that Bitcoin needs to secure:

    • $88,400 (21-week EMA)
    • $93,500 (Re-Accumulation Range Low)

    Market Correlation and External Factors

    The cryptocurrency’s correlation with traditional markets, particularly the S&P 500, continues to play a significant role in its price action. This relationship suggests broader market sentiment remains a key driver for Bitcoin’s movements.

    FAQ Section

    Q: What is the next major resistance level for Bitcoin?
    A: The $90,000 level represents the next significant resistance, with $93,500 being a crucial technical target.

    Q: What could trigger the projected 14% price increase?
    A: A successful break and hold above $90,000, combined with positive technical indicators and market sentiment, could fuel the rally to $100,000.

    Q: What are the key support levels to monitor?
    A: The primary support zones are at $86,000 and $88,400, with the latter being particularly significant as it aligns with the 21-week EMA.

    Conclusion

    As Bitcoin approaches the critical $90,000 resistance level, the technical setup suggests a potential 14% surge to $100,000 is within reach. However, traders should remain vigilant of key support levels and market correlations that could influence this projected movement.

  • Bitcoin Price Holds $85K: 4 Key Metrics Signal Market Direction

    Bitcoin continues to demonstrate resilience at the $85,000 level, with on-chain metrics providing crucial insights into the market’s next potential move. As recent price action tests key resistance zones, analysts are closely monitoring four critical indicators that could determine Bitcoin’s short-term trajectory.

    Market Overview: Bitcoin’s Current Position

    Bitcoin is maintaining stability around $87,000, experiencing only a minor 0.4% decline over the past 24 hours. This relative strength comes after the cryptocurrency briefly touched $88,000 earlier in the week, suggesting continued buying pressure despite market uncertainties.

    SPONSORED

    Maximize your trading potential with up to 100x leverage on perpetual contracts

    Trade Now on Defx

    Four Critical On-Chain Metrics Analysis

    1. Internal Funding Pressure (IFP)

    The IFP metric currently sits at 696K, below its 90-day SMA of 794K. Historical data suggests that crossing above the SMA90 typically precedes significant bullish momentum. The current positioning indicates potential accumulation phases before the next upward move.

    2. Bull & Bear Market Cycle Indicator

    Current readings show the DMA30 at -0.16 versus the DMA365 at 0.18. This divergence mirrors previous cycle patterns where temporary bearish signals preceded strong recoveries.

    3. Market Value to Realized Value (MVRV)

    The MVRV score remains below its 365-day SMA, historically a precursor to increased market activity. While this might suggest near-term selling pressure, similar patterns during the August 2024 crisis resolved positively.

    4. Net Unrealized Profit/Loss (NUPL)

    With NUPL at 0.49 compared to its 0.53 moving average, the metric suggests room for growth while staying within healthy market parameters.

    Expert Analysis and Market Implications

    According to CryptoQuant analyst Burak Kesmeci, these metrics collectively indicate market turbulence but fall short of suggesting a cycle top. This analysis aligns with recent support level studies that point to strong fundamental backing at current prices.

    Looking Ahead: Market Scenarios

    While short-term uncertainty persists, the broader market structure remains intact. External factors, including recent economic developments and regulatory discussions, continue to influence price action. However, the technical framework suggests Bitcoin maintains the potential for continued upward momentum once current resistance levels are cleared.

    FAQ Section

    What do the current on-chain metrics suggest for Bitcoin’s price?

    The metrics indicate short-term turbulence but don’t suggest a market top, pointing to potential continuation of the broader uptrend once current resistance levels are cleared.

    How does the current market structure compare to previous cycles?

    Current indicators show similarities to previous accumulation phases, particularly the patterns observed during the 2024 market recovery.

    What are the key resistance levels to watch?

    The immediate resistance lies at $88,000, with secondary resistance at the recent high of $89,000.

  • Cardano (ADA) Price Targets $0.80 as Bulls Defend Key Support Level

    Cardano (ADA) is showing strong bullish momentum as the cryptocurrency maintains crucial support above $0.720, with technical indicators suggesting potential for a significant upward move. The latest price action analysis reveals multiple bullish signals that could propel ADA towards the $0.80 mark.

    Key Technical Developments for Cardano

    In a notable development that mirrors the broader crypto market recovery, where Bitcoin recently surged past $85,000, Cardano has established a solid foundation above the $0.720 support level. The asset is currently trading above both the $0.720 mark and the 100-hourly simple moving average, indicating strong underlying momentum.

    Critical Price Levels to Watch

    • Current Support: $0.7380
    • Key Resistance: $0.7550
    • Major Target: $0.80
    • Secondary Target: $0.850

    Technical Analysis Breakdown

    The formation of a bullish trend line with support at $0.7385 on the hourly chart suggests strong buyer presence. This technical structure, combined with the asset’s position above key moving averages, provides a solid foundation for potential upward movement.

    SPONSORED

    Trade ADA with up to 100x leverage on perpetual contracts

    Trade Now on Defx

    Resistance and Support Analysis

    The immediate resistance levels are structured as follows:

    • First resistance: $0.7550
    • Second resistance: $0.7620
    • Major psychological resistance: $0.80

    Support levels are equally well-defined:

    • Primary support: $0.7380
    • Secondary support: $0.7200
    • Critical support: $0.690

    Market Indicators and Signals

    Current technical indicators present a mixed but predominantly bullish picture:

    • MACD: Showing decreased bullish momentum but remains in the positive zone
    • RSI: Currently below 50, indicating potential for renewed buying pressure
    • Moving Averages: Price maintaining position above 100-hourly SMA

    Potential Scenarios and Price Targets

    Two primary scenarios emerge from the current technical setup:

    Bullish Scenario

    A successful break above $0.7620 could trigger a rally toward $0.80, with potential extension to $0.850. This scenario is supported by the current trend line and price action pattern.

    Bearish Scenario

    Failure to maintain support at $0.7380 could lead to a retest of $0.720, with $0.690 serving as the final support before more significant downside risk.

    FAQ Section

    What is the key level Cardano needs to break for a bullish continuation?

    The critical resistance level is $0.7550, followed by $0.7620. Breaking these levels could confirm the bullish trend.

    What are the major support levels to watch?

    The primary support levels are $0.7380 and $0.7200, with $0.690 serving as a critical support zone.

    Could Cardano reach $0.80 in the near term?

    Technical analysis suggests $0.80 is a realistic target if current support holds and resistance levels are broken successfully.

    Conclusion

    Cardano’s current technical setup presents a cautiously optimistic outlook, with potential for significant upside if key resistance levels are cleared. Traders should monitor the $0.7550 and $0.7620 levels closely while maintaining awareness of critical support at $0.7380.

  • Bitcoin Reserve Plans: Deutsche Bank Strategist Dismisses Trump Move

    Bitcoin Reserve Plans: Deutsche Bank Strategist Dismisses Trump Move

    Deutsche Bank’s macro strategist Marion Laboure has downplayed former President Trump’s proposed Bitcoin reserve strategy, characterizing it as a natural progression of cryptocurrency adoption rather than a groundbreaking development. This analysis comes amid increasing institutional interest in Bitcoin as a reserve asset.

    Key Points from Deutsche Bank’s Analysis

    Laboure, who serves as managing director and macro strategist at Deutsche Bank, emphasized that Trump’s Bitcoin reserve proposal aligns with broader US Bitcoin reserve plans that have been emerging amid global financial shifts. Her assessment suggests that the move represents a continuation of crypto market evolution rather than a revolutionary shift.

    Market Context and Implications

    This development follows several significant institutional moves into Bitcoin, including recent corporate treasury expansions into Bitcoin. The trend indicates growing mainstream acceptance of cryptocurrency as a legitimate reserve asset.

    SPONSORED

    Maximize your crypto trading potential with up to 100x leverage on perpetual contracts

    Trade Now on Defx

    Expert Analysis on Cryptocurrency Sustainability

    Laboure’s commentary included a cautionary note about the sustainability of many cryptocurrencies, predicting potential market corrections. This aligns with broader institutional perspectives on cryptocurrency market maturation.

    Frequently Asked Questions

    What is the significance of Bitcoin as a reserve asset?

    Bitcoin’s potential as a reserve asset lies in its fixed supply, decentralized nature, and growing institutional acceptance as a store of value.

    How does this relate to traditional reserve strategies?

    Traditional reserve strategies typically rely on gold and foreign currencies. Bitcoin represents a digital alternative that offers unique properties such as programmability and easier transfer.

    What are the risks of Bitcoin reserve strategies?

    Key risks include price volatility, regulatory uncertainty, and technological security considerations that institutions must carefully evaluate.

    Looking Ahead: Market Implications

    While Deutsche Bank’s position suggests measured optimism, the broader market continues to show increasing institutional interest in Bitcoin as a reserve asset. This trend could significantly impact future cryptocurrency adoption and integration into traditional financial systems.

  • XRP Price Tests $2.50 Resistance: Key Levels for Bullish Breakout

    XRP Price Tests $2.50 Resistance: Key Levels for Bullish Breakout

    XRP price is showing signs of recovery, testing critical resistance at $2.50 as bulls attempt to regain momentum. As highlighted in our previous XRP analysis, the cryptocurrency continues to face significant overhead resistance that could determine its next major move.

    XRP Price Analysis: Key Technical Levels

    The digital asset has established a series of higher lows, with current price action showing:

    • Strong support at $2.420 with the 100-hourly SMA acting as a buffer
    • Formation of a bullish trend line at $2.430
    • Critical resistance cluster between $2.480-$2.50
    • 50% Fibonacci retracement level providing intermediate support

    Bullish Scenario and Targets

    If bulls successfully breach the $2.50 resistance, XRP could target several key levels:

    • Initial target: $2.550
    • Secondary resistance: $2.650
    • Major psychological level: $2.80

    SPONSORED

    Trade XRP with up to 100x leverage on perpetual contracts

    Trade Now on Defx

    Bearish Risk Factors

    Traders should monitor these potential downside scenarios:

    • Break below $2.420 could trigger further selling
    • Critical support at $2.40 must hold to prevent deeper correction
    • Potential downside target at $2.350 if support fails

    Technical Indicators Overview

    Indicator Signal
    MACD Losing bullish momentum
    RSI Neutral at 50 level
    Moving Averages Trading above 100-hour SMA

    Frequently Asked Questions

    What is the key resistance level for XRP right now?

    The critical resistance level is at $2.50, with additional resistance at $2.480.

    Where is the strongest support level for XRP?

    The strongest support lies at $2.420, reinforced by the 100-hour Simple Moving Average.

    What could trigger an XRP breakout?

    A clear break above $2.50 with strong volume could trigger a rally toward $2.650 and potentially $2.80.

    Conclusion: While XRP shows promising recovery signs, the $2.50 resistance remains crucial for determining the next significant move. Traders should closely monitor volume and technical indicators for confirmation of any breakout or breakdown scenarios.

  • Bitcoin Breaks $88K: Key Resistance Zones Could Signal New ATH Push

    Bitcoin’s impressive rally continues as the leading cryptocurrency pushes past $88,000, marking a significant 10% gain over the past week. This surge comes amid increasing market volatility and critical on-chain resistance zones that could determine BTC’s path to new all-time highs.

    This latest price movement aligns with Bitcoin’s resilient performance despite recent market uncertainties, demonstrating the asset’s strengthening fundamentals.

    Critical On-Chain Resistance Levels Ahead

    According to data from IntoTheBlock, Bitcoin faces several key resistance zones that could impact its trajectory:

    • $88,355 – $90,920
    • $90,920 – $93,591
    • $93,591 – $96,262
    • $96,262 – $98,932
    • $98,932 – $101,603

    Particularly noteworthy is the $97,400 level, where approximately 1.44 million BTC are currently held at unrealized losses. This concentration of underwater positions could create significant selling pressure as prices approach this zone.

    SPONSORED

    Trade Bitcoin with up to 100x leverage and maximize your profit potential

    Trade Now on Defx

    Bullish Exchange Outflows Signal Strong HODLing

    Despite potential resistance ahead, on-chain metrics paint a bullish picture. Net outflows from centralized exchanges have exceeded $424 million in the past week, with $220 million occurring in the last 24 hours alone. This trend typically indicates investors moving assets to cold storage for long-term holding.

    Volatility Spike and Technical Outlook

    The 30-day volatility index has reached 52.31 points – its highest level in six months. This increased volatility, combined with the upcoming US Core PCE report, could trigger significant price movements in either direction.

    Expert Analysis and Price Targets

    Technical analysts remain divided on Bitcoin’s immediate trajectory. While some point to the $89,000 resistance level as a crucial hurdle, others identify emerging breakout patterns that could signal another powerful rally. Recent technical analysis suggests a potential push toward $109,000 if current momentum maintains.

    FAQ Section

    Q: What are the key resistance levels for Bitcoin?
    A: The main resistance zones are between $88,355 and $101,603, with special attention to the $97,400 level where 1.44M BTC are held at a loss.

    Q: What do the exchange outflows indicate?
    A: The $424M in weekly exchange outflows suggest investors are moving Bitcoin to long-term storage, typically a bullish signal.

    Q: How might the upcoming US Core PCE report affect Bitcoin?
    A: The report could introduce additional volatility and potentially influence Bitcoin’s price direction based on inflation data.

  • Bitcoin RSI Breaks Key Downtrend: $89K Resistance Tests Bulls

    Bitcoin RSI Breaks Key Downtrend: $89K Resistance Tests Bulls

    Bitcoin (BTC) has achieved a significant technical milestone by breaking its daily Relative Strength Index (RSI) downtrend, while trading in the high $80,000s. However, analysts warn that the leading cryptocurrency faces crucial resistance levels that could determine its next major move.

    Technical Breakthrough: RSI Signals Potential Trend Reversal

    After reaching a local bottom near $76,000 on March 10, Bitcoin has shown remarkable recovery strength. Similar to patterns observed in Summer 2024, the cryptocurrency’s technical indicators are suggesting a potential trend reversal.

    Crypto analyst Rekt Capital highlighted a critical development in Bitcoin’s daily chart – the breakout from a multi-month RSI downtrend that had been in place since early 2025. For traders and investors, the RSI serves as a key momentum indicator, helping identify potential overbought or oversold conditions.

    SPONSORED

    Maximize your trading potential with up to 100x leverage on perpetual contracts

    Trade Now on Defx

    Multiple Bullish Indicators Align

    Supporting the RSI breakout, the Bitcoin Hash Ribbons indicator has also turned bullish – a historically significant signal that has preceded major price rallies. This technical development suggests that Bitcoin miners are returning to the network after a period of capitulation, typically marking the end of bearish phases.

    Key Resistance Levels Ahead

    Despite the positive technical developments, seasoned analyst Ali Martinez identifies significant resistance around $89,000, where the 50-day moving average converges with the descending trendline from the all-time high. This level represents a critical test for Bitcoin’s current rally.

    Market Outlook and Price Targets

    Several analysts have shared their predictions for Bitcoin’s next moves:

    • Robert Mercer projects BTC reaching $100,000+ in Q2 2025
    • Maartunn emphasizes the importance of clearing $87,000 for sustained momentum
    • The M2 Guy points to expanding money supply as a potential catalyst

    FAQ Section

    What does the RSI breakout mean for Bitcoin?

    The RSI breakout suggests growing bullish momentum and could signal the end of the recent corrective phase.

    What are the key resistance levels to watch?

    The primary resistance cluster sits at $89,000, with secondary resistance at the psychological $90,000 level.

    When could Bitcoin reach $100,000?

    Analysts project potential achievement of $100,000 in Q2 2025, contingent on maintaining current momentum.

    At press time, Bitcoin trades at $87,674, showing a slight 0.7% decline over the past 24 hours as traders await confirmation of the technical breakout.