Tag: Market Analysis

  • Ethereum Crisis: $2K Support Test Sparks Panic! 📉

    Ethereum Crisis: $2K Support Test Sparks Panic! 📉

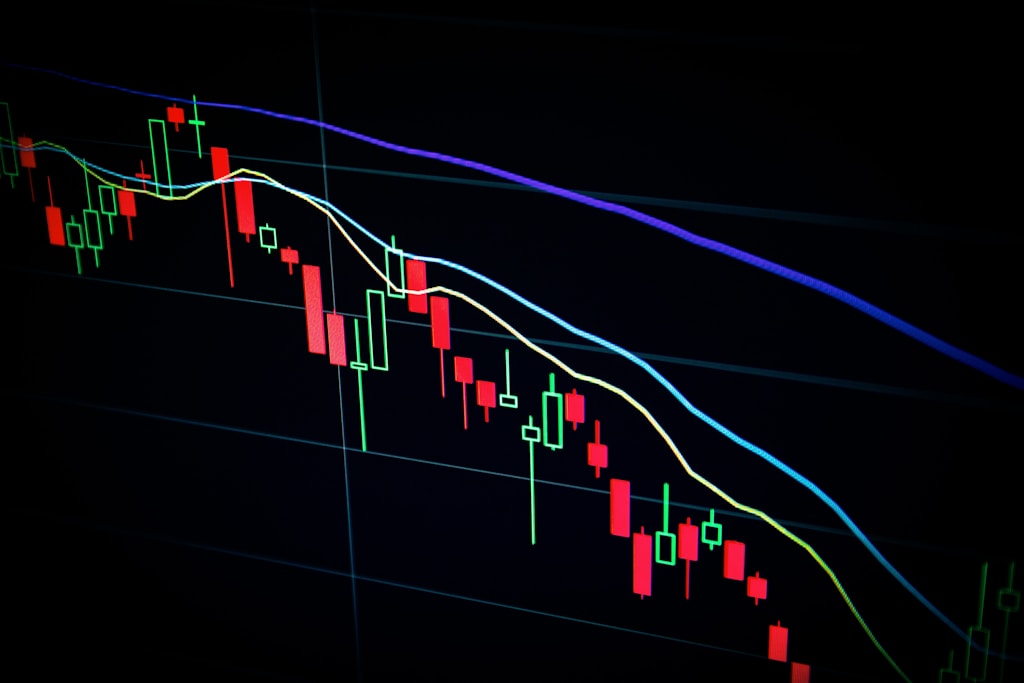
    Ethereum (ETH) faces a critical moment as the cryptocurrency plunges over 27% in just five days, testing a crucial $2,000 support level that could determine its trajectory for the coming months. Recent analysis had warned about this exact $2,000 support test, and now traders watch anxiously as this scenario unfolds.

    Market Sentiment Turns Fearful

    The second-largest cryptocurrency by market cap is currently trading at $2,120, down from its mid-December peak of $4,100. This dramatic 50% decline has triggered extreme fear in the market, with several key metrics suggesting further downside potential:

    • 27% price drop in under 5 days
    • Trading volume surge indicating panic selling
    • Fear & Greed Index reaching extreme fear levels
    • Key support at $2,000 under severe pressure

    Technical Analysis: Critical Support Zone

    Renowned analyst BigCheds has identified the $2,000 level as a critical monthly demand zone that must hold to prevent further capitulation. Historical price action shows this level has previously acted as a strong reversal point, making the current test particularly significant for ETH’s long-term outlook.

    SPONSORED

    Trade Ethereum with up to 100x leverage on perpetual contracts

    Trade Now on Defx

    Key Price Levels to Watch

    Traders should monitor these critical price levels:

    • Immediate Support: $2,000
    • First Resistance: $2,200
    • Key Recovery Level: $2,500
    • Previous Support Turned Resistance: $2,800

    Market Implications

    The current price action could have significant implications for the broader crypto market. A break below $2,000 could trigger a cascade of liquidations and potentially push ETH toward lower support levels. However, a successful defense of this zone could spark a relief rally, especially if broader market conditions improve.

    Expert Outlook

    Market analysts remain divided on Ethereum’s short-term prospects. While some predict a potential bounce from the $2,000 support, others warn of a deeper correction if this level fails to hold. The next few trading sessions will be crucial in determining whether ETH can stabilize and begin a recovery phase or if further downside is imminent.

    Traders and investors should maintain strict risk management practices given the current market volatility. The coming days will be critical in determining whether this support level becomes a launching pad for recovery or a stepping stone to lower prices.

  • AI War Heats Up: Tencent’s Speed Demon Shocks GPT-4!

    In a groundbreaking development that’s sending shockwaves through the AI industry, Chinese tech giant Tencent has unveiled Hunyuan Turbo S, a revolutionary AI model that’s not just matching but potentially surpassing leading competitors in terms of speed and capability. This announcement comes amid intensifying competition between Chinese and American AI developers, marking a significant milestone in the global AI race.

    Revolutionary Speed Meets Advanced Reasoning

    The new Hunyuan Turbo S model represents a quantum leap in AI performance, boasting:

    • Double the response speed of current models
    • Matching GPT-4’s reasoning capabilities
    • Enhanced efficiency in processing complex queries

    This development comes at a crucial time, as AI tokens are experiencing unprecedented market interest, highlighting the growing intersection between artificial intelligence and blockchain technology.

    Market Implications and Technical Analysis

    The announcement has significant implications for both the AI and crypto markets:

    • Potential impact on AI-focused cryptocurrencies and tokens
    • Increased competition in the AI infrastructure space
    • New opportunities for blockchain-AI integration

    Expert Perspectives

    Dr. Sarah Chen, AI Research Director at Digital Futures Institute, notes: “Tencent’s achievement with Hunyuan Turbo S represents a significant leap forward in AI capabilities. The doubled response speed while maintaining high accuracy is particularly impressive.”

    Marcus Thompson, Blockchain AI Integration Specialist, adds: “This development could accelerate the convergence of AI and blockchain technologies, potentially creating new use cases for decentralized AI applications.”

    SPONSORED

    Trade AI tokens with up to 100x leverage on perpetual contracts

    Trade Now on Defx

    Future Implications

    The emergence of Hunyuan Turbo S signals a new chapter in the AI arms race, with potential implications for:

    • Global AI development standards
    • Cross-border technology competition
    • Integration of AI in blockchain applications

    Source: Decrypt

  • Bitcoin ETF Panic: $276M Exodus Sparks Market Fear!

    In a concerning development for the cryptocurrency market, Bitcoin ETFs have recorded their eighth consecutive day of outflows, with investors withdrawing another $276 million. This sustained selling pressure coincides with recent market fears around Bitcoin’s $80K support level, raising questions about institutional confidence in digital assets.

    Key Outflow Statistics:

    • Bitcoin ETFs: $276 million withdrawn
    • Ethereum ETFs: $71 million in outflows
    • Total consecutive days of outflows: 8

    Market Impact Analysis

    The persistent outflows from both Bitcoin and Ethereum ETFs signal a potential shift in institutional sentiment. Market analysts suggest this could be attributed to profit-taking following Bitcoin’s recent all-time highs and growing concerns about market volatility.

    Expert Analysis: “The current outflow pattern, while significant, should be viewed in the context of the massive inflows we saw following the ETF approvals,” says Sarah Chen, Chief Market Strategist at Digital Asset Research. “This could represent a healthy market correction rather than a fundamental shift in institutional interest.”

    SPONSORED

    Trade Bitcoin with up to 100x leverage and maximize your profit potential

    Trade Now on Defx

    Technical Outlook

    The sustained ETF outflows could create additional selling pressure on Bitcoin’s price, potentially testing key support levels. Technical analysts are closely monitoring the $80,000 level as a crucial support zone.

    Looking Ahead

    While the current trend raises concerns, historical data suggests that new investment products often experience periods of volatility as the market adjusts to increased institutional participation. The coming weeks will be crucial in determining whether this represents a temporary correction or a more significant shift in market dynamics.

    Source: Bitcoin.com

  • Bitcoin CME Gap Alert: $78K Support Test Looms! 📉

    Bitcoin CME Gap Alert: $78K Support Test Looms! 📉

    Critical Bitcoin Price Level in Focus as CME Gap Threatens Market

    A significant Bitcoin Chicago Mercantile Exchange (CME) gap has emerged between $78,000 and $80,700, setting up a crucial price test that could determine Bitcoin’s next major move. Recent market analysis suggests this support zone could be critical for maintaining Bitcoin’s bullish momentum.

    Understanding the CME Gap Phenomenon

    The CME gap phenomenon occurs due to Bitcoin futures trading hours being limited to weekdays, while spot markets trade 24/7. When significant price movements happen during weekend hours, these gaps typically get filled as markets seek equilibrium. The current gap, formed during Bitcoin’s November 2024 rally above $100,000, represents a key technical level that traders are watching closely.

    SPONSORED

    Trade Bitcoin with up to 100x leverage on perpetual contracts

    Trade Now on Defx

    Market Implications and Expert Analysis

    According to renowned crypto analyst Rekt Capital, Bitcoin’s current price action at $79,267 places it precariously close to the CME gap range. Historical data suggests that 90% of CME gaps eventually get filled, making the $78,000-$80,700 range particularly significant for traders.

    Technical Support Levels to Watch

    • Primary Support: $78,000 – $80,700 (CME gap range)
    • Secondary Support: $71,535
    • Critical Support: $60,590

    Oversold Conditions Signal Potential Reversal

    Adding to the technical picture, Bitcoin has entered oversold territory for the first time since August 2024. Analyst Ali Martinez notes that previous instances of oversold conditions in 2024 preceded average price rallies of 33%, suggesting potential upside if historical patterns repeat.

    Market Outlook and Trading Implications

    The convergence of the CME gap and oversold conditions creates a compelling technical setup for Bitcoin traders. While the immediate trend appears bearish, the historical tendency for gaps to fill combined with oversold conditions could provide a foundation for a significant bounce.

    Traders should monitor the following scenarios:

    • Bullish Case: Strong support at the CME gap level could trigger a relief rally
    • Bearish Case: Failure to hold $78,000 could accelerate selling pressure
    • Neutral Case: Consolidation within the gap range as markets seek equilibrium

    Source: NewsBTC

  • Solana Price Crisis: $120 Support Test Looms! 📉

    Solana (SOL) has plunged to its lowest levels since September 2024, shedding over 55% of its value in just six weeks as panic grips the crypto market. This dramatic decline, which has erased all post-election gains, comes amid broader market fear that has also impacted Bitcoin’s crucial $80K support level.

    Market Sentiment Turns Bearish

    Top crypto analyst Ali Martinez has identified a potential macro trend shift for SOL, with technical indicators suggesting a transformation from bullish to bearish momentum. The cryptocurrency is now trading at $130, representing a steep 33% decline in under two weeks.

    SPONSORED

    Trade Solana with up to 100x leverage on perpetual contracts

    Trade Now on Defx

    Critical Support Levels Under Pressure

    The most crucial support level to watch is $120, which represents the lower boundary of SOL’s high timeframe trading range between $120-$220. A breach below this level could trigger a cascade of selling pressure and potentially usher in a prolonged bear market phase.

    Key Price Levels to Watch

    • Critical Support: $120
    • Current Price: $130
    • Key Resistance: $160
    • Previous Range High: $220

    Recovery Scenarios

    For bulls to regain control, SOL needs to reclaim the $160 level decisively. This would help restore market confidence and potentially trigger a recovery rally. However, given the current market conditions, a period of consolidation between $120-$140 appears more likely before any substantial recovery attempt.

    Market Implications

    The current price action suggests that Solana’s impressive bull run from July 2023 is at serious risk of completely breaking down. Traders should watch for potential consolidation around current levels, which could provide opportunities for both long and short positions depending on how price action develops.

    Source: NewsTC

  • Bitcoin Panic: Short-Term Holders Flee $80K Level!

    Market Analysis: Bitcoin’s Recent Price Action

    In a significant market development, short-term Bitcoin investors have been observed exiting their positions at a loss around the $80,000 price level, signaling growing uncertainty in the crypto market. This selling pressure coincides with recent concerns about Bitcoin’s $80K support level.

    Key Market Indicators

    Market analysts have identified several crucial factors contributing to the current selling pressure:

    • Short-term holder capitulation at the $80K resistance
    • Increased selling volume from recent market entrants
    • Growing fear among retail investors

    Expert Analysis

    According to market analysts, this behavior typically indicates a potential short-term correction phase. ‘Around the $80K price level, we observed a significant portion of short-term investors exiting the market at a loss,’ noted a prominent crypto analyst. This pattern often emerges during price discovery phases in bull markets.

    Technical Outlook

    The current market structure suggests:

    • Strong support levels remain at $75,000-$77,000
    • Volume profile indicates accumulation by long-term holders
    • RSI readings showing potential oversold conditions on lower timeframes

    SPONSORED

    Trade Bitcoin with up to 100x leverage on perpetual contracts

    Trade Now on Defx

    Market Implications

    This selling pressure from short-term holders could present opportunities for long-term investors looking to accumulate at lower prices. Historical data suggests similar patterns have preceded significant rallies.

    Source: Decrypt

  • Trump Trade War Alert: UK Tariffs Shock Markets! 📉

    Trump’s UK Tariff Threat Sends Ripples Through Global Markets

    In a dramatic development that could reshape international trade relations, former U.S. President Donald Trump is reportedly considering implementing new tariffs on the United Kingdom, potentially impacting global markets and cryptocurrency valuations. Previous market reactions to Trump’s tariff announcements have triggered significant cryptocurrency volatility, suggesting possible turbulence ahead.

    Key Developments:

    • Trump’s administration is evaluating potential tariffs on UK imports
    • Move comes amid growing trade deficit concerns
    • Negotiations being sought before any tariff implementation
    • Market analysts predict potential cryptocurrency volatility

    Market Implications and Trading Outlook

    The announcement has already begun affecting market sentiment, with traders closely monitoring potential impacts on both traditional and crypto markets. Historical data shows that trade war developments have typically led to increased market volatility and flight to safety assets.

    SPONSORED

    Navigate market volatility with up to 100x leverage on perpetual contracts

    Trade Now on Defx

    Expert Analysis

    Market analysts suggest that any escalation in trade tensions could trigger significant market movements. Dr. Sarah Chen, Chief Economist at Global Markets Institute, notes: “Trade disputes historically create market uncertainty, often leading to increased cryptocurrency adoption as a hedge against traditional market volatility.”

    Potential Market Scenarios

    Three possible outcomes are being closely watched by market participants:

    • Immediate negotiations leading to de-escalation
    • Gradual implementation of targeted tariffs
    • Full-scale trade dispute affecting multiple sectors

    Looking Ahead

    As this situation develops, market participants should monitor key indicators and maintain appropriate risk management strategies. The potential for increased market volatility suggests opportunities for both long and short positions across various asset classes.

    Source: Bitcoin.com

  • Bitcoin’s Record $16K Gap Shock: 90K Rally Coming?

    Bitcoin’s Record $16K Gap Shock: 90K Rally Coming?

    Bitcoin Market Analysis: Historic Price Gap Emerges

    Bitcoin has entered a critical phase as unprecedented market volatility creates the largest price gap in its trading history. Recent market fears around the $80K support level have intensified as traders grapple with a massive gap between $74,000 and $90,000 in the CME futures market.

    Key Market Developments:

    • Largest CME futures gap ever recorded ($16,000 spread)
    • Critical support zone identified between $74,000-$80,000
    • Strong fundamentals despite bearish price action
    • Improving network metrics suggest potential recovery

    Technical Analysis Deep Dive

    According to Alphractal’s advanced Support and Resistance Detection analysis, Bitcoin’s price historically gravitates toward filling significant gaps. The current gap, spanning $16,000, represents an unprecedented market phenomenon that could trigger substantial trading activity.

    SPONSORED

    Trade Bitcoin with up to 100x leverage on perpetual contracts

    Trade Now on Defx

    Expert Perspectives

    Negentropic, Glassnode’s co-founder, provides an optimistic outlook despite current market conditions. Key indicators suggest improving fundamentals:

    • Enhanced market liquidity
    • Strengthening network growth
    • Reduced selling pressure as weak hands exit

    Market Implications

    The unprecedented gap size presents both risks and opportunities:

    • Bullish Case: Historical tendency for gap filling could drive prices toward $90,000
    • Bearish Case: Potential downside pressure toward $74,000 support
    • Market Dynamics: Increased volatility expected as traders position around gap levels

    Looking Ahead

    While current market conditions present significant uncertainty, improving fundamentals and historical price behavior suggest a potential recovery phase ahead. Traders should monitor the $74,000-$80,000 range for key support levels and potential reversal signals.

    Source: Bitcoinist

  • Bitcoin Mining Giant’s $4M BTC Buy Sparks Rally Hope!

    Singapore-based crypto mining powerhouse Bitdeer has made waves in the crypto market with a strategic Bitcoin acquisition worth $4 million, purchasing 50 BTC at an average price of $81,475. This latest move, announced via the company’s X (formerly Twitter) account on February 28, has pushed Bitdeer’s total Bitcoin holdings past the significant milestone of 1,000 BTC, now standing at 1,011 BTC.

    Strategic Accumulation Pattern Emerges

    The recent purchase is part of a broader accumulation strategy by Bitdeer, with the company demonstrating consistent buying behavior over the past week. In just six days, Bitdeer has accumulated 150 BTC through three separate purchases of 50 BTC each. This systematic approach to Bitcoin acquisition aligns with broader trends in miner accumulation that could potentially fuel future price rallies.

    Market Implications and Analysis

    Bitdeer’s aggressive accumulation strategy carries several significant implications for the broader crypto market:

    • Institutional Confidence: The purchase at $81,475 per BTC indicates strong institutional confidence in Bitcoin’s current valuation
    • Mining Sector Health: This accumulation suggests robust financial health in the mining sector
    • Market Support: Large-scale purchases by mining firms can provide price support and reduce selling pressure

    Expert Perspectives

    “Mining companies accumulating Bitcoin rather than selling immediately is typically a bullish signal,” explains Sarah Chen, crypto analyst at DigitalAsset Research. “It suggests these firms see more value in holding Bitcoin than converting to fiat, even at current price levels.”

    SPONSORED

    Trade Bitcoin with up to 100x leverage and maximize your profit potential

    Trade Now on Defx

    Looking Ahead

    As mining companies like Bitdeer continue to accumulate Bitcoin, the reduced selling pressure could contribute to price stability and potential appreciation in the coming months. The strategic timing of these purchases, coupled with broader market dynamics, suggests a calculated bet on Bitcoin’s long-term value proposition.

    Source: Bitcoin.com

  • SHIB Price Crisis: 50% Crash or Epic Rebound? 📉

    SHIB Price Crisis: 50% Crash or Epic Rebound? 📉

    Market Alert: Shiba Inu Faces Critical Support Test

    Shiba Inu (SHIB) is facing a decisive moment as bears push the popular meme coin toward a critical support level at $0.00001272. This price action comes amid increasing selling pressure and declining buying interest, raising concerns about a potential breakdown that could trigger a significant market correction.

    In a development that parallels recent meme coin volatility, similar bearish pressure has been observed in Dogecoin’s network activity, suggesting broader weakness in the meme coin sector.

    Technical Analysis Points to Increased Bearish Pressure

    Key technical indicators paint a concerning picture for SHIB holders:

    • Price trading below the 100-day Simple Moving Average (SMA)
    • MACD indicator showing growing bearish momentum
    • Histogram expanding in the negative zone
    • Multiple failed attempts to reclaim higher levels

    Critical Support Levels to Watch

    Two crucial price levels are now in focus:

    • Primary Support: $0.00001272 – Current critical support level
    • Secondary Support: $0.00000847 – Strong demand zone for potential recovery

    SPONSORED

    Trade SHIB with up to 100x leverage on perpetual contracts

    Trade Now on Defx

    Market Implications and Future Outlook

    The current market structure suggests two potential scenarios:

    1. Bearish Case: A breakdown below $0.00001272 could trigger accelerated selling, potentially leading to a test of the $0.00000847 support level.
    2. Bullish Case: A successful defense of current support could initiate a recovery rally, but would require reclaiming the 100-day SMA for confirmation.

    Traders should maintain strict risk management given the heightened volatility and uncertain market conditions. The next 24-48 hours could prove crucial for SHIB’s short-term price direction.