Tag: Market Analysis

  • Bitcoin Price Pattern Mirrors Summer 2024: Key Support at $86.5K

    Bitcoin Price Pattern Mirrors Summer 2024: Key Support at $86.5K

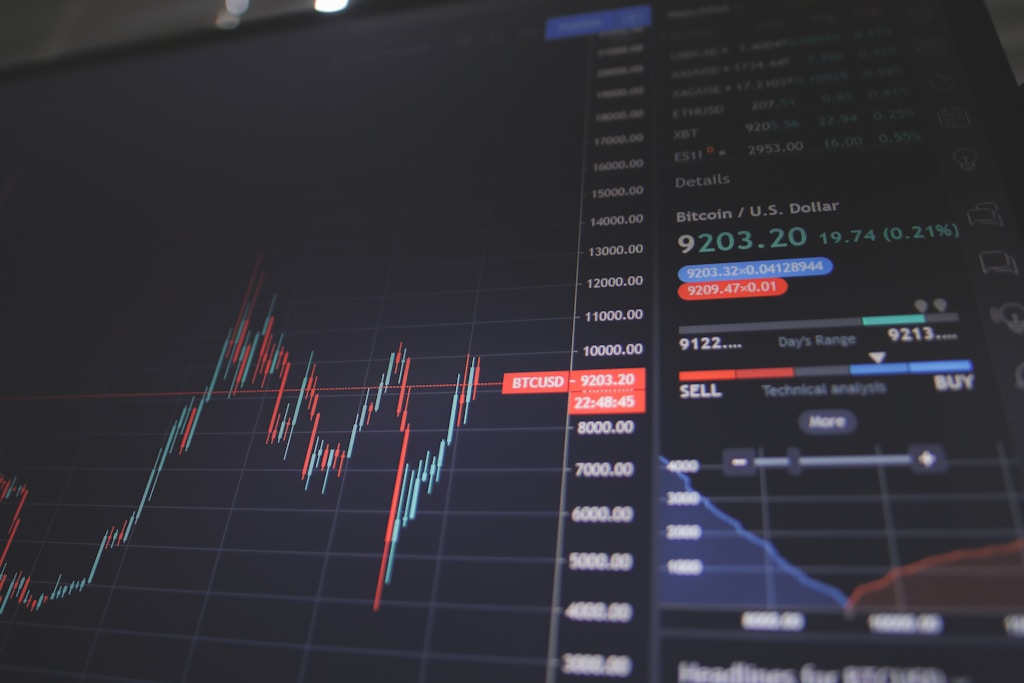
    Bitcoin’s recent 20% decline from its peak has sparked intense debate about potential recession risks, but a detailed analysis suggests the current market dynamics closely mirror the Summer 2024 correction rather than more bearish scenarios. Leading macro analyst Tomas (@TomasOnMarkets) provides compelling evidence that the broader economic backdrop remains resilient despite early 2025 concerns.

    This analysis gains particular significance as experts debate whether Bitcoin faces a ‘brutal bleed’ or new all-time highs in Q2. The current market structure shows remarkable similarities to previous correction patterns.

    Economic Indicators Signal Stability

    Key economic metrics paint a more optimistic picture than recent headlines suggest:

    • US growth nowcasts stabilizing after February decline
    • Citi Economic Surprise Index (CESI) showing signs of recovery
    • Financial conditions easing from early 2025 tightness
    • US dollar weakening, contrary to 2018’s strengthening trend

    SPONSORED

    Maximize your trading potential with up to 100x leverage on perpetual contracts

    Trade Now on Defx

    Summer 2024 vs. Late 2018: A Critical Comparison

    The current market correction shows striking parallels to Summer 2024:

    • 30% Bitcoin correction (matching Summer 2024’s decline)
    • 10% equity market drawdown
    • Similar macro backdrop and growth concerns
    • Comparable market sentiment patterns

    As recent analysis suggests a bottom formation at $77K amid easing tariff concerns, the market appears positioned for potential recovery rather than extended decline.

    Looking Ahead: April 2 Catalyst

    Market participants should mark April 2 as a crucial date for potential market direction, with several factors supporting a more optimistic outlook:

    • Leading indicators supporting business cycle expansion
    • Favorable seasonal patterns for US equity indices
    • Tight credit spreads below August 2024 highs
    • Potential positive developments on tariff policies

    FAQ Section

    Q: Will Bitcoin follow the Summer 2024 or 2018 pattern?
    A: Current indicators suggest a closer alignment with Summer 2024’s contained correction rather than 2018’s extended decline.

    Q: What are the key support levels to watch?
    A: The immediate support lies at $86,557, with secondary support at the recent bottom of $77,000.

    Q: How significant is the April 2 date?
    A: April 2 represents a potential turning point for market direction, particularly regarding tariff policies and their impact on risk assets.

    At press time, Bitcoin trades at $86,557, maintaining crucial support levels as markets await further clarity on macro conditions and policy developments.
  • Bitcoin Surges to $88.6K as Trump Tariff Fears Ease, Altcoins Lead Rally

    Bitcoin (BTC) has surged 3% to $88,600 in the last 24 hours as reports indicate President Trump’s upcoming tariff policies may be less aggressive than initially feared. However, the real story lies in the altcoin market, where Solana’s impressive momentum continues alongside strong performances from DOGE and ADA.

    Market Overview: Bitcoin Stabilizes While Altcoins Soar

    The cryptocurrency market received a boost after anonymous White House sources revealed to Bloomberg and the Wall Street Journal that the administration plans to focus solely on reciprocal tariffs rather than implementing broader sector-specific measures. This development has helped ease concerns about potential economic disruption.

    SPONSORED

    Trade with up to 100x leverage on perpetual contracts

    Trade Now on Defx

    Key Performance Metrics

    • Bitcoin: +3% ($84,000 to $88,600)
    • Solana: +8%
    • Dogecoin: +7.8%
    • Cardano: +4.5%
    • Ethereum: +4%
    • XRP: +2%

    Market Impact and Expert Analysis

    Dan Greer, CEO of Defi App, notes that Bitcoin’s recent price action directly correlates with the shifting tariff narrative. The cryptocurrency had previously experienced volatility, dropping from its January all-time high of $109,000 to $78,000 earlier this month amid recession fears.

    Technical Outlook

    Bitcoin has established strong support between $83,000 and $84,000, with current resistance at the $90,000 level. The recent pullback to $86,930 suggests consolidation before the next major move.

    Frequently Asked Questions

    How will Trump’s tariff policies affect crypto markets?

    The narrower approach to tariffs is expected to reduce market uncertainty and potentially support crypto prices by limiting economic disruption.

    Why are altcoins outperforming Bitcoin?

    Altcoins typically show higher volatility during market recoveries, with projects like Solana benefiting from increased institutional interest and technical improvements.

    What are the key support levels for Bitcoin?

    Current technical analysis shows strong support between $83,000-$84,000, with secondary support at $78,000.

  • Ethereum Price Nears $2,200: March Close Could End 3-Month Decline

    Ethereum Price Nears $2,200: March Close Could End 3-Month Decline

    Ethereum (ETH) has staged a remarkable recovery, surging past the crucial $2,000 support level and reaching a two-week high of $2,104. This price action has positioned ETH within striking distance of ending March in positive territory, potentially breaking its three-month downward streak.

    Technical Analysis Shows Critical Support Levels

    According to renowned crypto analyst Ali Martinez, Ethereum’s strongest support zone lies between $1,886 and $1,944, where over 3 million investors have accumulated approximately 6.12 million ETH. This substantial buying pressure could provide a solid foundation for further price appreciation.

    SPONSORED

    Trade Ethereum with up to 100x leverage on perpetual contracts

    Trade Now on Defx

    Key Price Levels and Market Structure

    The cryptocurrency needs to overcome significant resistance between $2,250 and $2,610, where 12.28 million addresses hold 65 million ETH. A breakthrough above this zone could invalidate the current bearish outlook and potentially trigger a substantial rally.

    Notably, Fidelity’s recent move into Ethereum treasury fund tokenization has added institutional credibility to ETH’s market position, potentially supporting its recovery efforts.

    Historical Performance and Future Outlook

    Despite experiencing its worst Q1 in seven years with a 37.46% decline from its 2025 opening, Ethereum has historically demonstrated strong performance in Q2. The cryptocurrency has only closed the second quarter in negative territory twice in its history.

    FAQ Section

    Q: What is Ethereum’s key resistance level to watch?
    A: The critical resistance zone lies between $2,250 and $2,610, with significant holder concentration.

    Q: What could trigger a bullish reversal?
    A: A decisive break above $2,200 could initiate an expansion phase and potentially mark the end of the current manipulation phase.

    Q: How close is ETH to turning March green?
    A: Ethereum needs approximately 6.8% price appreciation to close March in positive territory.

    Current Market Status

    As of the latest data, Ethereum trades at $2,090, representing a 4.3% daily increase. The cryptocurrency’s technical indicators suggest growing momentum, with the Power of Three (Po3) pattern potentially signaling the end of the manipulation phase.

  • XRP Price Tests $2.40 Support: Key Levels Signal Potential Breakout

    XRP’s price action has entered a critical consolidation phase, with the cryptocurrency currently testing crucial support levels after a recent recovery wave. As XRP continues its broader upward trajectory toward $2.60, traders are closely monitoring key technical indicators for the next major move.

    XRP Price Analysis: Key Technical Levels

    The digital asset has shown resilience above the $2.40 support zone, demonstrating strong buyer interest at current levels. Here are the critical levels traders should watch:

    • Current Support: $2.40
    • Secondary Support: $2.35
    • Major Resistance: $2.48
    • Key Breakout Level: $2.50

    Technical Indicators Paint Mixed Picture

    The hourly chart reveals several important technical developments:

    • The 100-hourly Simple Moving Average remains a key support indicator
    • RSI has dipped below 50, suggesting short-term bearish momentum
    • MACD shows decreasing bullish momentum in the immediate term

    SPONSORED

    Trade XRP with up to 100x leverage on perpetual contracts

    Trade Now on Defx

    Potential Scenarios for XRP

    Bullish Case

    A decisive break above $2.50 could trigger a rally toward:

    • Initial target: $2.55
    • Secondary target: $2.65
    • Extended target: $2.80

    Bearish Case

    If support at $2.40 fails, expect potential drops to:

    • First support: $2.35
    • Critical support: $2.32
    • Major support: $2.25

    FAQ: XRP Price Action

    What’s causing XRP’s current consolidation?

    The consolidation appears to be driven by profit-taking after reaching $2.50 and broader market uncertainty affecting crypto assets.

    When might XRP break out of this range?

    Technical indicators suggest a breakout could occur within the next 24-48 hours as price compression increases.

    What’s the most likely direction for XRP?

    Given the overall market structure and technical setup, a bullish breakout appears more likely, provided $2.40 support holds.

    Conclusion

    XRP’s current price action suggests a major move is imminent. While the short-term picture shows some weakness, the overall structure remains bullish above $2.40. Traders should watch for a decisive break above $2.50 for confirmation of the next leg up.

  • Ethereum Price Breaks $2,000: Key Resistance at $2,100 Tests Bulls

    Ethereum (ETH) has staged a significant recovery, pushing above the psychological $2,000 barrier as the cryptocurrency market shows signs of renewed strength. This technical analysis examines the critical levels and potential scenarios for ETH’s price action.

    Ethereum’s Technical Breakthrough

    After establishing strong support above $1,850, Ethereum initiated an impressive recovery wave that mirrors the broader crypto market momentum. The second-largest cryptocurrency by market cap successfully cleared several key resistance levels, including $1,920 and $1,950, before testing the crucial $2,100 zone.

    As broader crypto market sentiment turns increasingly bullish, Ethereum’s price action suggests potential for further upside, though significant hurdles remain.

    Key Technical Levels to Watch

    • Current Support: $2,000 with bullish trend line
    • Immediate Resistance: $2,080
    • Major Resistance: $2,100 – $2,120
    • Next Target: $2,200 on breakout

    SPONSORED

    Trade ETH with up to 100x leverage on perpetual contracts

    Trade Now on Defx

    Technical Indicators Signal Mixed Momentum

    The hourly MACD shows decreasing bullish momentum, while the RSI has dipped below the 50 zone, suggesting potential consolidation ahead. Traders should watch for:

    • Support at $2,025 (61.8% Fibonacci retracement level)
    • Potential downside targets at $1,950 and $1,880
    • Volume patterns at resistance tests

    FAQ: Ethereum’s Price Action

    Q: What’s driving Ethereum’s current price movement?
    A: The recovery appears technically driven, supported by broader market momentum and increased trading volume above key support levels.

    Q: What are the key levels for traders to watch?
    A: The critical resistance zone lies between $2,080-$2,100, while major support sits at $2,000.

    Q: What’s the potential upside target?
    A: A clear break above $2,120 could trigger a rally toward $2,200, with potential extension to $2,320.

    Conclusion: Critical Juncture for ETH

    Ethereum stands at a pivotal point, with the $2,100 resistance level likely determining the next major move. Traders should maintain strict risk management while monitoring volume patterns and technical indicators for confirmation of trend direction.

  • Cronos (CRO) Price Surges 15% on Trump Media Partnership News

    Cronos (CRO) Price Surges 15% on Trump Media Partnership News

    The Cronos (CRO) token has experienced a significant price surge following the announcement of a strategic partnership between Trump Media and Crypto.com, marking a major development in the intersection of traditional media and cryptocurrency markets. The partnership announcement has triggered substantial buying pressure in the crypto market.

    Key Highlights of the Cronos Rally

    • CRO token price jumped immediately after the partnership news
    • Trading volume increased by over 300% in the first hours
    • Singapore-based Crypto.com sees surge in new user registrations

    Understanding the Trump Media – Crypto.com Partnership

    This strategic alliance comes at a crucial time, as Trump Media’s recent $250M crypto ETF initiative continues to reshape the digital asset landscape. The partnership is expected to introduce new crypto-based financial products and services to Trump Media’s extensive user base.

    SPONSORED

    Trade CRO with up to 100x leverage on perpetual contracts

    Trade Now on Defx

    Market Impact and Future Outlook

    The partnership’s announcement has created significant momentum for the CRO token, with market analysts projecting continued growth potential. This development comes as crypto markets prepare for Trump’s upcoming April 2 ‘Liberation Day’ tariffs, adding another layer of significance to the timing of this partnership.

    FAQ Section

    What does this partnership mean for CRO holders?

    The partnership is expected to increase utility and adoption of the CRO token across Trump Media’s platforms.

    How will this affect Crypto.com’s market position?

    This alliance significantly strengthens Crypto.com’s presence in the North American market and could lead to increased institutional adoption.

    What are the potential risks?

    As with all crypto investments, market volatility and regulatory changes remain key risk factors to consider.

  • Bitcoin Price Dips From $88.7K – Perfect Entry Point Forms at $86.5K

    Bitcoin’s price has entered a correction phase after reaching a local high of $88,750, presenting what technical analysts suggest could be an optimal entry point around $86,500. This price action comes as Bitcoin recently broke above the crucial $88K level, demonstrating continued market strength despite short-term volatility.

    Key Bitcoin Price Levels to Watch

    The leading cryptocurrency has established several critical support and resistance levels that traders should monitor:

    • Current support: $86,800 (bullish trend line)
    • Secondary support: $86,200 (50% Fibonacci level)
    • Key resistance: $87,500 followed by $88,000
    • Previous high: $88,750

    SPONSORED

    Trade Bitcoin with up to 100x leverage and maximize your profit potential

    Trade Now on Defx

    Technical Analysis Breakdown

    The current price action shows several bullish indicators despite the short-term correction:

    • Price remains above the 100-hour Simple Moving Average
    • Bullish trend line support at $86,800
    • RSI holding above 50, indicating maintained bullish momentum
    • MACD showing potential for continued upside

    Potential Scenarios and Entry Points

    Two primary scenarios are emerging for Bitcoin’s next move:

    Bullish Scenario

    • Break above $87,500 could trigger run to $88,800
    • Potential extension to $89,500 and $90,000
    • Key entry point around current $86,500 support

    Bearish Scenario

    • Failure to break $87,500 could trigger decline
    • Support levels at $85,500 and $85,000
    • Major support at $84,500 must hold

    Expert Analysis and Market Outlook

    As market sentiment remains strongly bullish near $90K, this dip could represent an attractive entry point for traders looking to establish long positions. The technical structure suggests the overall uptrend remains intact despite the current correction.

    FAQ

    Is this a good time to buy Bitcoin?

    The current price level around $86,500 represents a potential value zone with strong technical support, making it an attractive entry point for traders comfortable with the risk.

    What’s the next major resistance level for Bitcoin?

    The immediate resistance lies at $87,500, with $88,000 and $88,800 serving as the next major hurdles before a potential test of $90,000.

    Could Bitcoin drop further from here?

    While possible, strong support exists at $85,500 and $84,500, making significant downside limited unless these levels break.

  • Bitcoin Eyes $90K as Binance Stablecoin Reserves Hit $31B ATH

    Bitcoin Eyes $90K as Binance Stablecoin Reserves Hit $31B ATH

    Bitcoin’s trajectory toward $90,000 is gaining momentum as Binance’s stablecoin reserves reach an unprecedented $31 billion, potentially signaling massive buying power waiting to enter the market. The leading cryptocurrency has already broken through $87,000, posting gains of 5.2% weekly and 3.4% daily.

    This surge comes as market sentiment indicators point to a major breakout ahead, with institutional interest remaining robust despite recent consolidation phases.

    Record Stablecoin Reserves Signal Potential Buying Pressure

    CryptoQuant analyst Darkfost’s latest findings reveal that ERC-20 stablecoin holdings on Binance have reached an all-time high of $31 billion. This massive liquidity pool could serve as dry powder for future Bitcoin purchases, potentially catalyzing the next leg up in the ongoing bull market.

    SPONSORED

    Trade Bitcoin with up to 100x leverage and maximize your profit potential

    Trade Now on Defx

    Critical Price Levels to Watch

    According to CryptoQuant’s analysis, several key price levels could determine Bitcoin’s next move:

    • $85,000: Short-term holder cost basis (1-4 weeks)
    • $89,000: Medium-term holder level (3-6 months)
    • $98,000: Near-term resistance target
    • $63,000: Long-term holder support (6-12 months)

    Recent cyclical analysis suggests a potential peak around $108,000, though current market dynamics and stablecoin reserves could push prices even higher.

    Market Implications and Trading Outlook

    The concentration of stablecoins on Binance, coupled with improving technical indicators, suggests we may be entering a new phase of the bull market. Traders should watch for:

    • Breakout confirmation above $89,000
    • Volume increases accompanying price movements
    • Stablecoin outflow patterns indicating actual market entry

    FAQ Section

    Why are stablecoin reserves important for Bitcoin’s price?

    High stablecoin reserves indicate potential buying power waiting to enter the market, often preceding significant price movements.

    What could trigger the next Bitcoin rally?

    A combination of high stablecoin reserves, technical breakouts above key levels, and sustained institutional interest could catalyze the next upward move.

    How high could Bitcoin go in this cycle?

    While some analysts target $108,000, the unprecedented stablecoin reserves could support even higher prices if deployed into the market.

  • Bitcoin Price Target $200K: Kiyosaki Warns of FOMO-Driven Rally

    Bitcoin Price Target $200K: Kiyosaki Warns of FOMO-Driven Rally

    Key Takeaways:

    • Robert Kiyosaki predicts Bitcoin will surpass $200,000 in 2025
    • Rich Dad Poor Dad author warns against fear-based investment paralysis
    • Analysis suggests unprecedented FOMO could drive historic price movement

    Robert Kiyosaki, the renowned author of ‘Rich Dad Poor Dad,’ has issued a striking prediction for Bitcoin’s price trajectory, forecasting that the leading cryptocurrency will surge beyond $200,000 this year. This bold projection comes as Bitcoin continues its impressive rally near $90,000, with market sentiment indicating strong bullish momentum.

    Kiyosaki, who has consistently advocated for Bitcoin as a hedge against traditional financial system instability, emphasizes that while FOMO (Fear Of Missing Out) is driving significant price appreciation, many potential investors remain paralyzed by fear, potentially missing out on historic wealth creation opportunities.

    Understanding the $200K Bitcoin Price Prediction

    The author’s latest prediction aligns with his previous bullish stance on Bitcoin, as evidenced in his earlier forecast of Bitcoin reaching $1 million by 2030. His current analysis points to several key factors:

    • Institutional adoption acceleration
    • Post-halving supply dynamics
    • Growing mainstream FOMO
    • Global economic uncertainty

    SPONSORED

    Maximize your Bitcoin trading potential with up to 100x leverage on perpetual contracts

    Trade Now on Defx

    Market Psychology: Fear vs. FOMO

    Kiyosaki’s analysis highlights a crucial psychological dynamic in the current market: while FOMO drives prices higher, many potential investors remain sidelined due to fear. This paradoxical situation could create even more explosive price action as these hesitant investors eventually enter the market.

    Expert Analysis and Market Implications

    Market analysts note that Kiyosaki’s prediction coincides with several technical indicators suggesting continued upward momentum. Recent market sentiment data and technical analysis support the possibility of extended price appreciation.

    Frequently Asked Questions

    Q: What timeframe does Kiyosaki give for Bitcoin reaching $200K?

    A: Kiyosaki expects Bitcoin to surpass $200,000 before the end of 2025.

    Q: What factors support this price prediction?

    A: Key factors include institutional adoption, post-halving effects, increasing FOMO, and global economic uncertainty.

    Q: How does this prediction compare to other expert forecasts?

    A: This prediction aligns with several institutional forecasts but represents one of the more bullish near-term targets.

    Conclusion

    As Bitcoin continues its upward trajectory, Kiyosaki’s $200,000 price prediction adds to the growing chorus of bullish forecasts from market experts. While the target may seem ambitious, the combination of technical factors and market psychology suggests significant upside potential remains in the current cycle.

  • XRP Price Shows Wave 4 Pattern: Analysts Project $4 Target for April

    XRP Price Shows Wave 4 Pattern: Analysts Project $4 Target for April

    The XRP market is showing significant technical strength as multiple analysts identify a Wave 4 corrective structure that could propel the digital asset to new all-time highs. According to detailed technical analysis, XRP appears poised for a major breakout that could see prices reach $4 by April 2025.

    Technical Analysis Points to Historic Pattern Repetition

    Crypto analyst Prophecy Trading has identified striking similarities between XRP’s current price action and the patterns that preceded its legendary 2017 bull run. The analysis reveals a Wave 4 corrective structure that historically precedes significant price appreciation.

    This analysis gains additional credibility when viewed alongside XRP’s recent surge toward the $2.60 resistance level, suggesting the asset is building momentum for its next major move.

    SPONSORED

    Trade XRP with up to 100x leverage on perpetual contracts

    Trade Now on Defx

    Key Price Levels and Support Zones

    CasiTrades has identified critical price levels that traders should monitor:

    • Current Support: $2.36 (0.618 Golden Retracement)
    • Immediate Resistance: $2.70
    • Macro Targets: $3.05 and $3.40
    • ATH Test Level: $3.80

    Market Structure Analysis

    Several technical indicators support the bullish outlook:

    • Bullish RSI divergence forming
    • Strong consolidation rather than breakdown
    • Historical pattern alignment with 2017 bull run
    • Correlation with broader market trends

    Frequently Asked Questions

    What is causing XRP’s potential price surge?

    The combination of technical patterns, market cycles, and broader crypto market momentum are creating conditions similar to previous bull runs.

    When could XRP reach the projected $4 target?

    Analysts suggest April 2025 as the potential timeframe for reaching new all-time highs, though market conditions could affect this timeline.

    What are the key risks to this prediction?

    Market volatility, regulatory changes, and broader economic factors could impact the projected price movement.

    At press time, XRP is trading at $2.45, showing a 2% increase over the last 24 hours. The asset continues to demonstrate resilience as it maintains its position above key support levels.