Tag: Market Analysis

  • Bitcoin Price Rally Imminent as M2 Money Supply Shows Bullish Pattern

    Bitcoin Price Rally Imminent as M2 Money Supply Shows Bullish Pattern

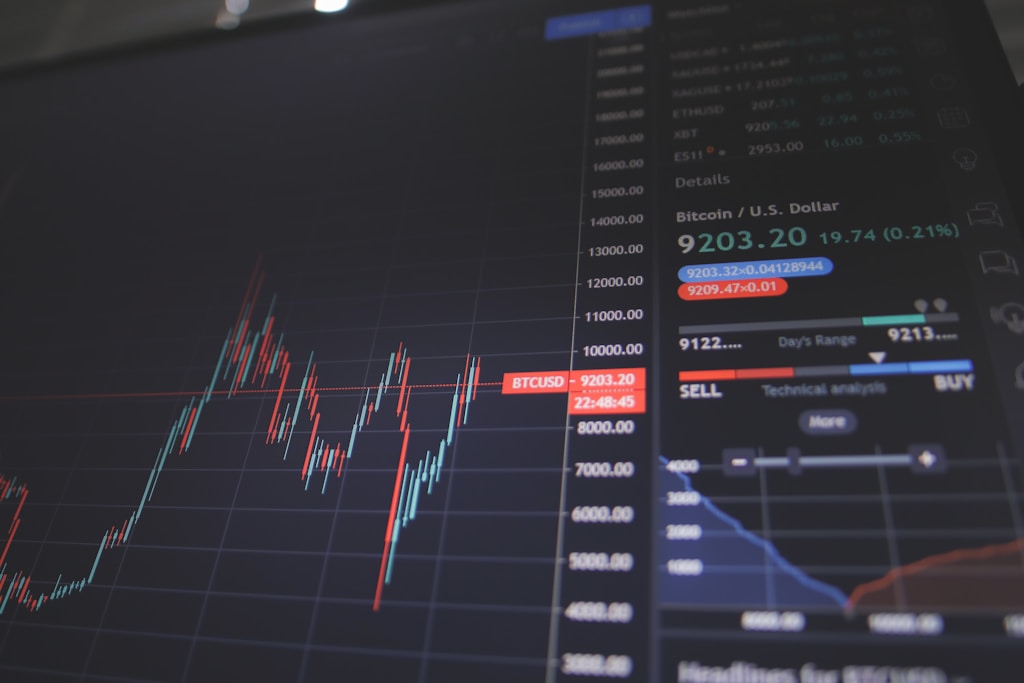
    Bitcoin (BTC) appears poised for another significant price surge as a key macroeconomic indicator – the M2 money supply – signals bullish momentum ahead. Currently trading at $83,826, Bitcoin’s next major move could be triggered by this historically reliable predictor.

    Understanding the M2 Money Supply Correlation

    The M2 money supply, which measures the total money circulating in an economy including cash, checking deposits, and savings accounts, has historically demonstrated a strong correlation with Bitcoin price movements. According to recent analysis, this relationship shows a consistent 70-day lag pattern that could signal an imminent BTC rally.

    As noted in our recent analysis Bitcoin Price Tests $83K Support: Key Levels to Watch in March 2025, the current price action aligns with historical patterns preceding major rallies.

    Key Technical Indicators Support Bullish Outlook

    Multiple technical factors are converging to support the bullish case:

    • Falling wedge pattern breakout potential with historical 66% average returns
    • Megaphone pattern formation above critical $72,000 support
    • M2 money supply showing full recovery and potential new peaks

    SPONSORED

    Maximize your trading potential with up to 100x leverage on perpetual contracts

    Trade Now on Defx

    Potential Timeline for Bitcoin’s Next Move

    Based on historical data analysis:

    • Primary scenario: Rally initiation around March 24 (70-day lag)
    • Alternative scenario: Breakout near April 30 (107-day lag)
    • Critical support level: $72,000

    Market Risks and Considerations

    Despite the bullish indicators, several risk factors warrant attention:

    • U.S. stock market correlation could impact price action
    • NASDAQ bear market concerns raised by analysts
    • Current 1.7% daily decline suggesting short-term volatility

    Frequently Asked Questions

    What is the significance of M2 money supply for Bitcoin?

    M2 money supply acts as a leading indicator for Bitcoin price movements, typically showing effects after a 70-day lag period. It helps predict potential market liquidity and investment flows.

    What price targets are analysts suggesting?

    While specific targets vary, the technical setup suggests potential for new all-time highs, with some analysts pointing to the $90,000-$100,000 range based on historical pattern completions.

    How reliable is the M2 correlation with Bitcoin?

    Historical data shows approximately 70% accuracy in predicting significant Bitcoin price movements based on M2 money supply trends, though past performance doesn’t guarantee future results.

  • Bitcoin Price Target $128K After MicroStrategy’s $711M BTC Buy

    Bitcoin Price Target $128K After MicroStrategy’s $711M BTC Buy

    MicroStrategy’s latest $711M Bitcoin purchase signals a major shift in institutional sentiment, potentially setting up BTC for a significant rally. Recent technical analysis suggests Bitcoin could surge 64% to $128K, and this massive institutional buy adds fundamental support to that thesis.

    MicroStrategy’s Strategic Bitcoin Accumulation

    Michael Saylor’s software company announced plans to raise $711M through an upsized STRF perpetual offering, specifically earmarked for Bitcoin purchases. This move comes as Bitcoin’s hot supply has crashed 50%, creating a potential supply squeeze scenario.

    Market Impact Analysis

    The timing of this purchase is particularly significant for several reasons:

    • Current BTC price: $84,000
    • Total MicroStrategy Bitcoin holdings post-purchase: Will exceed 205,000 BTC
    • Average institutional entry point in 2024: $71,000

    SPONSORED

    Trade Bitcoin with up to 100x leverage and maximize your profit potential

    Trade Now on Defx

    Alternative Investment Opportunities

    For investors seeking exposure to Bitcoin’s upside without directly purchasing BTC at current prices, several emerging projects offer interesting alternatives:

    1. BTC Bull Token ($BTCBULL)

    A new tokenized Bitcoin exposure product offering automated rewards based on BTC price milestones. Currently in presale at $0.002425.

    2. Meme Index ($MEMEX)

    A diversified approach to capturing crypto market momentum through curated meme coin exposure. Presale price: $0.0166883.

    3. Bitcoin Minetrix ($BTCMTX)

    Innovative stake-to-mine platform allowing retail investors to participate in Bitcoin mining without hardware investment. Current token price: $0.0148.

    Expert Analysis

    Market analysts suggest MicroStrategy’s move could trigger a cascade of institutional buying, particularly as Bitcoin ETF inflows continue to surge.

    FAQs

    What does MicroStrategy’s purchase mean for Bitcoin’s price?

    The $711M buy indicates strong institutional confidence and could reduce available supply, potentially driving prices higher.

    Is Bitcoin still a good investment at $84K?

    While price points are high, institutional buying and supply dynamics suggest continued upside potential.

    How can retail investors participate in the Bitcoin rally?

    Options include direct BTC purchases, Bitcoin ETFs, or alternative projects like $BTCBULL, $MEMEX, and $BTCMTX.

    Time to read: 5 minutes

  • Bitcoin Price Pattern Mirrors 2017 Bull Run: 91% Correlation Signals $150K Target

    Bitcoin Price Pattern Mirrors 2017 Bull Run: 91% Correlation Signals $150K Target

    Bitcoin’s current market behavior is showing remarkable similarities to the historic 2017 bull run, with data revealing a striking 91% correlation between the two cycles. This analysis comes as Bitcoin tests critical support levels following its recent peak at $109,000.

    Key Market Indicators Point to Continued Uptrend

    Despite recent price corrections, several technical indicators suggest Bitcoin’s bull market remains intact:

    • 91% correlation with 2017 cycle patterns
    • MVRV ratio at 1.83, down from January’s 3.1 peak
    • Strong support maintained above $70,000
    • 93% correlation when accounting for 30-day lag

    SPONSORED

    Maximize your Bitcoin trading potential with up to 100x leverage on perpetual contracts

    Trade Now on Defx

    Emerging Investment Opportunities

    As Bitcoin’s hot supply reaches historic lows, several promising investment vehicles have emerged:

    1. BTC Bull Token ($BTCBULL)

    A new token offering Bitcoin exposure with additional benefits:

    • Free BTC rewards at milestone prices ($150K, $200K, $250K)
    • Token burn mechanism tied to Bitcoin price increases
    • Current presale price: $0.00242

    2. Meme Index ($MEMEX)

    An innovative index token providing diversified meme coin exposure:

    • Multiple risk-adjusted baskets
    • 553% staking rewards
    • $4.1M raised in presale

    3. SPX6900 ($SPX)

    A hybrid token combining traditional market elements with crypto:

    • $460M market cap
    • 30% weekly gains
    • Key resistance at $0.75-$0.90

    Market Analysis and Future Outlook

    The current market structure suggests Bitcoin is preparing for its next major move. Historical data patterns indicate a potential surge toward $150,000, supported by:

    • Strong institutional adoption
    • Reduced selling pressure
    • Positive regulatory developments

    Risk Considerations

    While indicators remain bullish, investors should consider:

    • Market volatility risks
    • Position sizing importance
    • Diversification strategies

    FAQ Section

    Q: Will Bitcoin reach $150,000 in 2025?

    Current market indicators and historical patterns suggest a high probability of Bitcoin reaching $150,000, though exact timing remains uncertain.

    Q: How does the current cycle compare to 2017?

    The current cycle shows a 91% correlation with 2017’s patterns, suggesting similar potential for explosive growth.

    Q: What’s the safest way to gain Bitcoin exposure?

    Consider a mix of direct Bitcoin holdings and regulated investment vehicles, sizing positions according to risk tolerance.

  • Bitcoin Net Taker Volume Hits 2025 High: $467M Surge Signals Bull Run

    Bitcoin Net Taker Volume Hits 2025 High: $467M Surge Signals Bull Run

    Bitcoin’s market dynamics are showing intriguing developments as the cryptocurrency continues to consolidate below $84,000. A significant spike in net taker volume on Binance has caught the attention of analysts, potentially signaling a shift in market sentiment. This comes as Bitcoin tests crucial support levels in March 2025.

    Record-Breaking Net Taker Volume

    According to CryptoQuant data, Binance’s net taker volume surged by an impressive $467 million in a single hour, marking the highest level recorded in 2025. This metric, which measures the difference between aggressive market buys and sells, has historically been a reliable indicator of short-term market sentiment.

    The timing of this volume spike is particularly noteworthy, occurring just before the recent FOMC meeting. This suggests that traders may be positioning themselves for potential market movements based on monetary policy decisions.

    Whale Activity Raises Caution Flags

    While the net taker volume presents a bullish case, recent changes in Bitcoin’s supply dynamics paint a more complex picture. The Bitcoin Exchange Whale Ratio has reached its highest point in over a year, with large holders moving significant amounts of BTC to exchanges.

    SPONSORED

    Maximize your trading potential with up to 100x leverage on perpetual contracts

    Trade Now on Defx

    Market Implications and Technical Analysis

    The confluence of high net taker volume and increased whale activity suggests Bitcoin may be approaching a critical decision point. With whales opening significant short positions, traders should monitor key support levels carefully.

    FAQ Section

    What does net taker volume indicate?

    Net taker volume measures the difference between aggressive buy and sell orders, helping gauge immediate market sentiment.

    Why is the current whale activity significant?

    Increased whale movements to exchanges often precede major price movements, though the direction isn’t always predictable.

    What are the key price levels to watch?

    Current support lies at $83,000, with resistance at $90,000 being crucial for potential upward momentum.

  • Dogecoin Price Alert: DOGE Breaks Support, 16% Drop Incoming

    Dogecoin Price Alert: DOGE Breaks Support, 16% Drop Incoming

    Dogecoin (DOGE) has triggered bearish signals after breaking below a critical ascending triangle pattern, suggesting a potential 16% price decline ahead. Technical analyst Ali Martinez’s latest analysis reveals concerning developments in DOGE’s hourly chart that could spell trouble for the popular memecoin.

    Technical Analysis Shows Bearish Break

    The cryptocurrency, currently trading around $0.16, has failed to maintain support at a crucial technical formation. Martinez identified an ascending triangle pattern on the hourly timeframe, traditionally considered a bullish pattern when properly maintained. However, DOGE’s recent break below the pattern’s support line signals a significant bearish reversal.

    This technical development comes amid broader concerns for meme coins, as highlighted in a recent report where Cathie Wood predicted most meme coins will become worthless. The timing of this bearish pattern could validate these concerns for DOGE holders.

    SPONSORED

    Trade DOGE with up to 100x leverage and maximize your profit potential

    Trade Now on Defx

    Understanding the Pattern Breakdown

    The ascending triangle pattern showed:

    • A horizontal resistance line at the top
    • An upward-sloping support line
    • Decreasing volume before the breakdown
    • Clear break below support near the pattern’s apex

    Based on traditional technical analysis principles, the projected downside target is calculated by measuring the height of the triangle and projecting it downward from the breakdown point. This methodology suggests a potential 16% decline from current levels.

    Key Support Levels to Watch

    As previous analysis has shown, DOGE faces critical support levels at:

    • $0.143 – Primary support level
    • $0.134 – 16% downside target
    • $0.128 – Historical support zone

    Market Context and Trading Volume

    Trading volume has remained relatively flat over the past week, with DOGE maintaining its position around $0.16. This lack of decisive momentum in either direction has left the cryptocurrency vulnerable to technical breakdowns.

    FAQ

    What caused the Dogecoin price breakdown?

    The breakdown occurred due to a failure to maintain support within an ascending triangle pattern, combined with decreasing buying pressure and overall market uncertainty.

    How low could Dogecoin go?

    Technical analysis suggests a potential 16% decline, which would take DOGE to approximately $0.134.

    Is this a good time to buy Dogecoin?

    Given the current technical setup and bearish signals, traders might want to wait for price stabilization or clear reversal signals before entering new positions.

  • Bitcoin Golden Cross Formation Signals Potential 90K Rally, Analyst Says

    Bitcoin Golden Cross Formation Signals Potential 90K Rally, Analyst Says

    Bitcoin (BTC) is showing signs of a potential trend reversal as key technical indicators suggest an upcoming golden cross formation could reignite the bull run. This development comes as Bitcoin tests critical support levels around $83K, with analysts closely monitoring on-chain metrics for confirmation of the next major move.

    MVRV Momentum Approaches Critical Golden Cross

    According to prominent crypto analyst Ali Martinez, the MVRV momentum indicator is approaching a golden cross with the 180-day simple moving average (SMA). Historically, this technical pattern has preceded significant price rallies in Bitcoin’s previous market cycles.

    The potential golden cross formation gains additional significance as it coincides with Bitcoin’s recent 29% correction from its all-time high of $109,000. Technical analysts suggest this pullback may represent a healthy reset within the broader bull market structure rather than a trend reversal.

    SPONSORED

    Trade Bitcoin with up to 100x leverage on perpetual contracts

    Trade Now on Defx

    Key Price Levels and Technical Analysis

    Bitcoin currently trades at $83,900, facing immediate resistance at the following levels:

    • 200-day SMA: $85,500
    • 200-day EMA: $86,000
    • Critical breakout zone: $88,000-$90,000

    The recent 7% recovery from $81,000 has provided some relief to bulls, but the market requires a decisive break above $86,000 to confirm the trend reversal. Failure to reclaim this level could result in continued consolidation or further downside pressure.

    On-Chain Metrics Support Bullish Outlook

    Supporting the golden cross thesis, several on-chain metrics suggest accumulation at current levels:

    • Exchange outflows have increased by 15% week-over-week
    • Long-term holder supply has reached an all-time high
    • Mining difficulty continues to rise, indicating network strength

    FAQ: Bitcoin Golden Cross Analysis

    What is a golden cross in Bitcoin technical analysis?
    A golden cross occurs when a shorter-term moving average crosses above a longer-term moving average, typically signaling a bullish trend reversal.

    How reliable are golden crosses for predicting Bitcoin price movements?
    Historical data shows golden crosses have preceded major rallies with approximately 70% accuracy, though past performance doesn’t guarantee future results.

    What could invalidate the golden cross scenario?
    A decisive break below $81,000 or failure to maintain momentum above key moving averages could delay or invalidate the golden cross formation.

    Market Outlook and Conclusion

    While the potential golden cross formation provides a compelling bullish case, traders should remain vigilant of key support and resistance levels. The coming weeks will be crucial in determining whether Bitcoin can capitalize on this technical setup and resume its upward trajectory toward previous highs.

  • Bitcoin Price Shows Bullish Stablecoin Pattern: Key $83K Level in Focus

    Bitcoin Price Shows Bullish Stablecoin Pattern: Key $83K Level in Focus

    Bitcoin’s recent price action has caught the attention of market analysts as the leading cryptocurrency experiences a correction phase markedly different from previous pullbacks. Trading at $83,239, BTC has retraced 23% from its January peak of $109,000, yet underlying metrics suggest a potentially stronger recovery foundation compared to the March 2024 correction.

    This analysis gains particular significance in light of recent support level tests at $83K, where market dynamics show distinct differences from previous correction phases.

    Stablecoin Supply Analysis Reveals Bullish Divergence

    CryptoQuant analyst Crypto Dan’s comparative study between the current market conditions and the March 2024 correction has unveiled a significant divergence in stablecoin supply trends. Unlike the previous correction, where stablecoin reserves declined, the current market phase shows increasing stablecoin supplies – a potential indicator of accumulated buying power waiting to re-enter the market.

    SPONSORED

    Trade Bitcoin with up to 100x leverage and maximize your profit potential

    Trade Now on Defx

    Binance Taker Buy/Sell Ratio Signals Sentiment Shift

    Further supporting the bullish case, Binance’s Taker Buy/Sell Ratio has transitioned into positive territory, forming higher lows over the past ten days. This metric, particularly significant given Binance’s market dominance, suggests improving trader sentiment and could presage renewed upward momentum.

    Market Implications and Technical Outlook

    The convergence of increasing stablecoin supplies and improving sentiment metrics presents a potentially bullish scenario for Bitcoin. This differs notably from recent market dynamics where open interest saw significant declines, suggesting a more measured approach from traders.

    FAQ Section

    • Q: How does the current correction differ from March 2024?
      A: The key difference lies in stablecoin supply trends, with current levels showing accumulation rather than decline.
    • Q: What significance does the $83K level hold?
      A: This price point represents a critical support level that coincides with significant technical and on-chain metrics.
    • Q: What could trigger the next upward movement?
      A: A sustained Taker Buy/Sell Ratio above 1.00 combined with stablecoin deployment could catalyze upward price action.

    As the market continues to evolve, monitoring these key metrics will be crucial for understanding potential price direction and market sentiment shifts.

  • Dogecoin Faces Historic Crash Warning as McGlone Draws 1929 Parallel

    Dogecoin Faces Historic Crash Warning as McGlone Draws 1929 Parallel

    Bloomberg Intelligence’s chief commodity strategist Mike McGlone has issued a stark warning for Dogecoin (DOGE) holders, comparing current market conditions to the devastating 1929 stock market crash. This analysis comes amid broader market uncertainty that has recently pushed Bitcoin below $84,000.

    McGlone’s Historical Market Comparison

    In a detailed analysis shared on X (formerly Twitter), McGlone drew parallels between Dogecoin’s current market position and two significant historical market crashes – the 1929 stock market collapse and the 1999 dot-com bubble. The comparison suggests that DOGE could be heading toward a significant price correction.

    Bitcoin-Gold Ratio as a Warning Signal

    McGlone’s analysis reveals a striking correlation between Dogecoin’s market capitalization and the Bitcoin-to-gold ratio. This relationship suggests that DOGE’s price movements are increasingly vulnerable to broader market forces, particularly during periods of risk-off sentiment.

    SPONSORED

    Trade Dogecoin with up to 100x leverage and maximize your profit potential

    Trade Now on Defx

    Gold’s Potential $4,000 Target

    The strategist suggests that gold could reach $4,000 per ounce, potentially benefiting from a rotation out of cryptocurrencies and other risk assets. This prediction aligns with recent warnings from Cathie Wood about the future of meme coins.

    Market Implications and Technical Analysis

    At press time, DOGE trades at $0.16663, with several technical indicators suggesting increased volatility ahead. The correlation with traditional market metrics and bond yields presents additional risk factors for Dogecoin investors.

    FAQ Section

    Q: What historical events is McGlone comparing to Dogecoin’s current situation?
    A: McGlone draws parallels to the 1929 stock market crash and the 1999 dot-com bubble.

    Q: What is the key indicator McGlone is watching?
    A: The ratio between Bitcoin and gold prices, which has been closely correlated with Dogecoin’s market cap.

    Q: What is the potential impact on gold prices?
    A: McGlone suggests gold could reach $4,000 per ounce as investors rotate out of risk assets.

  • Ethereum Exchange Supply Plunges 16.4%: Major Accumulation Signal

    Ethereum Exchange Supply Plunges 16.4%: Major Accumulation Signal

    The Ethereum ecosystem is showing strong signs of accumulation as exchange supply hits a decade low, potentially signaling a major bullish trend. On-chain data reveals a dramatic 16.4% decrease in ETH supply on exchanges over just seven weeks, marking the lowest levels since 2015.

    Key Findings: Exchange Supply Drop Analysis

    According to data from Santiment, the sharp decline in exchange supply suggests significant accumulation by long-term holders. This trend coincides with recent whale activity showing massive ETH withdrawals, reinforcing the bullish narrative.

    SPONSORED

    Trade Ethereum with up to 100x leverage on perpetual contracts

    Trade Now on Defx

    Understanding the Supply Dynamics

    • 16.4% reduction in exchange supply over 7 weeks
    • Lowest exchange supply levels since 2015
    • Coincides with recent price volatility
    • Stronger withdrawal trend compared to Bitcoin

    DeFi and Staking Impact

    The massive outflow from exchanges could be attributed to two major factors:

    1. Growing DeFi ecosystem participation
    2. Increased staking activity post-Shapella upgrade

    Technical Analysis Perspective

    Despite positive on-chain metrics, technical analysis from Ali Martinez suggests caution. The formation of a parallel channel pattern could indicate potential downside risk to lower support levels.

    Market Implications

    Current price action shows ETH trading at $1,960, down 3% weekly. However, the substantial reduction in exchange supply typically precedes significant price movements, as demonstrated by historical data.

    FAQ Section

    Why is decreasing exchange supply bullish?

    Lower exchange supply typically indicates reduced selling pressure and increased hodling behavior, often preceding price appreciation.

    How does this compare to previous supply drops?

    This 16.4% decrease represents one of the largest supply drops in Ethereum’s history, surpassing previous significant accumulation phases.

    What’s the relationship with DeFi growth?

    Many withdrawals are likely heading to DeFi protocols, indicating growing confidence in Ethereum’s ecosystem rather than simple accumulation.

    Time to Read: 5 minutes

  • Bitcoin Price Target $112K: Key $94K Level Could Trigger Rally

    Bitcoin’s path to a potential $112,000 price target has emerged, with crypto analyst Ali Martinez identifying a crucial technical threshold that could trigger the next major rally. This analysis comes as Bitcoin continues testing critical support levels in March 2025.

    Critical Price Levels for Bitcoin’s Next Move

    Using Market Value to Realized Value (MVRV) Extreme Deviation Pricing Bands analysis, Martinez has outlined two pivotal price points that could determine Bitcoin’s trajectory. The primary threshold sits at $94,000 – a breakthrough above this level could catalyze a surge toward $112,000. Conversely, a drop below $76,000 might trigger a decline to $58,000 or potentially $44,000 in bearish conditions.

    SPONSORED

    Trade Bitcoin with up to 100x leverage and maximize your profit potential

    Trade Now on Defx

    Understanding MVRV Bands and Current Market Position

    MVRV Extreme Deviation Pricing Bands serve as a vital tool for identifying potential market tops and bottoms. Currently, Bitcoin trades between the mean (yellow band) and +0.5 standard deviation (orange band), suggesting a critical juncture for price action.

    Short Squeeze Potential and Market Sentiment

    Adding another dimension to the bullish case, crypto trader Merlijn The Trader has identified approximately $2 billion in short positions that could face liquidation if Bitcoin reaches $87,000. This potential short squeeze scenario aligns with recent shifts in market sentiment and declining open interest.

    Expert Analysis and Support Levels

    Rekt Capital emphasizes the importance of the $84,000 support level, noting that a daily close above this threshold is crucial for maintaining bullish momentum. Meanwhile, Arthur Hayes suggests that the recent drop to $77,000 may have marked this cycle’s bottom.

    FAQ Section

    What is the key price level Bitcoin needs to break?

    Bitcoin needs to break and hold above $94,000 to potentially reach the $112,000 target.

    What happens if Bitcoin falls below support?

    A drop below $76,000 could trigger a decline to $58,000 or potentially $44,000 in bearish conditions.

    How significant is the potential short squeeze?

    Approximately $2 billion in short positions could face liquidation if Bitcoin reaches $87,000, potentially accelerating price movement.