Tag: Market Analysis

  • Dogecoin Millionaires Drop 67% as Whales Accumulate DOGE in 2025

    Dogecoin Millionaires Drop 67% as Whales Accumulate DOGE in 2025

    The landscape of Dogecoin wealth distribution is experiencing a dramatic transformation in 2025, with the number of DOGE millionaires declining significantly while whale accumulation reaches new heights. Similar to recent trends seen in Bitcoin whale activity, large holders are strengthening their positions despite broader market volatility.

    Current State of Dogecoin Millionaires

    According to recent Bitinfocharts data, addresses holding Dogecoin worth $1.7 million or more have decreased to approximately 867. At the current DOGE price of $0.17, investors need to hold at least 5.8 million DOGE to achieve millionaire status.

    SPONSORED

    Trade Dogecoin with up to 100x leverage on perpetual contracts

    Trade Now on Defx

    Whale Accumulation Trends

    While smaller holders are experiencing decreased valuations, whale addresses show significant accumulation patterns:

    • 755 addresses hold between 10-100 million DOGE ($1.7M-$17M)
    • 97 addresses control 100M-1B DOGE ($17M-$170M)
    • 14 addresses own 1B+ DOGE ($170M+)
    • 1 mega-whale address holds between 10-100B DOGE

    Market Impact Analysis

    The concentration of wealth among larger holders could have significant implications for DOGE’s price stability and future movements. Recent meme coin market dynamics suggest increased institutional interest in this sector.

    FAQ Section

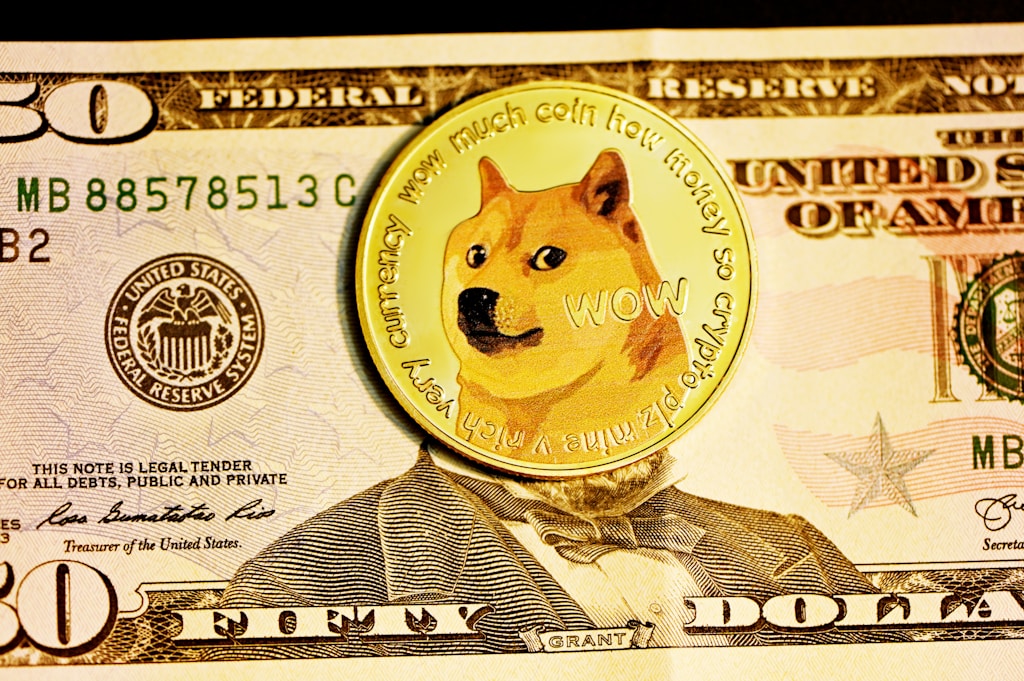
    How much Dogecoin do you need to be a millionaire?

    At the current price of $0.17, you need approximately 5.8 million DOGE to reach millionaire status.

    Are Dogecoin whales buying or selling?

    Large holders (whales) are actively accumulating, with significant increases in addresses holding 1-10 million DOGE.

    What’s the largest Dogecoin wallet value?

    The largest single wallet contains between 10-100 billion DOGE, worth potentially billions of dollars.

    As the market continues to evolve, these wealth distribution patterns could significantly impact Dogecoin’s future trajectory and price stability.

  • Robinhood, DTCC Ethereum Push Signals Major Institutional Shift

    Robinhood, DTCC Ethereum Push Signals Major Institutional Shift

    In a significant development for institutional crypto adoption, major financial players Robinhood, DTCC, and Bakkt are making strategic moves that could reshape the digital asset landscape. This comprehensive analysis examines the latest developments and their potential market impact.

    Key Market Developments

    The Depository Trust & Clearing Corporation (DTCC) has doubled down on its Ethereum strategy, marking a crucial step forward in traditional finance’s embrace of blockchain technology. This move comes as Ethereum’s TVL dynamics continue to evolve, suggesting a broader institutional interest in the network’s capabilities.

    Bakkt’s Strategic Transformation

    Bakkt Holdings, the cryptocurrency platform backed by Intercontinental Exchange (ICE), has announced another significant transformation of its business model. This restructuring, supported by its parent company, represents the latest attempt to capture market share in the increasingly competitive institutional crypto services sector.

    Robinhood’s Market Position

    Industry analysts are closely watching Robinhood’s cryptocurrency initiatives, as the platform continues to expand its digital asset offerings. The company’s strategic focus on crypto services comes at a time when institutional adoption is reaching new heights.

    SPONSORED

    Trade with confidence using advanced order types and up to 100x leverage

    Trade Now on Defx

    Market Impact Analysis

    These developments signal a broader trend of traditional financial institutions deepening their involvement in the cryptocurrency sector, potentially paving the way for increased institutional adoption and market maturity.

    FAQ Section

    What does DTCC’s Ethereum focus mean for institutional adoption?

    DTCC’s increased focus on Ethereum infrastructure suggests growing institutional confidence in blockchain technology for traditional financial operations.

    How might Bakkt’s transformation affect the crypto market?

    Bakkt’s strategic pivot could enhance institutional access to cryptocurrency services, potentially increasing market liquidity and stability.

    What role does Robinhood play in crypto adoption?

    Robinhood’s crypto initiatives are crucial in bridging the gap between retail and institutional investors, making digital assets more accessible to mainstream users.

  • Ethereum Whales Withdraw 360K ETH: Major Accumulation Signal?

    Ethereum Whales Withdraw 360K ETH: Major Accumulation Signal?

    In a significant market development, Ethereum investors have withdrawn over 360,000 ETH from centralized exchanges within just 48 hours, potentially signaling a major accumulation phase despite price uncertainty around the crucial $2,000 level.

    According to data from blockchain analytics firm Santiment, large holders have moved approximately $720 million worth of ETH to private wallets, suggesting growing confidence in Ethereum’s long-term prospects. This massive outflow coincides with recent analysis showing significant changes in Ethereum’s TVL distribution, painting a complex picture of network activity.

    SPONSORED

    Trade ETH with up to 100x leverage and maximize your potential returns

    Trade Now on Defx

    Exchange Outflows Signal Bullish Sentiment

    The massive withdrawal of ETH from exchanges typically indicates that investors are moving their assets into cold storage for long-term holding rather than keeping them readily available for trading. This behavior often precedes significant price movements, as reduced exchange supply can lead to increased scarcity and potential price appreciation.

    Price Action and Technical Analysis

    Ethereum currently trades at $1,960, struggling to reclaim the psychologically important $2,000 level. The recent price action has created a critical technical situation, with the potential for either a strong recovery or continued downside pressure. Technical analysts have identified a rare megaphone bottom pattern that could signal a major trend reversal if confirmed.

    Market Implications and Future Outlook

    The combination of large exchange withdrawals and technical price patterns suggests Ethereum may be approaching a critical juncture. Key resistance levels at $2,150 and $2,300 must be reclaimed for confirmation of a broader recovery trend. However, failure to hold current support could see ETH revisit lower levels around $1,850 or $1,750.

    FAQ Section

    Why are exchange withdrawals considered bullish?

    Exchange withdrawals reduce available supply for trading and often indicate long-term holding intentions, potentially leading to price appreciation due to reduced selling pressure.

    What could trigger an ETH recovery?

    A combination of sustained exchange outflows, improved macro conditions, and technical breakout above $2,000 could catalyze a broader recovery rally.

    What are the key support levels to watch?

    Critical support levels include $1,960 (current trading level), $1,850, and $1,750 as the last line of defense for bulls.

  • Bitcoin Price Tests $83K Support: Key Levels to Watch in March 2025

    Bitcoin Price Tests $83K Support: Key Levels to Watch in March 2025

    Key Takeaways:

    • Bitcoin currently trading between $83,745 and $84,089
    • 24-hour trading volume reaches $19.39 billion
    • Critical support level established at $83K
    • Market cap holding at $1.66 trillion

    Bitcoin’s price action is showing signs of weakening momentum as the leading cryptocurrency tests crucial support levels near $83,000. As highlighted in recent market analysis regarding triple witching effects, the current price movement suggests increasing bearish pressure.

    The cryptocurrency has established a trading range between $83,238 and $84,769 over the past 24 hours, with significant volume concentrated at the lower support zone. This price action comes amid broader market uncertainty, as recent data shows a 50% crash in Bitcoin’s hot supply, adding another layer of complexity to current market dynamics.

    Technical Analysis

    The current market structure shows several critical technical levels:

    • Immediate Support: $83,238
    • Key Resistance: $84,769
    • Volume Profile: $19.39 billion (24h)
    • Market Dominance: Holding steady with $1.66T market cap

    Market Sentiment Analysis

    Despite the current pullback, institutional interest remains robust. Recent surveys indicate 83% of institutions plan to increase their crypto holdings in 2025, suggesting strong fundamental support for Bitcoin’s long-term trajectory.

    SPONSORED

    Maximize your trading potential with up to 100x leverage on perpetual contracts

    Trade Now on Defx

    What to Watch

    Traders should monitor these key factors:

    • Daily close above $84,000 could signal trend continuation
    • Volume profile at support levels
    • Institutional flow metrics
    • Options market sentiment

    FAQ

    Q: What’s causing Bitcoin’s current price weakness?
    A: Multiple factors including profit-taking, triple witching effects, and reduced hot supply are contributing to current market conditions.

    Q: Is this a buying opportunity?
    A: While support at $83K remains strong, traders should wait for clear confirmation of trend continuation before making significant positions.

    Q: What’s the next major support level?
    A: Below $83K, the next significant support zone lies at $81,500, marked by previous resistance turned support.

  • Ethereum Forms Rare Megaphone Bottom Pattern: $6,000 Target Ahead

    Ethereum Forms Rare Megaphone Bottom Pattern: $6,000 Target Ahead

    Ethereum (ETH) has formed a rare technical pattern known as a megaphone bottom, last seen during the March 2020 market bottom, suggesting significant upside potential ahead. This development comes as institutional interest in crypto continues to surge, with 83% of investors planning to increase their crypto exposure in 2025.

    Technical Analysis Reveals Bullish Megaphone Pattern

    According to prominent crypto analyst TradingShot, Ethereum’s price structure has formed a distinctive megaphone bottom pattern, mirroring the formation last observed during the March 2020 market bottom. The pattern emerged following three consecutive red weekly candles, with ETH currently showing signs of a potential reversal at the critical MA50 level.

    Key Technical Indicators

    • Formation of lower lows trendline since March 11, 2024 high
    • One-year megaphone consolidation pattern
    • Fibonacci retracement levels showing strong alignment
    • Price target projection: $6,000 before cycle top

    Multiple Analysts Project Bullish Targets

    Supporting this bullish outlook, analyst Crypto Patel suggests an even more ambitious target of $8,000 during phase E of ETH’s current bull run. However, significant resistance is expected around the $4,050 level.

    SPONSORED

    Trade Ethereum with up to 100x leverage on perpetual contracts

    Trade Now on Defx

    Fundamental Catalysts Supporting Price Growth

    Several fundamental factors support the technical analysis:

    • Declining exchange reserves indicating reduced selling pressure
    • Whale accumulation: 360,000 ETH withdrawn in 48 hours
    • Potential ETF staking integration creating supply shock
    • Institutional interest driving demand

    FAQ Section

    What is a megaphone bottom pattern?

    A megaphone bottom pattern is a technical formation characterized by expanding price swings, with lower lows and higher highs, typically indicating a potential trend reversal when completed.

    What are the key resistance levels for Ethereum?

    Current analysis identifies major resistance levels at $4,050, $6,000, and $8,000, with the first significant hurdle at the $4,050 mark.

    How does ETF staking impact Ethereum’s price?

    ETF staking could remove significant amounts of ETH from circulation as institutional investors lock up their holdings for yield, potentially creating upward price pressure through reduced supply.

    At time of writing, Ethereum trades at $1,969, showing a 2% decline over 24 hours. Despite the short-term pullback, the confluence of technical and fundamental factors suggests strong potential for upward movement in the coming months.

  • XRP Price Stagnates at $2.40 Despite SEC Victory: Key Factors Explained

    XRP Price Stagnates at $2.40 Despite SEC Victory: Key Factors Explained

    The cryptocurrency market has witnessed an unexpected scenario as XRP’s price remains relatively stable around $2.40, despite Ripple’s definitive victory against the SEC. While many investors anticipated a dramatic surge following the SEC’s decision to drop its appeal, the modest 13% gain to $2.60 before settling at $2.40 has left many wondering about the underlying factors at play.

    Market Dynamics and Price Action Analysis

    According to market experts, the muted price response can be attributed to several key factors. As noted in recent developments regarding the potential XRP ETF approval, the market had already priced in much of the positive sentiment during the November 2024 rally from $0.50 to $2.50.

    Institutional Perspective and Market Sentiment

    Johnny Krypto, co-founder of Merlin, explains that anticipatory trading often leads to such scenarios: “The market had already priced in the lawsuit’s favorable outcome, similar to how recent Federal Reserve decisions have impacted the broader crypto market.”

    SPONSORED

    Trade XRP with up to 100x leverage on perpetual contracts

    Trade Now on Defx

    Macroeconomic Factors and Future Outlook

    The broader economic landscape, including trade tensions and Federal Reserve policies, continues to influence XRP’s price action. With interest rates holding steady at 4.25%-4.50% and ongoing concerns about stagflation, investors are showing increased caution across all risk assets.

    FAQ Section

    Why didn’t XRP price surge after the SEC victory?

    The market had largely priced in the positive outcome during the November 2024 rally, leading to a “buy the rumor, sell the news” scenario.

    What’s the next major catalyst for XRP?

    The potential approval of an XRP ETF and increased institutional adoption could serve as significant price catalysts in the coming months.

    How does the current price action compare to historical patterns?

    Unlike the rapid price movements of 2017, the current market cycle shows more gradual, institutionally-driven price action.

  • Bitcoin Hot Supply Crashes 50%: Liquidity Crisis or Bullish Signal?

    Bitcoin Hot Supply Crashes 50%: Liquidity Crisis or Bullish Signal?

    Recent on-chain data reveals a dramatic shift in Bitcoin’s market dynamics as the Hot Supply metric plummets by over 50% in just three months. This significant development could signal major changes ahead for the leading cryptocurrency’s price trajectory and market structure.

    Key Findings: Bitcoin’s Hot Supply Hits Critical Low

    According to data from Glassnode, Bitcoin’s Hot Supply – representing coins moved within the past week – has dropped from 5.9% to just 2.8% of total supply. This dramatic decline coincides with significant changes in Bitcoin’s open interest metrics, suggesting a broader shift in market dynamics.

    SPONSORED

    Trade Bitcoin with up to 100x leverage and maximize your profit potential

    Trade Now on Defx

    Market Impact Analysis

    The sharp reduction in Hot Supply carries several important implications:

    • Exchange inflows have decreased from 58,600 BTC to 26,900 BTC daily
    • Futures Open Interest has declined 35% from its ATH of $57 billion
    • Overall market liquidity shows significant contraction

    Expert Insights and Technical Analysis

    This liquidity contraction comes as Bitcoin maintains its position above $85,000, suggesting potential accumulation by long-term holders. The reduced trading activity could indicate a shift from speculative trading to strategic holding patterns.

    FAQ: Understanding Bitcoin’s Hot Supply Metric

    What is Bitcoin Hot Supply?

    Hot Supply refers to Bitcoin that has moved within the past week, indicating active trading or transfer activity.

    Why is the Hot Supply decrease significant?

    A decreasing Hot Supply typically indicates reduced selling pressure and potential accumulation by long-term investors.

    How does this affect Bitcoin’s price outlook?

    Reduced liquidity often precedes major price movements, though direction depends on broader market conditions and catalyst events.

    Market Outlook and Trading Implications

    With Bitcoin trading near $85,000 and liquidity metrics showing significant contraction, traders should monitor these key levels:

    • Support: $82,000
    • Resistance: $88,500
    • Critical volume zones: $84,000-$86,000

    This market development comes amid increasing institutional interest in cryptocurrency, suggesting potential for sustained price appreciation despite reduced trading activity.

  • Solaxy (SOLX) Presale Hits $27M: Analyst Projects 10x Growth

    The emerging Solana Layer-2 project Solaxy (SOLX) has captured significant attention in the crypto market, with its presale reaching an impressive $27 million milestone. As institutional interest in crypto continues to surge in 2025, this Layer-2 solution is positioning itself as a potential market leader.

    Solaxy Presale Analysis: Key Metrics and Growth Potential

    The Solaxy presale has demonstrated remarkable momentum, attracting both retail and institutional investors. Here’s a detailed breakdown of the project’s current status:

    • Total Funds Raised: $27 million
    • Current Presale Stage: Phase 3
    • Analyst Price Prediction: 10x potential from initial offering
    • Technology Focus: Solana Layer-2 scaling solution

    Technical Infrastructure and Market Position

    As a Layer-2 solution on Solana, Solaxy aims to address key scalability challenges while maintaining the network’s high-performance characteristics. The project’s technical architecture includes:

    • Advanced scaling technology
    • Enhanced transaction throughput
    • Reduced gas fees
    • Improved network efficiency

    SPONSORED

    Trade meme coins with leverage in spot margin on Solana

    Trade Now on Defx

    Expert Analysis and Price Predictions

    Leading crypto analysts have provided bullish forecasts for SOLX, citing several key factors:

    • Strong technical foundation
    • Growing market demand for Layer-2 solutions
    • Strategic positioning within the Solana ecosystem
    • Potential for rapid adoption post-launch

    Investment Considerations and Risk Factors

    While the potential for significant returns exists, investors should consider several factors:

    • Market volatility and timing risks
    • Competition from other Layer-2 solutions
    • Technical implementation challenges
    • Regulatory considerations

    Frequently Asked Questions

    What is Solaxy’s primary value proposition?

    Solaxy aims to enhance Solana’s scalability while maintaining high performance and low costs.

    How can investors participate in the presale?

    Investors can participate through the official Solaxy platform after completing KYC verification.

    What is the projected launch timeline?

    The project is expected to launch on major exchanges following the completion of the presale phases.

    Conclusion and Market Outlook

    The substantial presale success of Solaxy indicates strong market confidence in Layer-2 solutions for the Solana ecosystem. With analyst predictions suggesting significant upside potential, the project represents an interesting opportunity for early investors, though careful due diligence is essential.

  • XRP Price Plunges 5%: Bulls Battle to Defend Critical $2.35 Support

    XRP Price Plunges 5%: Bulls Battle to Defend Critical $2.35 Support

    Key Takeaways:

    • XRP price drops 5% to $2.37 in the last 24 hours
    • Market cap stands at $137 billion with $4.29 billion daily volume
    • Price currently 30% below all-time high of $3.40

    XRP’s price action has taken a bearish turn as the digital asset experiences significant selling pressure, dropping 5% over the past 24 hours. This decline comes amid broader market uncertainty, with the token currently trading at $2.37.

    This latest price movement follows recent network activity reaching an 11-month high, making the current pullback particularly noteworthy for traders and investors.

    Market Metrics and Trading Volume

    The cryptocurrency maintains a substantial market capitalization of $137 billion, positioning it firmly among the top digital assets. Trading volume has reached $4.29 billion, indicating significant market participation during this price action.

    Technical Analysis

    XRP has established a trading range between $2.37 and $2.52, with the lower bound currently being tested as crucial support. The asset trades 30% below its all-time high of $3.40, suggesting potential room for recovery if market sentiment improves.

    SPONSORED

    Trade XRP with up to 100x leverage on perpetual contracts

    Trade Now on Defx

    Market Outlook

    The current price action follows significant developments in the XRP ecosystem, including recent regulatory clarity with the SEC dropping its appeal. This context makes the current price movement particularly significant for long-term holders.

    FAQ

    Q: What is causing XRP’s price decline?
    A: The 5% decline appears to be part of a broader market correction, with increased selling pressure at the $2.50 resistance level.

    Q: What are the key support levels to watch?
    A: The immediate support lies at $2.35, with secondary support at $2.30.

    Q: How does this affect XRP’s long-term outlook?
    A: Despite the short-term decline, the fundamental outlook remains positive, supported by increasing network activity and regulatory clarity.

  • XRP Network Activity Hits 11-Month High: Price Eyes $3 Breakout

    XRP Network Activity Hits 11-Month High: Price Eyes $3 Breakout

    XRP’s network metrics are flashing major bullish signals as active addresses surge to levels not seen since April 2023, potentially setting the stage for significant price action. The cryptocurrency has demonstrated remarkable resilience amid broader market turbulence, maintaining crucial support levels while its network activity suggests growing adoption.

    According to recent Glassnode data, XRP has recorded nearly 627,000 active addresses – marking an 11-month high that coincides with growing institutional interest in XRP products. This surge in network participation comes at a critical time as the token trades above key support levels despite market-wide selling pressure.

    SPONSORED

    Trade XRP with up to 100x leverage on perpetual contracts

    Trade Now on Defx

    Network Fundamentals Signal Growing Adoption

    The spike in active addresses represents a significant milestone for XRP, suggesting increased user engagement and potential accumulation. Historical data shows that such network activity often precedes major price movements, as it indicates genuine user adoption rather than speculative trading.

    This surge in network activity aligns with recent technical analysis projecting significant upside potential for XRP. The token currently trades at $2.41, having bounced strongly from recent lows of $1.89 – a 33% recovery that demonstrates robust buyer interest.

    Technical Analysis: Key Support and Resistance Levels

    XRP’s price structure shows several critical levels that traders should monitor:

    • Current Support: $2.30
    • Major Resistance: $3.00
    • Secondary Support: $2.00
    • Previous Low: $1.89

    Market Outlook and Price Projections

    The combination of strong network metrics and technical support levels suggests XRP could be positioning for a significant move higher. The $3.00 level represents the next major psychological and technical resistance, with a breakthrough potentially opening the path to new highs.

    FAQ Section

    What does the surge in active addresses mean for XRP?

    Increased active addresses typically indicate growing network adoption and usage, which often correlates with positive price action.

    What are the key price levels to watch?

    The critical support level is $2.30, while $3.00 represents the next major resistance target.

    How does XRP’s performance compare to other cryptocurrencies?

    XRP has shown superior resilience compared to many altcoins, maintaining stronger support levels during recent market volatility.