Tag: Market Analysis

  • Bitcoin Buy Signal Emerges as BTC Tests Critical $78K Support Level

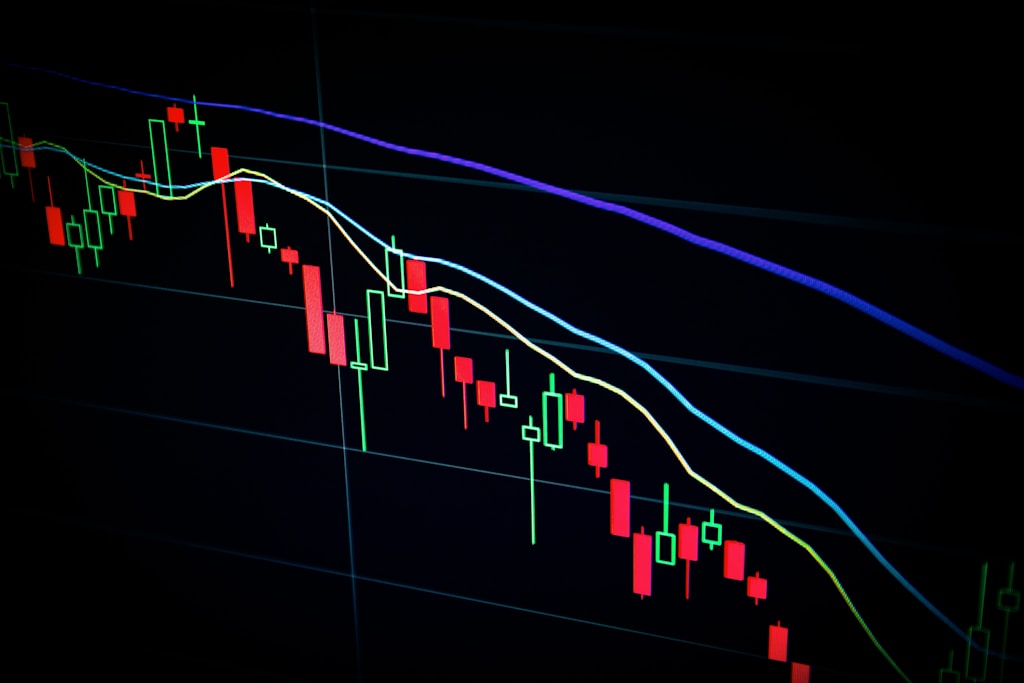
    Bitcoin (BTC) is showing signs of a potential trend reversal as multiple technical indicators align at a crucial support level. Leading crypto analysts have identified key buy signals that could mark the end of Bitcoin’s recent downtrend, which has seen the cryptocurrency drop nearly 30% from its 2025 peak.

    In a significant development that coincides with yesterday’s tariff-induced market turmoil, prominent crypto analyst Ali Martinez has identified a weekly TD Sequential buy signal for Bitcoin. This technical indicator has historically preceded major price reversals, suggesting that selling pressure may be approaching exhaustion.

    Technical Analysis Points to Potential Bitcoin Recovery

    The weekly TD Sequential buy signal is particularly noteworthy as it emerges while BTC trades near the critical $78,000 support level. This indicator typically manifests when a specific 9-count pattern completes, often marking the end of a prolonged downtrend.

    Adding weight to the bullish case, analyst Titan of Crypto highlights that Bitcoin is currently trading within a key reversal zone. The cryptocurrency remains above the crucial 38.2% Fibonacci retracement level, suggesting the broader uptrend remains intact despite recent volatility.

    SPONSORED

    Maximize your trading potential with up to 100x leverage on perpetual contracts

    Trade Now on Defx

    Market Context and Historical Perspective

    While the recent 26.6% decline from Bitcoin’s all-time high of $109,500 has rattled some investors, historical data suggests this pullback is relatively mild compared to previous market cycles. For context, BTC experienced significantly deeper corrections of 83% in 2018 and 73% in 2022.

    Looking Ahead: Key Levels to Watch

    Despite the emerging buy signals, traders should remain cautious as several technical indicators suggest the market may need more time to establish a solid bottom. The recent formation of a death cross pattern could signal additional short-term volatility before a sustained recovery takes hold.

    Frequently Asked Questions

    Q: What is the TD Sequential buy signal?
    A: It’s a technical indicator that identifies potential trend reversals based on a specific 9-count pattern in price action.

    Q: How significant is the current Bitcoin correction?
    A: The current 26.6% decline is relatively modest compared to historical corrections, which have exceeded 70-80%.

    Q: What key support levels should traders watch?
    A: The $78,000 level and the 38.2% Fibonacci retracement level are crucial support zones to monitor.

  • Bitcoin Price Crashes 8% as Trump’s China Tariffs Trigger $411M Liquidation

    Bitcoin Price Crashes 8% as Trump’s China Tariffs Trigger $411M Liquidation

    Bitcoin and Ethereum prices tumbled sharply on Wednesday as Trump’s aggressive tariffs on Chinese imports took effect, triggering widespread liquidations across crypto markets and traditional financial sectors.

    The leading cryptocurrency Bitcoin (BTC) plunged 8% to test critical support at $74,000, while Ethereum (ETH) saw similar losses, dropping below the psychological $3,000 level. The market turmoil resulted in over $411 million in liquidated positions over the past 24 hours.

    Market Impact of Escalating Trade War

    The latest selloff comes as tensions between the US and China reached new heights, with Trump’s administration implementing sweeping tariffs on Chinese goods. The move has sparked fears of a broader economic slowdown that could impact risk assets like cryptocurrencies.

    SPONSORED

    Protect your trades with up to 100x leverage on perpetual contracts

    Trade Now on Defx

    Technical Analysis and Key Support Levels

    Bitcoin’s price action suggests increased volatility ahead, with key support levels now being tested:

    • Primary support: $74,000
    • Secondary support: $72,500
    • Major resistance: $78,000

    Expert Outlook and Market Sentiment

    Despite the current downturn, some analysts remain optimistic. Tim Draper suggests that Bitcoin could actually benefit from the trade war as investors seek haven assets outside traditional markets.

    FAQ Section

    How long will the crypto market downturn last?

    Market analysts suggest the current correction could extend until trade tensions ease, with potential recovery signals emerging at the $72,500 support level.

    Will other cryptocurrencies be affected?

    Most altcoins are experiencing similar downward pressure, with market-wide correlation typically increasing during periods of macro uncertainty.

    What’s the next major support level for Bitcoin?

    If current levels fail to hold, the next major support zone lies at $72,500, followed by the psychological $70,000 level.

  • Bitcoin Whales Accumulate as Open Interest Drops 17% – Reversal Signal?

    Bitcoin Whales Accumulate as Open Interest Drops 17% – Reversal Signal?

    Bitcoin’s price action continues to face downward pressure, with the leading cryptocurrency testing critical support levels below $80,000. The latest on-chain data reveals a fascinating divergence between leveraged traders exiting positions and whale wallets aggressively accumulating – potentially signaling an upcoming trend reversal.

    As noted in recent whale accumulation analysis, large holders have been strategically increasing their positions during this correction phase.

    Open Interest Flush Signals Market Reset

    According to CryptoQuant analyst Maartunn, Bitcoin’s open interest metric has experienced a dramatic 17.8% decline over the past week. This substantial reduction in outstanding derivative contracts suggests leveraged traders are rapidly unwinding positions amid recent volatility.

    Historical data indicates that such sharp drops in open interest often precede significant market rebounds, as excessive leverage gets flushed out of the system. The current decline has eliminated billions in leveraged positions, potentially creating healthier market conditions for a sustained recovery.

    SPONSORED

    Trade Bitcoin with up to 100x leverage on perpetual contracts

    Trade Now on Defx

    Whale Accumulation Reaches Record Levels

    While leveraged traders exit, on-chain data reveals substantial whale accumulation. CryptoQuant contributor Onchained reports that accumulating addresses have increased their holdings from 800,000 BTC in 2023 to over 3 million BTC in 2025, with realized capitalization surging from $20 billion to $160 billion.

    This aggressive buying behavior, even during Bitcoin’s climb to new highs, demonstrates strong conviction from institutional players. The growing gap between retail and whale realized capitalization suggests high-capital investors are positioning for long-term appreciation.

    Market Implications and Future Outlook

    The combination of declining leverage and increasing whale accumulation creates an intriguing market dynamic. Three key implications emerge:

    • Growing supply constraints as more BTC moves to inactive wallets
    • Strong holder conviction across market cycles
    • Potential for significant supply shocks as accumulation continues

    Frequently Asked Questions

    What does declining open interest mean for Bitcoin’s price?

    Declining open interest typically indicates deleveraging in the market, which can create healthier conditions for sustainable price appreciation once excessive speculation is removed.

    How significant is the current whale accumulation?

    The increase from 800,000 to 3 million BTC held by accumulating addresses represents one of the largest concentrated accumulation phases in Bitcoin’s history.

    What are the key price levels to watch?

    Current critical support sits at $78,000, with major resistance at the recent high of $109,000. The market structure suggests these levels will be important for determining the next major trend.

  • Bitcoin Price Plunges to $75K as Trump Tariffs Spark Global Selloff

    Bitcoin Price Plunges to $75K as Trump Tariffs Spark Global Selloff

    Bitcoin’s price tumbled to $75,000 on Wednesday as Trump’s sweeping global tariffs triggered a widespread crypto market selloff, with major altcoins experiencing double-digit losses.

    Market Impact: Crypto Assets Face Severe Pressure

    The leading cryptocurrency’s decline comes amid escalating trade tensions, with Trump’s administration implementing a 104% tariff on Chinese goods and expanding import taxes to over 60 trading partners. This aggressive trade policy has sent shockwaves through both traditional and crypto markets.

    Key market movements include:

    • Ethereum (ETH) dropped 10%, leading losses among major cryptocurrencies
    • XRP, DOGE, BNB, SOL, and ADA all declined more than 5%
    • Overall crypto market cap decreased by 6%, extending weekly losses to 15%
    • Smaller tokens like BERA (-20%) and memecoins BONK, PEPE, and FLOKI (-9%) showed deeper losses

    Bond Market Turmoil Amplifies Crypto Selloff

    The cryptocurrency market’s decline coincided with unprecedented moves in the U.S. Treasury market. The 30-year yield surged over 20 basis points to 4.98%, marking the most significant three-day increase since 1982. Market experts, including Jim Bianco of Bianco Research, suggest this historic move likely resulted from forced liquidations rather than strategic trading decisions.

    SPONSORED

    Navigate market volatility with up to 100x leverage on perpetual contracts

    Trade Now on Defx

    Expert Analysis: Price Targets and Market Outlook

    Ryan Lee, Chief Analyst at Bitget Research, provides a balanced perspective on the market’s trajectory: “While further drops to $70,000-$75,000 are possible amid escalating trade tensions, this dip presents a strategic buying opportunity for long-term investors.”

    Key Support Levels and Recovery Scenarios

    Despite current bearish pressure, analysts maintain optimistic long-term projections:

    • Short-term support: $70,000-$75,000 range
    • Potential recovery target: $95,000-$100,000 by late 2025
    • Market cap potential: $3 trillion upon recovery
    • Bitcoin dominance: Currently near 60%, indicating market confidence

    FAQ: Understanding the Market Impact

    Q: How do Trump’s tariffs affect Bitcoin?
    A: Trade tensions typically increase market uncertainty, leading to risk-off sentiment that can pressure crypto prices alongside traditional markets.

    Q: Is this a good time to buy Bitcoin?
    A: While risks remain, analysts suggest dollar-cost averaging could be prudent, particularly with Bitcoin showing relative strength compared to altcoins.

    Q: What are the key levels to watch?
    A: Primary support lies at $70,000, with resistance at previous highs near $95,000.

    Looking Ahead: Market Catalysts

    Investors should monitor several factors that could influence Bitcoin’s price trajectory:

    • Development of trade negotiations
    • Bond market stability
    • Institutional adoption trends
    • Halving cycle effects

    While current market conditions present challenges, Bitcoin’s fundamental strengths – including institutional adoption and the upcoming halving – continue to provide long-term support for the cryptocurrency ecosystem.

  • Bitcoin Q1 Performance Slumps as Trade War Fears Intensify

    Bitcoin Q1 Performance Slumps as Trade War Fears Intensify

    The cryptocurrency market faced significant headwinds in Q1 2025, with Bitcoin and other digital assets experiencing notable downturns amid growing trade war concerns and waning investor confidence. Recent market analysis has shown Bitcoin dropping below $77K as trade tensions escalate, highlighting the broader impact of macroeconomic factors on crypto markets.

    Key Market Indicators Point to Investor Frustration

    The declining net unrealized profit/loss (NUPL) metric serves as a crucial indicator of market sentiment, suggesting growing frustration among cryptocurrency investors. This technical indicator measures the difference between unrealized profit and unrealized loss to gauge market participants’ overall position.

    Contributing Factors to Q1 Decline:

    • Escalating global trade tensions
    • Declining user sentiment metrics
    • Reduced institutional investment flow
    • Market uncertainty following 2024’s strong performance

    Bitcoin Dominance Trends Amid Market Turbulence

    Despite the overall market downturn, Bitcoin’s dominance has shown resilience, suggesting that investors are seeking refuge in the leading cryptocurrency during uncertain times. Recent data shows HODLers maintaining strong positions even as BTC tests crucial support levels.

    SPONSORED

    Navigate market volatility with up to 100x leverage on perpetual contracts

    Trade Now on Defx

    Market Outlook and Expert Analysis

    Market analysts suggest that the current downturn could present buying opportunities for long-term investors, though caution remains warranted given the uncertain macroeconomic environment.

    FAQ Section

    What caused Bitcoin’s Q1 2025 decline?

    The decline was primarily driven by trade war fears and reduced investor sentiment, as evidenced by declining NUPL metrics.

    Is the current market downturn different from previous cycles?

    Yes, this downturn is uniquely characterized by its correlation with global trade tensions rather than crypto-specific factors.

    What are the key support levels to watch?

    Current technical analysis suggests watching the $75K-$77K range as crucial support levels for Bitcoin.

  • XRP Price Targets $1.40 Support as ABC Correction Nears Completion

    XRP Price Targets $1.40 Support as ABC Correction Nears Completion

    XRP’s price action is entering a critical phase as a textbook ABC correction pattern nears completion, potentially offering strategic entry points for traders. This technical development comes amid broader crypto market uncertainty, with XRP recently breaking below key support levels.

    Understanding the ABC Correction Pattern

    Renowned crypto analyst Blockchain Backer has identified XRP’s current price movement as following a classic ABC corrective wave structure. This technical formation typically signals a temporary pullback before resuming the previous trend. Key observations include:

    • Wave A: Initial sharp decline completed
    • Wave B: Temporary relief rally exhausted
    • Wave C: Final leg targeting $1.40-$1.50 support zone

    Technical Indicators and Price Targets

    The analysis reveals several critical technical factors:

    • Price has broken below the 200-day Moving Average
    • Support zone aligns with 0.786 Fibonacci retracement
    • Potential 24% decline from current levels to reach target zone

    SPONSORED

    Trade XRP with up to 100x leverage on perpetual contracts

    Trade Now on Defx

    Recent Market Activity

    In the last 48 hours, XRP has demonstrated significant volatility:

    • Price dropped to $1.68 (20% decline)
    • Recovered to $1.86 (9.62% bounce)
    • Trading volume increased by 13.14%

    Expert Analysis and Outlook

    While the current correction may test trader patience, historical data suggests these patterns often precede significant recoveries. Recent analysis indicates longer-term bullish targets remain viable despite short-term weakness.

    Frequently Asked Questions

    What is an ABC correction pattern?

    An ABC correction is a three-wave pattern that represents a temporary price pullback within a larger trend. It’s commonly used in Elliott Wave Theory to identify potential reversal points.

    When might the correction complete?

    Based on current projections, the correction could complete once prices reach the $1.40-$1.50 support zone, though exact timing depends on market conditions.

    What are the key levels to watch?

    Critical levels include the current support at $1.68, the target zone of $1.40-$1.50, and the 200-day moving average as resistance.

  • XRP Price Warning: $1.90 Resistance Could Trigger 15% Drop

    XRP’s price action is showing concerning signals as the cryptocurrency struggles to maintain support above $1.90, with technical indicators suggesting an imminent bearish move that could lead to significant losses.

    Key XRP Price Levels to Watch

    XRP has entered a critical phase after failing to hold above the psychological $2.00 level. The digital asset is currently facing multiple technical hurdles that could trigger further downside movement. This follows the recent breakdown below $2.00, which has established a series of lower highs and lower lows.

    Technical Analysis Breakdown

    • Current price: Trading below $1.850 and the 100-hourly SMA
    • Key resistance: Bearish trendline at $1.90
    • Critical support: $1.750 and $1.70
    • Recent low: $1.610

    Bearish Indicators Mount

    Multiple technical factors are aligning to suggest continued downside pressure:

    • MACD showing increasing bearish momentum
    • RSI below 50, indicating bearish control
    • Price trading below key moving averages
    • Formation of a bearish trend line at $1.90

    SPONSORED

    Trade XRP with up to 100x leverage on perpetual contracts

    Trade Now on Defx

    Potential Price Scenarios

    If XRP fails to break above $1.90, we could see:

    • Initial drop to $1.750 support
    • Further decline to $1.70 if support breaks
    • Worst case scenario: Test of $1.60 zone

    Recovery Scenarios

    For bulls to regain control, XRP needs to:

    • Break above $1.90 resistance
    • Clear $2.00 psychological level
    • Target $2.050 and $2.0650 resistance zones

    FAQ

    Q: What’s causing XRP’s current price weakness?
    A: Technical factors including bearish trend line formation and trading below key moving averages are primary contributors.

    Q: What’s the key level to watch for recovery?
    A: The $1.90 resistance is crucial – a clear break above could signal trend reversal.

    Q: How low could XRP go in worst-case scenario?
    A: If support at $1.70 breaks, XRP could test the $1.60 zone.

    Conclusion

    XRP faces significant technical challenges ahead, with multiple indicators suggesting continued bearish pressure. Traders should watch the $1.90 resistance level closely while maintaining strict risk management practices.

  • Bitcoin Whale Activity Surges as BTC Rebounds from $74K – Key Levels

    Bitcoin Whale Activity Surges as BTC Rebounds from $74K – Key Levels

    Bitcoin’s price has staged a remarkable recovery from its recent $74,000 low, with on-chain data revealing a significant spike in whale activity that could signal further upside ahead. This analysis examines the latest whale movements and their potential impact on BTC’s price trajectory.

    Whale Transaction Count Hits 1,715 as Large Investors Step In

    According to data from on-chain analytics firm Santiment, Bitcoin whale activity witnessed a notable surge following the recent price dip. This aligns with previous whale accumulation patterns observed during major support tests.

    Key findings from the on-chain analysis:

    • Whale transactions (transfers over $1M) reached 1,715 on Monday
    • This represents a significant increase from weekend lows
    • Large entities appear to be capitalizing on the price dip

    SPONSORED

    Trade Bitcoin with up to 100x leverage on perpetual contracts

    Trade Now on Defx

    Ancient Bitcoin Movement Raises Concerns

    While whale activity suggests bullish momentum, a potentially bearish signal has emerged with the movement of 365 BTC that had remained dormant for over 10 years. Historical data indicates that such movements of ancient coins often precede increased market volatility.

    Technical Analysis and Price Levels

    After recovering to $81,000, Bitcoin has experienced a minor retracement to $79,700. The $80,000 level remains a crucial support zone that bulls need to defend to maintain upward momentum.

    Frequently Asked Questions

    What does increased whale activity mean for Bitcoin’s price?

    Historically, spikes in whale activity often precede significant price movements, as large investors typically have access to superior market intelligence and capital resources.

    Why is the movement of ancient Bitcoin significant?

    When long-dormant Bitcoin moves, it can indicate that even strong holders are considering selling, potentially signaling market uncertainty or upcoming volatility.

    What are the key support levels to watch?

    The immediate support lies at $79,700, with major support at $74,000. The $81,000 level serves as near-term resistance.

  • Market Crash Alert: Peter Schiff Warns of 50% Retail Collapse

    Market Crash Alert: Peter Schiff Warns of 50% Retail Collapse

    Renowned economist Peter Schiff has issued a stark warning about an impending market catastrophe, predicting a potential 50% crash triggered by Trump’s aggressive tariff policies. This development comes as cryptocurrency markets show increasing correlation with traditional finance amid global economic uncertainty.

    As Trump’s proposed tariff policies continue to shake market confidence, Schiff’s latest prediction adds fuel to growing concerns about economic stability.

    Key Points from Schiff’s Market Warning

    • Potential 50% market drawdown across retail sectors
    • Mass bankruptcies in the retail industry
    • Significant impact on banking sector stability
    • Recession risks comparable to Great Depression levels

    Impact on Crypto Markets

    The predicted market downturn could have significant implications for cryptocurrency markets, which have shown increasing correlation with traditional financial markets in recent years. Bitcoin’s recent price action has already demonstrated sensitivity to trade war concerns, suggesting crypto assets may not provide the safe haven some investors expect.

    SPONSORED

    Protect your portfolio with up to 100x leverage on perpetual contracts

    Trade Now on Defx

    Expert Analysis and Market Implications

    Financial experts are divided on Schiff’s prediction, with some pointing to strong underlying economic indicators while others acknowledge the potential risks of aggressive trade policies. The retail sector’s vulnerability to tariff-induced price increases could indeed trigger a domino effect across markets.

    Frequently Asked Questions

    How would a retail market crash affect crypto prices?

    Historical data suggests cryptocurrency markets could experience significant volatility during a major retail market downturn, potentially following traditional market trends due to increased institutional involvement.

    What are the key indicators to watch?

    Investors should monitor retail sales data, consumer confidence indices, and the implementation timeline of new tariff policies.

    How can investors protect their portfolios?

    Diversification across different asset classes, including both traditional and digital assets, remains crucial for risk management during market uncertainty.

    Market Protection Strategies

    • Portfolio diversification across multiple asset classes
    • Implementation of stop-loss orders
    • Regular portfolio rebalancing
    • Maintaining adequate cash reserves

    As markets digest these warnings, investors are advised to maintain vigilant portfolio management and consider protective positions across both traditional and digital asset classes.

  • Ethereum Transaction Fees Hit 4-Year Low: Network Activity Plunges 60%

    Ethereum Transaction Fees Hit 4-Year Low: Network Activity Plunges 60%

    The Ethereum network is experiencing a dramatic shift in its ecosystem dynamics, with transaction fees plummeting to levels not seen since 2020. This significant development signals major changes in network usage patterns and could reshape the landscape of decentralized finance (DeFi) and NFT markets.

    Transaction Fee Crisis: Understanding the 60% Drop

    According to data from IntoTheBlock, Ethereum’s transaction fees have nosedived by approximately 60% during Q1 2025, with total fees dropping to just $208 million by April 4. This marks the lowest level in four years, raising concerns about network activity and validator revenues.

    This dramatic decline coincides with increased Layer-2 adoption, particularly following the successful implementation of the Dencun upgrade. Base, a leading Layer-2 solution, has emerged as a dominant force, processing over 80 transactions per second.

    SPONSORED

    Trade Ethereum with up to 100x leverage on perpetual contracts

    Trade Now on Defx

    Market Impact and Price Analysis

    The fee reduction has coincided with a significant price decline, with ETH experiencing its worst Q1 performance since 2022, dropping 45%. The ETH/BTC pair has reached a 5-year low, though whale investors continue accumulating below $1,800.

    Key Support Levels and Future Outlook

    On-chain analyst MAC_D identifies critical support levels:

    • Current realized price: $2,200
    • Whale cost basis (100,000+ ETH holders): $1,290
    • Historical bottom support: $870

    FAQ: Ethereum Network Performance

    What’s causing the drop in transaction fees?

    The primary factors include Layer-2 adoption, the Dencun upgrade implementation, and reduced network congestion.

    How does this affect validators?

    Lower transaction fees mean reduced revenues for validators, potentially impacting network security and staking economics.

    Will Layer-2 solutions continue to impact main chain fees?

    Yes, as Layer-2 solutions mature and gain adoption, main chain fees are likely to remain lower than historical averages.