Tag: Market Analysis

  • Bitcoin Price Drops Below $77K as Trump Trade War Fears Intensify

    Key Takeaways:

    • Bitcoin retreated from $80,000 to sub-$77K levels amid market uncertainty
    • Traditional stock markets showed resilience with major indices posting gains
    • Trump-related policy concerns continue to influence crypto market sentiment

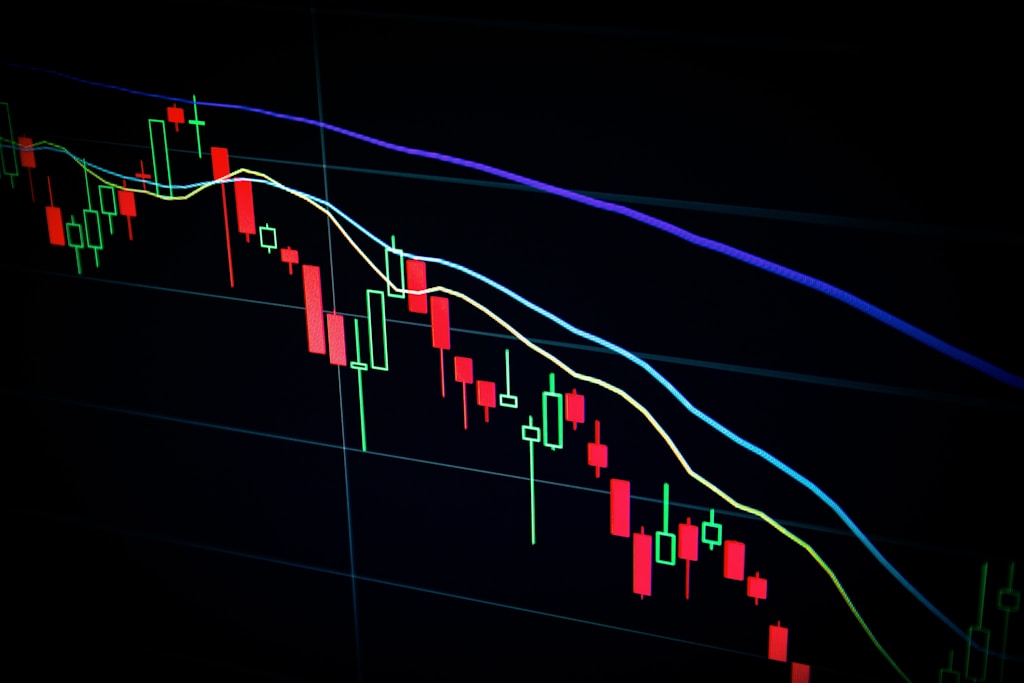
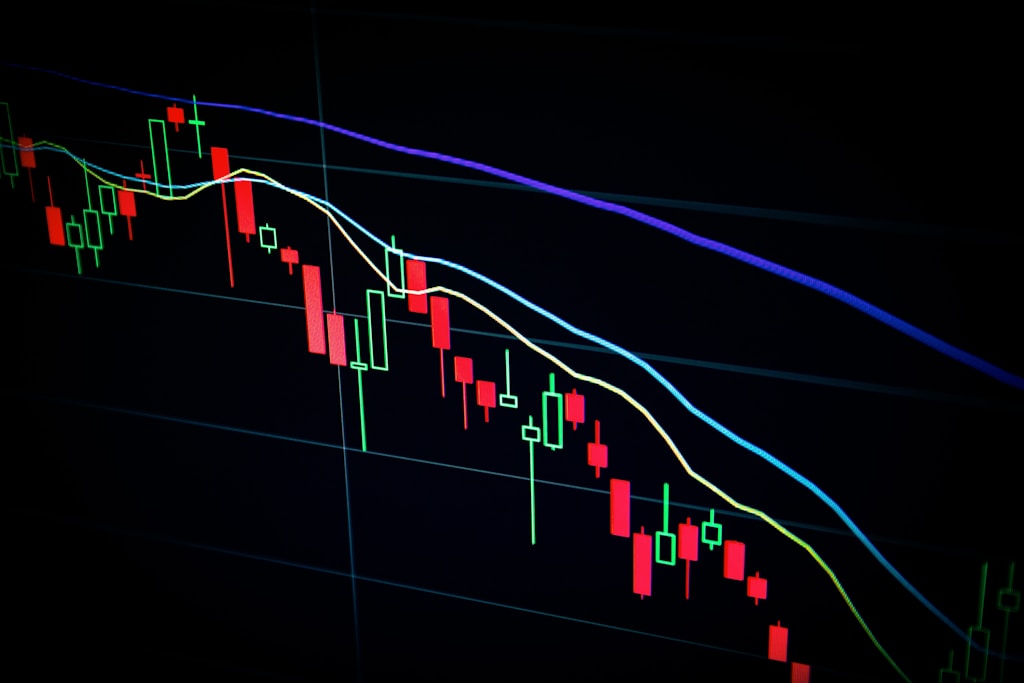
    Bitcoin’s price action took a bearish turn on Tuesday as the leading cryptocurrency failed to maintain its position above the crucial $80,000 level. The digital asset initially touched $80,000 during early trading hours before experiencing a significant pullback, with prices dropping below $77,000 amid growing concerns over Trump’s escalating trade war rhetoric and its potential impact on global markets.

    Market Analysis: Stock Rally Fails to Support Bitcoin

    Despite positive movements in traditional markets, with all three major stock indices posting gains, Bitcoin’s correlation with risk assets appears to be weakening. This divergence suggests that crypto-specific factors, including regulatory uncertainty and political developments, are currently driving price action.

    SPONSORED

    Trade Bitcoin with up to 100x leverage and maximize your profit potential

    Trade Now on Defx

    Technical Outlook

    Key support levels to watch:

    • Primary support: $75,000
    • Secondary support: $72,500
    • Critical resistance: $80,000

    Market Impact of Political Uncertainty

    The recent market volatility comes as traders digest the implications of potential policy shifts under a possible Trump administration. Recent data shows significant outflows from digital asset funds, indicating growing institutional caution.

    Expert Analysis

    Market analysts suggest that while the current pullback may present buying opportunities, investors should remain cautious given the heightened political uncertainty and potential regulatory changes ahead.

    FAQ Section

    Q: What’s causing Bitcoin’s current price volatility?
    A: A combination of Trump-related policy concerns, profit-taking after reaching $80K, and shifting institutional sentiment.

    Q: Could Bitcoin recover to $80K in the near term?
    A: Technical indicators suggest consolidation may be needed before another attempt at the $80K level.

    Q: How are institutional investors responding?
    A: Recent data shows some institutional investors taking defensive positions with increased outflows from digital asset funds.

  • Ripple’s $1.25B Hidden Road Deal Marks Crypto Market Turning Point

    In a landmark move that signals a major shift in the institutional crypto landscape, Ripple has announced its acquisition of brokerage powerhouse Hidden Road for $1.25 billion. This strategic purchase, coming on the heels of XRP’s historic ETF debut, represents one of the largest M&A deals in crypto history.

    Strategic Timing and Market Impact

    The acquisition comes at a crucial moment for the crypto industry, with regulatory clarity emerging following the SEC’s decision to drop its case against Ripple. This development, coupled with ongoing market volatility due to trade tensions, positions Ripple strategically for institutional adoption.

    SPONSORED

    Trade XRP with up to 100x leverage on perpetual contracts

    Trade Now on Defx

    Hidden Road’s Market Position

    Hidden Road’s impressive $3 trillion annual clearing volume and relationships with over 300 institutional clients provide Ripple with immediate access to the traditional finance sector. This acquisition positions Ripple to bridge the gap between crypto and institutional finance more effectively than ever before.

    Market Momentum and Industry Consolidation

    The deal follows a broader trend of crypto industry consolidation, including Kraken’s $1.5 billion NinjaTrader acquisition. Q1 2025 saw venture funding in the crypto space surge to $3.8 billion, marking a 138% increase from the previous quarter.

    FAQ Section

    What does this acquisition mean for XRP holders?

    The acquisition is expected to increase institutional adoption of XRP and potentially drive greater liquidity in the market.

    How will this affect Ripple’s regulatory standing?

    With the SEC case resolved and this strategic acquisition, Ripple strengthens its position as a compliant, institutional-grade financial services provider.

    What’s the timeline for integration?

    While specific details haven’t been announced, the integration process is expected to complete within 12-18 months.

  • XRP Price Crashes Below $2 as Head-and-Shoulders Pattern Signals Further Drop

    XRP’s price has plunged below the critical $2 mark amid escalating global market tensions, with technical analysis suggesting more pain ahead for the sixth-largest cryptocurrency by market cap. The broader crypto market continues to reel from aggressive new U.S. tariff measures, sending risk assets into a tailspin.

    Renowned crypto analyst Ali Martinez has identified a concerning technical development – a head-and-shoulders pattern formation that could signal further downside for XRP. This bearish technical setup typically precedes larger corrections, with Martinez projecting a potential drop toward the $1.30 support level.

    SPONSORED

    Trade XRP with up to 100x leverage on perpetual contracts

    Trade Now on Defx

    Technical Analysis Points to $1.30 Target

    The head-and-shoulders pattern, widely regarded as a reliable bearish reversal signal, suggests XRP could see a sustained move lower unless bulls can quickly reclaim the $2 level. The pattern’s measured move points to $1.30 as the next major support zone, coinciding with historical demand areas.

    Currently trading at $1.86, XRP has already shed over 50% from its recent peak. The selloff aligns with broader crypto market outflows, as institutional investors reduce exposure to digital assets amid growing macroeconomic concerns.

    Key Support Levels to Watch

    • Current support: $1.86
    • Critical resistance: $2.00
    • Next major support: $1.50
    • Pattern target: $1.30

    Market Outlook and Trading Implications

    For XRP to invalidate the bearish outlook, bulls need to push prices back above $2 and hold that level. A successful reclaim could trigger a relief rally toward $2.20. However, with global markets still processing the impact of new trade tensions, upside momentum may remain limited in the near term.

    Frequently Asked Questions

    What is causing XRP’s price decline?

    The primary factors include broader market reaction to U.S. trade tariffs, technical selling following the head-and-shoulders breakdown, and general risk-off sentiment in crypto markets.

    Could XRP recover from here?

    While recovery is possible if bulls reclaim $2, the technical setup and macro environment suggest continued pressure in the near term.

    What are the key levels to watch?

    The critical resistance is $2.00, while major support levels exist at $1.86, $1.50, and the pattern target of $1.30.

  • Bitcoin HODLers Show Iron Hands as BTC Tests $80K Support Level

    Bitcoin HODLers Show Iron Hands as BTC Tests $80K Support Level

    As global trade tensions spark a broad market correction, Bitcoin’s long-term holders are demonstrating remarkable resilience in the face of mounting selling pressure. On-chain data reveals a striking absence of panic selling despite BTC’s 30% decline from all-time highs, suggesting underlying confidence remains strong even as prices test critical support levels.

    SPONSORED

    Trade Bitcoin with up to 100x leverage on perpetual contracts

    Trade Now on Defx

    HODLers Stand Firm Amid Market Turbulence

    According to data from CryptoQuant, Bitcoin’s Daily Realized Profit Loss Ratio shows a notable absence of capitulation signals, with long-term holders maintaining their positions despite significant market volatility. This behavior stands in stark contrast to recent ETF outflows reaching $109M as institutional investors reduce exposure.

    Technical Analysis: Critical Support Levels

    Bitcoin currently trades at $79,600, having narrowly avoided a breakdown below $75,000. The $80,000 level represents immediate resistance, with bulls needing to reclaim this threshold to prevent further deterioration in market structure. A failure to hold current levels could trigger a cascade to the $70,000 range.

    Market Impact of Trade War Escalation

    The broader crypto market faces increased pressure as escalating trade tensions and aggressive tariff policies fuel uncertainty across global financial markets. However, the steady behavior of long-term holders could provide crucial support for Bitcoin’s price action in the coming weeks.

    FAQ

    Q: What is causing Bitcoin’s current price decline?
    A: The primary factors include trade war fears, macroeconomic instability, and institutional outflows from crypto investment products.

    Q: Why aren’t HODLers selling their Bitcoin?
    A: On-chain data suggests long-term holders maintain strong conviction in Bitcoin’s fundamentals despite short-term market volatility.

    Q: What are the key price levels to watch?
    A: The critical support zone lies at $75,000, while $80,000 represents immediate resistance that bulls must reclaim for positive momentum.

  • Ripple’s $1.25B Hidden Road Acquisition Signals Major Crypto Shift

    Ripple’s $1.25B Hidden Road Acquisition Signals Major Crypto Shift

    In a groundbreaking move that signals major institutional adoption, Ripple Labs has announced its acquisition of prime brokerage firm Hidden Road for $1.25 billion. This strategic purchase marks one of the largest deals in the cryptocurrency industry’s history and positions Ripple for significant expansion in traditional finance markets.

    Key Highlights of the Ripple-Hidden Road Deal

    • Acquisition value: $1.25 billion
    • Target company: Hidden Road (prime brokerage firm)
    • Strategic importance: Enhances institutional service offerings
    • Industry impact: Largest crypto-TradFi acquisition of 2025

    This strategic move comes at a crucial time for Ripple, as recent reports predict the tokenization market to hit $18.9T by 2033. The acquisition positions Ripple to capitalize on this growing market opportunity while expanding its institutional service offerings.

    Impact on XRP and Market Dynamics

    The acquisition announcement comes amid interesting price action for XRP. Recent analysis shows XRP struggling at key support levels, but this development could provide the catalyst needed for a significant price movement.

    SPONSORED

    Trade XRP with up to 100x leverage on perpetual contracts

    Trade Now on Defx

    Strategic Benefits for Ripple

    • Enhanced institutional access to crypto markets
    • Improved liquidity solutions for XRP
    • Expanded traditional finance integration
    • Strengthened regulatory compliance framework

    FAQ Section

    What does this acquisition mean for XRP holders?

    The acquisition could potentially increase institutional adoption of XRP and improve market liquidity.

    How will this affect Ripple’s market position?

    This move significantly strengthens Ripple’s position in both crypto and traditional finance markets.

    When will the acquisition be completed?

    The deal is expected to close in Q3 2025, subject to regulatory approvals.

    Market Implications and Future Outlook

    This strategic acquisition positions Ripple for significant growth in the institutional market, potentially setting the stage for broader crypto adoption in traditional finance.

  • Bitcoin Drops to $78K as Stock Markets Rally 3% on Trade Deal Hopes

    Bitcoin Drops to $78K as Stock Markets Rally 3% on Trade Deal Hopes

    Bitcoin (BTC) is experiencing an unexpected decoupling from traditional markets today, sliding back to $78,000 while global stock indices post significant gains. As previously reported, Bitcoin has been testing crucial $80K support levels, and today’s price action further validates those concerns.

    Market Divergence: Stocks Surge While Bitcoin Retreats

    The cryptocurrency market is showing signs of strain as Bitcoin retreats from earlier highs above $80,000, now trading just above $78,000. This movement comes in stark contrast to traditional markets, where the Nasdaq has surged 3% and the S&P 500 is following closely behind.

    SPONSORED

    Trade Bitcoin with up to 100x leverage and maximize your profit potential

    Trade Now on Defx

    Global Market Response to Trade Deal Developments

    The stock market rally has been fueled by positive developments in international trade relations:

    • President Trump’s announcement of an imminent trade deal with South Korea
    • Treasury Secretary Scott Bessent’s optimistic outlook on U.S.-China relations
    • European markets up 3%
    • Japan’s Nikkei index posting a remarkable 6% gain

    Bitcoin’s Performance in Context

    While today’s divergence might concern some investors, a broader perspective reveals important context:

    • 9% decline since Wednesday’s tariff announcement
    • 30% retreat from mid-January’s all-time high
    • Still up 14% since November’s election

    Recent data shows significant Bitcoin outflows as investors respond to trade tariff concerns, suggesting a potential correlation between policy uncertainty and crypto market behavior.

    FAQ Section

    Why is Bitcoin declining while stocks are rising?

    The divergence appears to be temporary, with both assets showing similar overall performance since last week’s tariff announcements.

    What are the key support levels to watch?

    The critical support zone lies around $75,000, which was tested during weekend trading.

    How does this affect Bitcoin’s long-term outlook?

    Despite short-term volatility, Bitcoin remains in a positive position year-to-date, up 14% since November.

    Market Outlook

    While the current divergence between crypto and traditional markets may seem concerning, historical data suggests these decoupling events are often temporary. Traders should monitor the $75,000 support level and watch for potential stabilization as global trade tensions ease.

  • Bitcoin ETF Outflows Hit $109M: Market Sentiment Shifts Bearish

    Key Takeaways:

    • Bitcoin ETFs recorded $109 million in outflows on Monday
    • Negative flow continues for third consecutive trading day
    • Ethereum ETFs show unusual zero activity

    Bitcoin ETF markets faced significant pressure on Monday as investors withdrew $109 million, marking the third consecutive day of outflows. This bearish trend aligns with recent market volatility that saw Bitcoin price dropping below $75,000, suggesting growing caution among institutional investors.

    Understanding the Bitcoin ETF Exodus

    The latest outflow data reveals a concerning pattern in the Bitcoin ETF market. This continuing negative trend follows broader digital asset fund outflows, indicating a possible shift in institutional sentiment.

    SPONSORED

    Trade Bitcoin with up to 100x leverage on perpetual contracts

    Trade Now on Defx

    Ethereum ETF Market Goes Silent

    In an unusual development, Ethereum ETFs recorded zero activity during Monday’s trading session. This complete absence of trading volume comes as Ethereum prices continue to struggle at key support levels.

    Market Impact Analysis

    The continued ETF outflows could signal broader market uncertainty, potentially influenced by:

    • Macroeconomic concerns
    • Profit-taking after recent rallies
    • Shifting institutional strategies

    FAQ Section

    Q: What’s causing the Bitcoin ETF outflows?
    A: Multiple factors including profit-taking, market uncertainty, and broader economic concerns are contributing to the current outflow trend.

    Q: Why did Ethereum ETFs show no activity?
    A: The unusual silence in Ethereum ETF trading could indicate investor hesitation amid current market conditions and price struggles.

    Q: What does this mean for Bitcoin’s price outlook?
    A: Continued ETF outflows could put additional pressure on Bitcoin prices in the short term, though long-term fundamentals remain unchanged.

    Looking Ahead

    Investors should monitor ETF flow patterns in the coming days for signs of sentiment shift. The unusual combination of Bitcoin outflows and Ethereum inactivity could signal a crucial market turning point.

  • Bitcoin Open Interest Signals Major Move as Price Tests $80K Support

    Bitcoin’s price has rebounded to $80,000 following a sharp decline triggered by escalating tensions around US trade policies, with market data suggesting a significant move could be imminent based on futures positioning.

    Market Capitalization and Bitcoin Dominance

    Despite recent volatility, Bitcoin’s market capitalization remains robust at $1.5 trillion. The leading cryptocurrency’s market dominance has surged to 60%, indicating a clear flight to quality as Bitcoin increasingly serves as a safe haven amid global economic uncertainty.

    SPONSORED

    Trade Bitcoin with up to 100x leverage on perpetual contracts

    Trade Now on Defx

    Futures Market Analysis

    The futures market is showing surprising resilience despite recent turbulence. Open interest currently sits at $34.5 billion, with a notable shift in positioning that could signal an impending volatility spike:

    • Cash-margined open interest: Declined from $30B to $27B
    • Crypto-margined open interest: Dropped from $7.5B to $6.9B
    • Crypto-collateralized futures: Increased to 21% of total open interest

    Limited Liquidations Point to Controlled Selling

    The past 24 hours saw relatively modest liquidations totaling $58 million, with longs accounting for $42 million and shorts $16.6 million. This controlled unwinding suggests the market isn’t overleveraged, reducing the risk of a cascade of forced selling.

    Institutional Adoption Continues

    Despite market volatility, institutional interest remains strong with 76 new entities holding over 1,000 BTC joining the network in the past two months – a 4.5% increase in large holders.

    FAQ Section

    What does rising open interest mean for Bitcoin’s price?

    Rising open interest typically indicates increasing market participation and can signal potential volatility ahead as more capital enters the market.

    Why are liquidations important to monitor?

    Liquidation levels help gauge market leverage and potential cascade risks. Lower liquidations suggest a healthier market structure.

    How does Bitcoin’s safe haven status affect its price action?

    As a safe haven asset, Bitcoin often sees increased demand during periods of economic uncertainty, potentially supporting prices despite broader market volatility.

  • Ethereum Price Crashes 30% to 2023 Low: $1,400 Support Tested

    Ethereum Price Crashes 30% to 2023 Low: $1,400 Support Tested

    Key Takeaways:

    • Ethereum (ETH) plunges to $1,409, marking its lowest level since March 2023
    • Price has declined 29.6% over the past 30 days
    • ETH/BTC ratio reaches levels not seen since 2020

    Ethereum’s price action has taken a dramatic turn as the leading smart contract platform plummeted to critical support levels not seen since early 2023. This price movement follows the broader bearish trend that began when ETH first tested $1,500 support, suggesting a potential continuation of downward momentum.

    Market Analysis: Understanding the ETH Crash

    The recent price action has several key technical and fundamental factors worth examining:

    • Support Level Test: $1,409 represents a critical psychological and technical support
    • Volume Analysis: Trading volume has increased significantly during the selloff
    • Market Sentiment: Fear & Greed Index indicates “Extreme Fear”

    SPONSORED

    Trade ETH with up to 100x leverage and maximize your profit potential

    Trade Now on Defx

    Technical Indicators and Price Targets

    The technical picture shows several concerning signals:

    • RSI: Currently in oversold territory at 25
    • MACD: Showing continued bearish momentum
    • 200-day Moving Average: Price trading well below this key indicator

    What’s Next for Ethereum?

    Key levels to watch:

    • Immediate Support: $1,400
    • Secondary Support: $1,280
    • Key Resistance: $1,550

    FAQ Section

    Q: What’s causing Ethereum’s price drop?
    A: Multiple factors including market sentiment, technical breakdown, and broader crypto market weakness.

    Q: Could ETH drop below $1,000?
    A: While possible, strong historical support exists around $1,000-1,200 range.

    Q: When might we see a recovery?
    A: Technical indicators suggest oversold conditions, but recovery depends on broader market sentiment and support level holds.

  • Fed Emergency Rate Cut Looms as Trump Tariffs Shake Markets

    Fed Emergency Rate Cut Looms as Trump Tariffs Shake Markets

    The Federal Reserve faces mounting pressure for an emergency rate cut as President Trump’s aggressive trade policies send shockwaves through global markets. Recent escalations in the tariff war have intensified recession fears and market volatility, forcing the Fed to consider drastic monetary policy action.

    Key Market Impacts of Trump’s Tariff Announcement

    • Wall Street experiencing significant downturn
    • Bond yields dropping as investors seek safe havens
    • Increased volatility across global markets
    • Growing speculation of Fed intervention

    As cryptocurrency markets react to the tariff crisis, traders are closely monitoring potential Fed responses that could reshape both traditional and digital asset markets.

    Emergency Rate Cut Speculation Intensifies

    Market analysts are increasingly betting on an emergency rate cut by the Federal Reserve, with some experts predicting action as soon as next week. This comes as economic indicators suggest mounting pressure on global trade relationships and domestic growth prospects.

    SPONSORED

    Navigate market volatility with up to 100x leverage on perpetual contracts

    Trade Now on Defx

    Market Expert Analysis

    Financial experts warn that the combination of trade tensions and potential monetary policy shifts could create significant market turbulence in the coming weeks. Leading analysts have highlighted broader systemic risks beyond the immediate tariff impact.

    FAQ: Trade War Impact on Markets

    How will an emergency rate cut affect markets?

    An emergency rate cut would likely provide immediate market relief but could signal deeper economic concerns.

    What sectors are most vulnerable to tariff impacts?

    Technology, manufacturing, and consumer goods sectors face the highest exposure to tariff-related disruptions.

    How might crypto markets respond?

    Cryptocurrency markets may see increased inflows as investors seek alternative stores of value during periods of traditional market uncertainty.