XRP Price Alert: $2.13 Support Level Critical for 5% Relief Rally
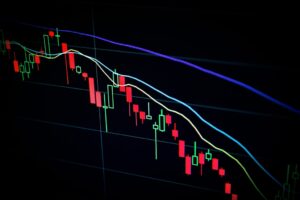
XRP faces a crucial moment as the fourth-largest cryptocurrency tests a vital support level at $2.13, with technical analysis suggesting...
XRP faces a crucial moment as the fourth-largest cryptocurrency tests a vital support level at $2.13, with technical analysis suggesting...

Bitcoin's market dominance has reached a critical threshold of 64%, potentially signaling an imminent altcoin season as technical indicators suggest...
The meme coin market saw unexpected volatility today as PEPE experienced a dramatic 5% surge following former US President Donald...
XRP's price action is showing critical weakness across multiple timeframes, with technical indicators suggesting a potential bear trap formation. As...
Key Takeaways:Bitcoin price drops from $109,000 to $104,500Fear and Greed Index shifts from 'extreme greed' to 'neutral'Market sentiment indicates potential...
Bitcoin's price trajectory faces potential turbulence as prominent crypto analyst Altcoin Sherpa suggests a possible crash to $50,000, though later...

The cryptocurrency market faces renewed uncertainty as expert analysis suggests Federal Reserve interest rate cuts may be further delayed than...

In a significant market shift, Bitcoin ETFs experienced their second consecutive day of outflows, with $616 million exiting the market,...

XRP's price trajectory has entered a critical phase as the cryptocurrency faces mounting bearish pressure that threatens to push it...

Bitcoin's meteoric rise to new all-time highs appears to be losing steam, with multiple technical indicators suggesting a potential correction...


