Tag: Market Analysis

  • Bitcoin Price Crashes Below $75K as Global Markets Face Trade War

    Bitcoin Price Crashes Below $75K as Global Markets Face Trade War

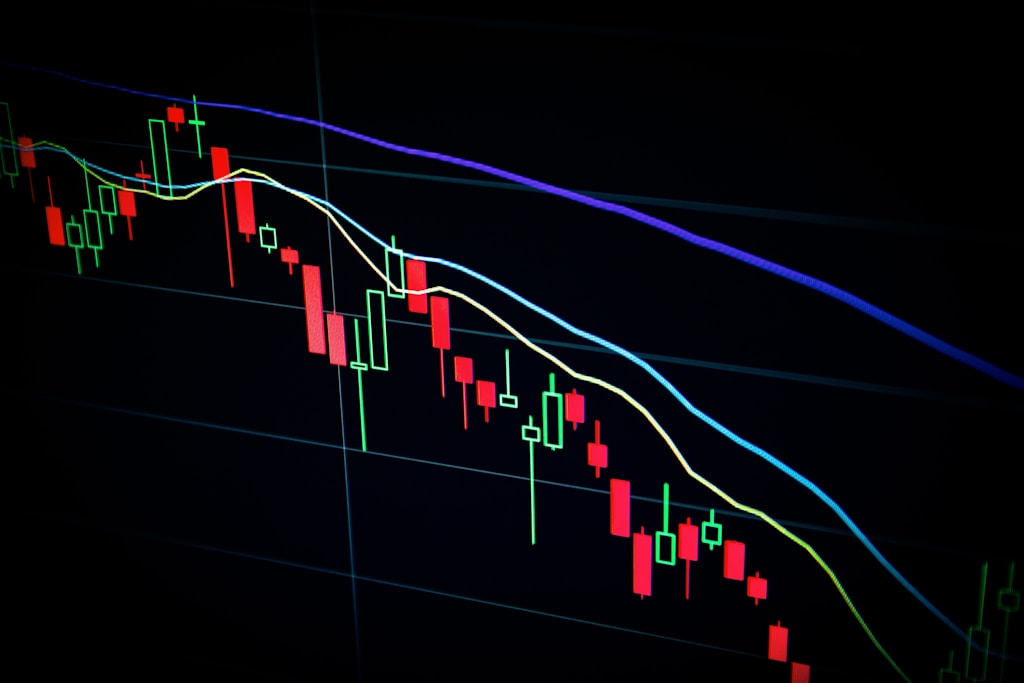
    Bitcoin’s price plummeted below the critical $75,000 level today, marking a significant downturn as global markets react to escalating trade tensions between major economies. This price movement follows last weekend’s massive selloff that erased $160B in market value.

    Market Analysis: Trade War Impact on Crypto Assets

    The latest price action shows Bitcoin struggling to maintain support levels, with the leading cryptocurrency experiencing significant selling pressure across major exchanges. This decline comes amid broader market concerns about the impact of new trade tariffs on global financial markets.

    Key Market Statistics:

    • Current Bitcoin Price: Below $75,000
    • 24-hour Trading Volume: Significantly elevated
    • Market Sentiment: Risk-off
    • Global Market Correlation: High

    Trade War Effects on Crypto Markets

    The ongoing trade tensions between the United States and its key trading partners, including China and Europe, have triggered a broad sell-off in risk assets. Cryptocurrency markets, traditionally viewed as a hedge against traditional market uncertainty, are showing increased correlation with global risk sentiment.

    SPONSORED

    Trade Bitcoin with up to 100x leverage and maximize your profit potential

    Trade Now on Defx

    Expert Analysis and Market Outlook

    Market analysts suggest that the current price action could lead to further downside if global trade tensions continue to escalate. However, some experts point to strong fundamental factors that could support a recovery.

    Frequently Asked Questions

    What caused Bitcoin’s price drop below $75K?

    The price decline is primarily attributed to global market uncertainty surrounding trade war tensions and a broader sell-off in risk assets.

    Will Bitcoin recover from this dip?

    While short-term volatility remains likely, historical patterns suggest potential recovery once market uncertainty subsides.

    How does the trade war affect crypto markets?

    Trade wars can impact crypto markets through increased correlation with traditional risk assets and reduced investor appetite for speculative investments.

    Technical Outlook and Support Levels

    Key support levels to watch:

    • Primary Support: $73,500
    • Secondary Support: $71,000
    • Major Resistance: $77,000

    Traders should monitor these levels closely for potential entry and exit points.

  • McGregor’s Memecoin Launch Fails: Full Refunds Issued After Missing Target

    McGregor’s Memecoin Launch Fails: Full Refunds Issued After Missing Target

    In a significant development for the celebrity-backed crypto sector, Conor McGregor’s highly anticipated memecoin project has failed to meet its minimum fundraising threshold, resulting in complete refunds to all participants. This news comes just weeks after the initial announcement of McGregor’s entry into the crypto space, highlighting the increasingly unpredictable nature of celebrity-endorsed digital assets.

    Key Takeaways from the Failed Launch

    • All participant bids have been fully refunded
    • Project team maintains transparency throughout the process
    • Future relaunch possibilities remain open

    SPONSORED

    Trade meme coins with leverage in spot margin on Solana

    Trade Now on Defx

    Market Impact and Analysis

    This development comes amid broader market volatility, with meme coins facing particular scrutiny in recent weeks. The project’s failure to launch successfully may signal a shifting sentiment in the celebrity-backed token market, where investors are showing increased caution and demanding stronger fundamentals.

    What’s Next for the Project?

    The team behind the project has emphasized that this setback is not the end, suggesting potential future developments. Their commitment to transparency throughout the refund process has been noted by industry observers as a positive sign for potential future ventures.

    FAQ Section

    Will there be another launch attempt?

    The team has indicated that while this is not the end, specific plans for a relaunch have not been announced.

    How can investors claim their refunds?

    All refunds are being processed automatically to the original contribution addresses.

    What impact does this have on celebrity-backed tokens?

    This event may lead to increased scrutiny of celebrity-endorsed crypto projects and more rigorous due diligence by investors.

    Market Implications

    The failure of this high-profile launch could impact investor confidence in celebrity-backed tokens and may lead to more stringent evaluation criteria for future memecoin projects.

  • Dogecoin Price Plummets 50% on Low Volume: Analyst Predicts 1,500% Rally

    Dogecoin Price Plummets 50% on Low Volume: Analyst Predicts 1,500% Rally

    Dogecoin (DOGE) has experienced a dramatic 50% price decline amid concerning volume metrics, yet one prominent analyst sees potential for a massive rally ahead. Recent market turmoil triggered by Trump’s tariffs has particularly impacted the popular meme coin, though historical patterns suggest a potential reversal.

    Volume Crisis Signals Market Weakness

    The daily trading volume for DOGE has witnessed a staggering 90% decline since November 2024, dropping from $60 billion to below $3 billion by March 2025. April’s volume remains suppressed below $5 billion, suggesting continued bearish pressure could persist without renewed buying interest.

    Liquidation Wave Hits Long Traders

    The recent downturn has triggered over $4 million in liquidations, with long positions accounting for 80% of the losses. This capitulation event coincides with broader crypto market weakness that has erased $160 billion in value.

    SPONSORED

    Trade DOGE with up to 100x leverage on perpetual contracts

    Trade Now on Defx

    Bullish Case: Historical Pattern Suggests Major Rally

    Despite current bearish conditions, crypto analyst Trader Tardigrade has identified striking similarities to DOGE’s 2016 and 2021 cycles. The analyst’s technical analysis points to a potential 1,500% surge, targeting $2.1 based on historical price patterns and market cycles.

    FAQ Section

    Why is Dogecoin volume dropping?

    The volume decline reflects reduced trading activity amid broader market uncertainty and the impact of Trump’s tariff policies on risk assets.

    What could trigger a DOGE price recovery?

    A combination of increased trading volume, positive market sentiment, and potential catalyst events could spark a recovery.

    Is now a good time to buy Dogecoin?

    While historical patterns suggest potential upside, current market conditions and low volume indicate high risk. Investors should conduct thorough research and consider their risk tolerance.

  • XRP Price Alert: 70% of Binance Traders Long as $3.2 Support Tests

    The XRP market is showing a significant divergence between trader sentiment and technical indicators, as 70% of Binance traders maintain bullish positions despite the cryptocurrency’s 30% decline from January highs. This comprehensive analysis examines why this overwhelming bullish bias could signal further downside ahead.

    XRP Price Action and Market Sentiment Analysis

    Recent data reveals a stark contrast in the XRP market, with 70.33% of traders on Binance holding long positions while the asset continues its downward trajectory. This comes as XRP’s price structure shows concerning bearish patterns, suggesting a potential continuation of the current downtrend.

    SPONSORED

    Trade XRP with up to 100x leverage on perpetual contracts

    Trade Now on Defx

    Key Market Metrics

    • Current Long/Short Ratio: 70.33% long vs 29.67% short
    • Open Interest: $3.4 billion maintained over two weeks
    • Price Decline: 30% drop from January 2025 high of $3.2

    Contrarian Indicators and Risk Analysis

    Market history suggests that extreme sentiment readings often precede significant price moves in the opposite direction. With over 70% of traders positioned long, this creates potential for a cascade of liquidations if support levels fail to hold.

    Technical Support Levels to Watch

    Support Level Price Point Significance
    Primary Support $2.05 Previous resistance turned support
    Secondary Support $1.85 200-day moving average
    Critical Support $1.65 Q4 2024 accumulation zone

    Expert Analysis and Price Predictions

    While a Korean crypto analyst has made headlines with an ambitious $10-20 price target, historical data suggests caution. The asset has yet to reclaim its 2018 all-time high of $3.8, making such targets appear increasingly optimistic in the current market context.

    Frequently Asked Questions

    Why are so many traders bullish on XRP despite the price decline?

    Traders appear to be anticipating a bounce from oversold conditions, though this widespread optimism could ironically be a contrary indicator.

    What could trigger an XRP price recovery?

    A recovery could be sparked by broader market sentiment improvement, new institutional adoption, or positive regulatory developments.

    What are the key risk factors for XRP holders?

    Primary risks include potential mass liquidations of long positions, continued market volatility, and regulatory uncertainty.

    Conclusion: While the high percentage of long positions might seem bullish at first glance, historical market behavior suggests caution. Traders should consider position sizing and risk management given the potential for increased volatility ahead.

  • Bitcoin Crashes 8% to $77.3K as Trump Tariffs Rock Crypto Markets

    Bitcoin Crashes 8% to $77.3K as Trump Tariffs Rock Crypto Markets

    Bitcoin and the broader cryptocurrency market faced severe downward pressure today as Trump’s sweeping new tariff announcements sent shockwaves through global financial markets. The leading cryptocurrency plummeted 8% to $77,300, while Ethereum suffered an even steeper 14% decline.

    Market Impact of Trump’s Tariff Announcement

    Billionaire investor and Trump ally Bill Ackman has called for a 90-day pause on the implementation of new US tariffs as markets reel from the announcement. The proposed pause aims to give businesses and markets time to adjust to the dramatic policy shift.

    Key Price Levels to Watch

    Bitcoin’s critical support level at $81,000 was decisively broken during today’s selloff, opening the door for further downside. Technical analysts are now watching the $75,000 level as the next major support zone.

    Broader Market Implications

    The crypto market’s reaction mirrors broader financial market concerns, with liquidations reaching $900 million as traders rush to reduce risk exposure.

    SPONSORED

    Trade Bitcoin with up to 100x leverage and maximize your profit potential

    Trade Now on Defx

    Expert Analysis

    Market analysts suggest this correction could present a buying opportunity for long-term investors, though short-term volatility is expected to persist as markets digest the implications of the new tariff policies.

    FAQ

    How long could this market downturn last?

    Analysts expect volatility to continue until there’s more clarity on the implementation of the new tariffs.

    What are the key support levels to watch?

    After breaking $81,000, the next major support levels are at $75,000 and $72,000.

    How does this compare to previous market corrections?

    This correction is notably different as it’s driven by macro policy changes rather than crypto-specific factors.

  • Solana Price Crashes 15% to $102: Critical $100 Support Under Threat

    Solana Price Crashes 15% to $102: Critical $100 Support Under Threat

    Solana (SOL) has entered a critical phase as the cryptocurrency plummets 15% amid broader market turbulence. The recent price action suggests SOL could be headed for a crucial test of the $100 support level, a breach of which could trigger further downside momentum.

    As highlighted in our recent analysis of SOL’s critical $120 support, the bearish pressure has intensified, pushing the price below multiple key support levels.

    Key Highlights of Solana’s Price Action

    • SOL broke below the crucial $112 support zone against USD
    • Price trading below $105 and the 100-hourly simple moving average
    • Key contracting triangle support at $118 has been breached
    • Immediate danger zone identified at $100 support level

    SPONSORED

    Trade Solana with up to 100x leverage and maximize your profit potential

    Trade Now on Defx

    Technical Analysis Deep Dive

    The current price action shows a decisive bearish trend, with SOL trading well below the 23.6% Fibonacci retracement level from the $121 swing high to the $102 low. This technical formation suggests increased selling pressure could push prices lower.

    Resistance Levels to Watch

    • Primary resistance: $105
    • Secondary resistance: $112 (50% Fibonacci retracement)
    • Major resistance: $116

    Support Structure Analysis

    • Critical support: $100
    • Secondary support: $92
    • Last resort support: $84

    Market Implications and Trading Outlook

    The technical indicators paint a concerning picture for SOL holders:

    • MACD: Gaining bearish momentum
    • RSI: Trading below 50, indicating bearish control
    • Moving Averages: Price below 100-hourly SMA confirms downtrend

    FAQ Section

    What’s causing Solana’s price decline?

    The current decline appears to be part of a broader market correction, with technical indicators suggesting oversold conditions and weakening buyer support.

    Could SOL bounce back from the $100 support?

    While the $100 level represents strong psychological support, a bounce would require significant buying pressure and improved market sentiment.

    What are the key levels traders should monitor?

    The critical zones are $100 for support and $105-$112 for resistance. Breaking below $100 could trigger accelerated selling.

    Conclusion and Action Points

    Solana’s price action requires careful monitoring as it approaches the critical $100 support level. Traders should watch for:

    • Volume patterns at key support levels
    • Potential bounce scenarios above $100
    • Break and retest opportunities at resistance levels
  • Bitcoin Price Crashes 6% to $77.8K as Trump Tariffs Spark Market Panic

    Bitcoin Price Crashes 6% to $77.8K as Trump Tariffs Spark Market Panic

    Bitcoin (BTC) plunged below the critical $78,000 level on Sunday, with the leading cryptocurrency trading at $77,840 – marking a sharp 6% decline as global markets reel from President Trump’s sweeping new tariff announcement. This latest price action comes amid broader market turmoil that has erased over $160 billion in crypto market value during the weekend selloff.

    The flagship cryptocurrency, which maintained prices above $80,000 through most of 2025, has now declined 28% from its January all-time high of $109,000. Trump’s recent trade policies have triggered unprecedented volatility across global financial markets.

    Massive Liquidations Hit Crypto Markets

    The immediate impact of the tariff announcement has been severe, with Bitcoin experiencing over $247 million in long liquidations within just 24 hours. Ethereum wasn’t spared either, facing $217 million in similar liquidations during the same period.

    SPONSORED

    Trade Bitcoin with up to 100x leverage and maximize your profit potential

    Trade Now on Defx

    Global Markets Face Historic Losses

    The ramifications extend far beyond crypto markets. The S&P Global Broad Market Index has recorded staggering losses of $7.46 trillion, while the U.S. stock market alone shed $5.87 trillion. International markets weren’t spared, with global markets experiencing a $1.59 trillion decline.

    What This Means for Crypto Investors

    As market indicators signal potential bearish trends, analysts suggest Bitcoin will likely continue moving in tandem with traditional equities. The cryptocurrency market, initially expected to benefit from favorable regulatory developments this year, now faces significant headwinds from macroeconomic uncertainties.

    Key Support Levels to Watch

    Technical analysts identify several critical support levels:

    • $77,000: Immediate support level
    • $75,500: Secondary support zone
    • $72,000: Major psychological support

    FAQ Section

    Why is Bitcoin falling with stocks?

    Bitcoin has increasingly correlated with traditional risk assets, particularly during periods of macro uncertainty. The current decline reflects broader market concerns about global trade tensions.

    Will Bitcoin recover from this dip?

    Historical patterns suggest Bitcoin typically recovers from macro-driven selloffs, though timing varies. Investors should monitor global trade developments and market sentiment for recovery signals.

    What’s the outlook for Bitcoin in 2025?

    Despite current volatility, many analysts maintain bullish long-term forecasts, with some targeting $150,000-$175,000 by year-end, though near-term uncertainty remains high.

  • XRP Price Crashes 15% Below $2: Key Support Levels for Recovery

    XRP’s price has entered bearish territory, plummeting below the critical $2.00 psychological level in a move that mirrors the broader crypto market downturn. As recent market data shows massive liquidations across the crypto space, XRP traders are closely monitoring key support levels for potential recovery signals.

    XRP Technical Analysis: Breaking Down the Bearish Move

    The latest price action shows XRP breaking several critical support levels:

    • Price dropped decisively below $2.00 and $1.880 support zones
    • Trading activity now concentrated below the 100-hourly Simple Moving Average
    • Critical bullish trend line broken at $2.120 support level
    • Current consolidation phase near $1.797 suggesting potential further downside

    Key Support and Resistance Levels to Watch

    For traders looking to navigate this volatile period, these are the critical price levels to monitor:

    Support Levels Resistance Levels
    $1.80 $1.850
    $1.7650 $1.880
    $1.720 $1.950
    $1.650 $2.00

    SPONSORED

    Trade XRP with up to 100x leverage on perpetual contracts

    Trade Now on Defx

    Technical Indicators Signal Bearish Momentum

    Multiple technical indicators are confirming the bearish outlook:

    • MACD showing increasing bearish momentum
    • RSI trading below 50, indicating bearish control
    • Price action forming lower lows and lower highs

    Recovery Scenarios and Price Targets

    For XRP to initiate a recovery, these key levels must be reclaimed:

    1. Immediate resistance at $1.850 must be broken
    2. $1.880 level represents the first major hurdle
    3. $1.950 zone could trigger a push toward $2.00
    4. Breaking above $2.00 could signal trend reversal

    FAQ: XRP Price Action

    Why is XRP price dropping?

    The current decline aligns with broader market weakness and increased selling pressure across major cryptocurrencies.

    What’s the next major support level?

    The $1.7650 level represents crucial support, with $1.650 serving as the last line of defense.

    When might XRP recover?

    Recovery depends on broader market conditions and ability to reclaim the $1.880 resistance level.

    Traders should maintain strict risk management given the current market volatility and watch for potential continuation of the bearish trend below $1.80.

  • Ethereum Price Crashes 15% to $1,537: Critical $1,500 Support in Focus

    Ethereum Price Crashes 15% to $1,537: Critical $1,500 Support in Focus

    Ethereum (ETH) has experienced a severe price decline, plummeting below multiple support levels as bearish pressure intensifies. The second-largest cryptocurrency by market cap is now testing critical support around $1,500, with technical indicators suggesting further downside potential.

    As broader crypto markets face significant selling pressure, Ethereum’s price action has turned decisively bearish, breaking below several key technical levels.

    Key Technical Levels Under Pressure

    The latest price action shows:

    • Sharp decline below the $1,800 psychological level
    • Breach of critical support at $1,650
    • Trading well below the 100-hour Simple Moving Average
    • Formation of new local low at $1,537

    Technical Analysis Points to Further Weakness

    Multiple technical indicators suggest continued bearish momentum:

    • MACD showing increasing bearish momentum
    • RSI below 50, indicating bearish control
    • Break below bullish trend line at $1,775
    • 23.6% Fibonacci retracement rejection at $1,580

    SPONSORED

    Trade ETH with up to 100x leverage on perpetual contracts

    Trade Now on Defx

    Critical Support and Resistance Levels

    Traders should monitor these key price levels:

    Resistance Levels:

    • $1,600 – Immediate resistance
    • $1,675 – 50% Fibonacci retracement
    • $1,710 – Major resistance zone
    • $1,820 – Previous support turned resistance

    Support Levels:

    • $1,550 – Current support zone
    • $1,535 – Critical support level
    • $1,420 – Next major support
    • $1,400 – Psychological support

    Market Outlook and Trading Scenarios

    Two primary scenarios are emerging:

    Bearish Scenario:

    A break below $1,535 could trigger cascading sells toward $1,420 and potentially $1,400. The absence of strong buying pressure suggests bears remain in control of the market.

    Bullish Scenario:

    Recovery above $1,600 could signal a potential trend reversal, with targets at $1,675 and $1,710. However, significant buying volume would be needed to overcome current bearish momentum.

    FAQ

    What’s causing Ethereum’s price decline?

    The current decline appears linked to broader market weakness and increased selling pressure across major cryptocurrencies.

    Could ETH drop below $1,500?

    Technical indicators suggest further downside is possible if the $1,535 support fails to hold.

    What would signal a potential recovery?

    A decisive break above $1,600 with increasing volume would be the first sign of potential trend reversal.

  • Peter Schiff: Crypto Markets Crack Under Trump Tariff Pressure

    Peter Schiff: Crypto Markets Crack Under Trump Tariff Pressure

    Gold advocate and long-time crypto skeptic Peter Schiff claims the cryptocurrency market is ‘starting to crack’ as global markets reel from Donald Trump’s latest tariff announcements. This follows Jim Cramer’s recent warning of a potential 1987-style market collapse due to Trump’s tariff policies.

    Market Impact and Schiff’s Analysis

    The economist’s comments come as cryptocurrency markets face increased pressure, with Bitcoin recently falling below $80,000 and erasing $160 billion in market value. Schiff particularly criticized President Biden’s proposed Strategic Bitcoin Reserve, comparing it unfavorably to Trump’s controversial tariff policies.

    Global Market Response

    The broader financial markets have shown significant volatility in response to Trump’s proposed tariff increases. Traditional safe-haven assets like gold have seen increased interest, while crypto markets struggle to maintain support levels.

    SPONSORED

    Trade with confidence during market volatility – up to 100x leverage on perpetual contracts

    Trade Now on Defx

    Expert Analysis and Market Outlook

    Market analysts suggest the current situation could lead to increased correlation between crypto and traditional markets, potentially challenging Bitcoin’s narrative as a safe-haven asset. However, some experts predict both Bitcoin and gold could see major gains as markets adjust to the new trade landscape.

    FAQ Section

    How will Trump’s tariffs affect crypto markets?

    The immediate impact has been negative, with increased market correlation leading to downward pressure across crypto assets.

    Is Bitcoin still considered a safe-haven asset?

    The current market reaction has raised questions about Bitcoin’s safe-haven status, though some analysts maintain its long-term potential as a hedge against economic uncertainty.

    What’s the outlook for crypto markets?

    While short-term volatility is expected, many experts believe the fundamental case for cryptocurrency adoption remains strong despite current market conditions.