
Cardano Price Alert: Elliott Wave Points to 50% ADA Crash Before $1.6 Rally
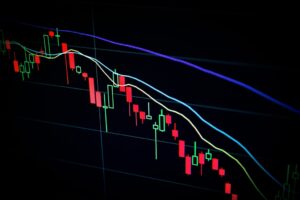
Cardano (ADA) traders are facing a critical juncture as Elliott Wave analysis suggests an imminent 50% price correction before a...
Cardano (ADA) traders are facing a critical juncture as Elliott Wave analysis suggests an imminent 50% price correction before a...
Trump Media & Technology Group (TMTG) is reportedly planning a massive $3 billion investment into Bitcoin and crypto assets, according...

Recent data from CryptoQuant reveals significant profit-taking activity by Bitcoin whales, with new addresses booking $3.21 billion in profits as...
A comprehensive technical analysis from Crypto Insight UK suggests XRP could be on the verge of a dramatic price surge...
Solana (SOL) is showing early signs of potential selling pressure as funding rates turn negative, marking a significant shift in...

Bitcoin's upward momentum continues to strengthen as Michael Saylor's Strategy increases its BTC holdings, while speculation swirls around Trump Media's...
Hyperliquid's native HYPE token has skyrocketed to a new all-time high of $39, marking an impressive 50% surge amid broader...

Trump Media & Technology Group (TMTG) has unveiled an ambitious $3 billion cryptocurrency investment initiative, with Bitcoin (BTC) at its...
Bitcoin (BTC) is positioning itself for a potential surge beyond $112,000 as multiple technical indicators align with strong support levels....
Bitcoin's SLRV (Short-Term to Long-Term Realized Value) Ribbons have turned green, signaling a potential major price move as BTC reclaims...


