Tag: Market Analysis

  • Bitcoin Price Tests $83K Support: Key Levels for April 2025 Breakout

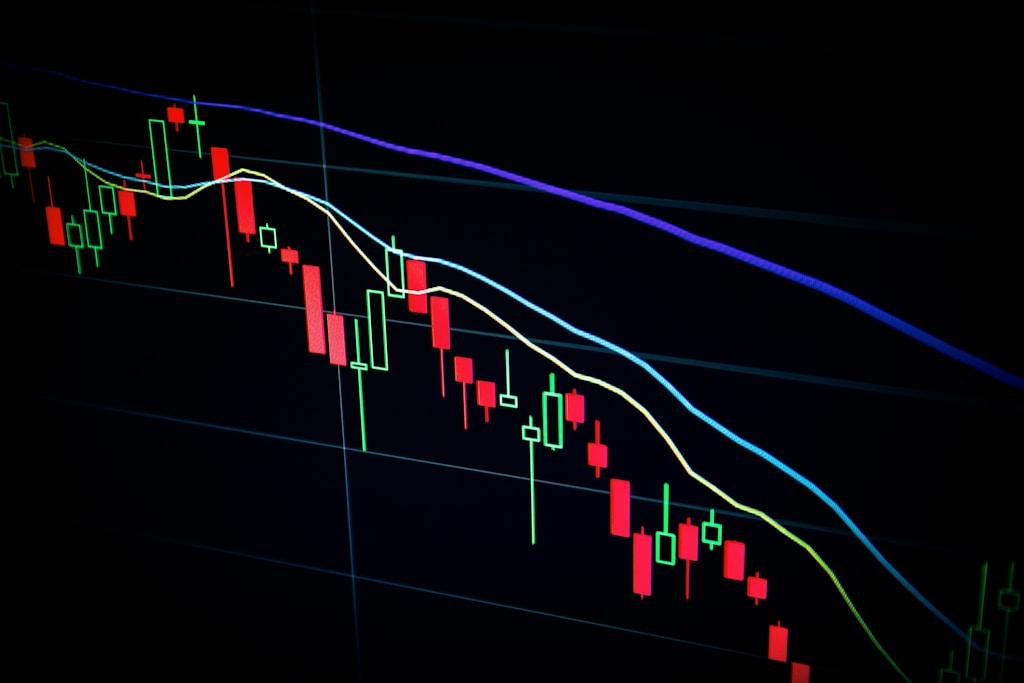
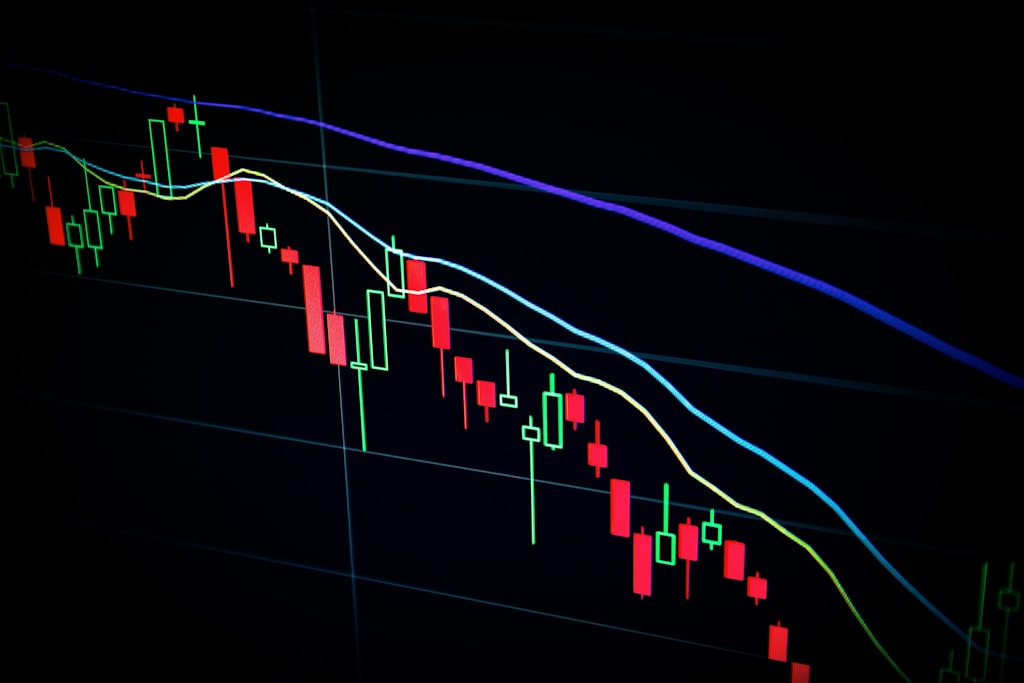
    Bitcoin’s price action continues to face critical resistance as BTC struggles to maintain momentum above the $83,000 level in early April 2025. Recent market data shows increasing bearish pressure, with technical indicators suggesting potential further downside unless bulls can decisively reclaim key resistance levels.

    As noted in recent whale accumulation patterns, institutional interest remains strong despite short-term price weakness, indicating potential support at lower levels.

    Current Price Action and Technical Analysis

    Bitcoin is currently experiencing significant technical hurdles:

    • Price trading below both $83,000 and the 100-hour SMA
    • Formation of a bullish trend line with support at $82,550
    • Critical resistance zone established at $83,850
    • 50% Fibonacci retracement level breach from $81,320 low to $83,870 high

    Key Support and Resistance Levels

    Support Levels Resistance Levels
    $82,550 (Immediate) $83,250 (Immediate)
    $82,250 (Major) $83,850 (Key)
    $81,250 (Secondary) $84,200 (Major)
    $80,000 (Psychological) $85,500 (Ultimate)

    SPONSORED

    Trade Bitcoin with up to 100x leverage on perpetual contracts

    Trade Now on Defx

    Technical Indicators Analysis

    Current technical indicators paint a cautiously bearish picture:

    • MACD: Losing momentum in bearish territory
    • RSI: Trading below the crucial 50 level
    • Moving Averages: Price below 100-hour SMA indicates bearish control

    Potential Scenarios and Trading Implications

    Two primary scenarios are emerging:

    Bullish Case

    • Break above $83,850 could trigger run to $84,200
    • Sustained momentum could push price toward $85,500
    • Key to watch: Volume confirmation on breakouts

    Bearish Case

    • Failure to break $83,850 might trigger decline to $82,250
    • Risk of testing $81,250 support
    • Worst case scenario: Drop to $78,500 support

    Frequently Asked Questions

    What’s causing Bitcoin’s current price resistance?

    Multiple factors including technical resistance at $83,850, declining momentum indicators, and broader market uncertainty are contributing to the current price action.

    Where is the strongest support level for Bitcoin?

    The most significant support cluster exists between $82,250 and $82,550, with additional strong support at $78,500.

    What technical indicators should traders watch?

    Focus on the MACD momentum, RSI levels, and the 100-hour SMA for potential trend confirmation or reversal signals.

    Traders should maintain strict risk management given the current market conditions and watch for clear breakout confirmation before taking positions.

  • Bitcoin Whales Accumulate 46K BTC as Price Tests $83K Support

    Bitcoin’s price continues to show weakness, dropping 22.3% in the past month to $83,191 as market uncertainty persists. However, on-chain data reveals a fascinating divergence between large and small holders that could signal a major trend shift ahead.

    Whale Accumulation Mirrors 2020 Bull Run Pattern

    Recent analysis from CryptoQuant shows Bitcoin whale addresses holding 1,000-10,000 BTC are actively accumulating during this dip, mirroring behavior seen during the 2020 bull market. This accumulation pattern, which comes as major entities strengthen their grip on BTC supply, historically preceded significant price rallies.

    According to CryptoQuant analyst Mignolet, these whale entities demonstrated similar accumulation patterns three times during the 2020 cycle, each preceding major upward moves. The current accumulation phase suggests these market leaders remain confident in Bitcoin’s long-term prospects despite short-term pressure.

    SPONSORED

    Trade Bitcoin with up to 100x leverage on perpetual contracts

    Trade Now on Defx

    Short-Term Holders Show Signs of Capitulation

    While whales accumulate, short-term holders (STHs) are showing clear signs of distress. The Short-Term Holder SOPR has remained below 1.0 for over two months, currently at 0.98, indicating consistent selling at a loss. This metric historically signals capitulation phases that often precede market bottoms.

    On-chain data reveals approximately 46,000 BTC have been sent to exchanges at a loss in recent weeks, highlighting the growing pressure on smaller investors. This capitulation by short-term holders, combined with significant exchange outflows, creates an intriguing market dynamic.

    Market Implications and Technical Outlook

    The contrast between whale accumulation and retail capitulation often marks key market transition points. Historical data suggests periods of heavy STH capitulation, combined with whale accumulation, frequently precede substantial rallies as weak hands are replaced by stronger, long-term focused investors.

    Frequently Asked Questions

    What defines a Bitcoin whale?

    In this context, Bitcoin whales are defined as addresses holding between 1,000 and 10,000 BTC, equivalent to roughly $83-830 million at current prices.

    Why is the SOPR metric important?

    The Spent Output Profit Ratio (SOPR) helps identify whether holders are selling at a profit or loss, with values below 1.0 indicating selling at a loss – often a sign of market capitulation.

    What typically happens after periods of whale accumulation?

    Historically, sustained periods of whale accumulation during market uncertainty have preceded significant price appreciation phases, though past performance doesn’t guarantee future results.

  • Dogecoin Price Crashes 46% in Q1 2025: Historical Bear Pattern Returns

    Dogecoin Price Crashes 46% in Q1 2025: Historical Bear Pattern Returns

    Dogecoin (DOGE) has recorded its most bearish first quarter in seven years, plummeting 46% and potentially signaling a repeat of the devastating 2018 crypto winter pattern. This dramatic decline comes amid broader market uncertainty and shifting sentiment in the meme coin sector.

    Q1 2025 Performance Analysis: A Historical Perspective

    According to CryptoRank data, DOGE’s 46% quarterly loss marks a significant reversal from its previous performance. This decline represents the first Q1 loss for the popular meme coin in three years, contrasting sharply with gains of 10% in 2023 and an impressive 147% surge in 2024. Recent confusion around Dogecoin’s relationship with various initiatives may have contributed to the bearish sentiment.

    SPONSORED

    Trade meme coins with up to 100x leverage and maximize your potential returns

    Trade Now on Defx

    Monthly Breakdown of DOGE’s Q1 Performance

    • January 2025: Modest 4% gain
    • February 2025: Sharp 38.5% decline
    • March 2025: Additional 17.5% loss

    2018 Pattern Comparison: What to Expect

    The current market conditions bear striking similarities to 2018, when DOGE experienced its worst Q1 performance with a 68.8% loss. If this historical pattern repeats:

    Quarter 2018 Performance 2025 Projection
    Q1 -68.8% -46% (Actual)
    Q2 -11.5% Potential Decline
    Q3 +138% Possible Recovery

    Technical Analysis and Expert Insights

    Crypto analyst Ali Martinez identifies a critical support level at the lower boundary of an ascending channel. The analysis suggests potential targets:

    • Mid-range target: $4.00
    • Upper range target: $7.00+
    • Current support level: $0.165

    Frequently Asked Questions

    Will Dogecoin recover in 2025?

    Historical patterns suggest a potential Q3 recovery, similar to the 138% gain seen in 2018’s third quarter.

    What caused Dogecoin’s Q1 crash?

    Multiple factors contributed, including broader market uncertainty, shifting meme coin sentiment, and specific DOGE-related developments.

    Is this the bottom for DOGE?

    Technical analysts, including Trader Tardigrade, suggest the current level could represent a bottom, particularly given similarities to September 2024 patterns.

    At press time, DOGE trades at $0.165, representing a 3% decline in the last 24 hours. Investors should monitor key support levels and potential catalyst events that could influence price action in the coming quarters.

  • Bitcoin Warning: NVT Ratio Signals 82K Price Could Be Mirage

    Bitcoin’s recent price action near $90,000 appears to be losing steam, with concerning signals emerging from key on-chain metrics. The leading cryptocurrency has declined 6.4% over the past week to $82,000, prompting analysts to question whether the rally was built on solid fundamentals.

    This analysis comes as significant exchange outflows of 30,000 BTC have failed to prevent downward pressure, suggesting a potential disconnect between whale accumulation and price action.

    NVT Ratio Raises Red Flags

    CryptoQuant analyst BorisVest’s examination of the Network Value to Transactions (NVT) ratio reveals troubling divergences between Bitcoin’s market capitalization and actual network usage. The elevated NVT Golden Cross reading indicates price inflation may be driven more by speculation than organic demand.

    SPONSORED

    Trade Bitcoin with up to 100x leverage on perpetual contracts

    Trade Now on Defx

    Funding Rates Signal Bearish Sentiment

    Adding to concerns, funding rates have entered a “dead cross” pattern, with short-term rates falling below long-term averages. This technical formation historically precedes significant price corrections and suggests traders are increasingly risk-averse.

    The cautious outlook aligns with recent hedge fund predictions of a potential 40% drop, though such extreme scenarios remain speculative.

    What This Means for Traders

    Market participants should monitor several key metrics:

    • Daily transaction volumes
    • NVT ratio movements
    • Funding rate trends
    • Exchange flow dynamics

    FAQ Section

    What is the NVT Ratio?

    The Network Value to Transactions ratio measures Bitcoin’s market cap relative to its daily transaction volume, helping identify potential price bubbles.

    Why are funding rates important?

    Funding rates indicate market sentiment in perpetual futures markets, with negative rates suggesting bearish positioning.

    What could trigger a recovery?

    Increased transaction volumes, positive funding rates, and renewed institutional interest could support price recovery.

    As the market digests these signals, traders should maintain strict risk management and watch for potential consolidation or further downside in the coming weeks.

  • Financial Crisis Warning: Peter Schiff Predicts 2008-Level Crash

    Financial Crisis Warning: Peter Schiff Predicts 2008-Level Crash

    Key Takeaways:

    • Peter Schiff warns of an impending financial crisis potentially worse than 2008
    • Combination of tariffs, inflation, and Fed policy creating perfect storm
    • Dollar weakness signals potential systemic risks

    Renowned economist and gold advocate Peter Schiff has issued a stark warning about an impending financial crisis that could eclipse the 2008 market collapse. His analysis comes amid growing concerns about the convergence of multiple economic pressure points, including rising tariffs, persistent inflation, and controversial Federal Reserve policies.

    This warning aligns with recent market developments, including Bitcoin’s recent price decline below $82K due to tariff concerns, suggesting broader market anxiety about economic stability.

    Understanding the Crisis Catalysts

    Several key factors are contributing to this potential crisis:

    • Escalating tariffs impacting global trade
    • Persistent inflation despite Fed intervention
    • Rising interest rates straining market liquidity
    • Weakening dollar threatening global reserve status

    The situation has particular implications for the cryptocurrency market, as BlackRock’s CEO recently warned about Bitcoin’s threat to USD reserve status, adding another layer of complexity to the economic landscape.

    SPONSORED

    Protect your assets with up to 100x leverage on perpetual contracts

    Trade Now on Defx

    Expert Analysis and Market Impact

    Schiff’s warning carries particular weight given his track record of predicting the 2008 financial crisis. His current analysis suggests that the combination of factors at play could create a more severe economic downturn than previously experienced.

    FAQ Section

    • Q: How does this compare to the 2008 crisis?
      A: Schiff argues current conditions, including inflation and monetary policy issues, could lead to more severe consequences than 2008.
    • Q: What are the key warning signs?
      A: Rising tariffs, persistent inflation, and Federal Reserve policy conflicts are primary indicators.
    • Q: How might this affect cryptocurrency markets?
      A: Historical patterns suggest crypto markets could see increased volatility during traditional market instability.

    Time to Read: 5 minutes

  • Coinbase Stock Plunges 30% in Q1 2025, Matching FTX Crisis Lows

    Coinbase (COIN), America’s leading cryptocurrency exchange, has experienced a dramatic 30% stock decline in Q1 2025, echoing the turbulent period following the FTX collapse in 2022. This significant downturn comes amid growing macroeconomic concerns and broader crypto market volatility.

    Market Impact and Contributing Factors

    The steep decline in Coinbase’s stock value reflects widespread uncertainty in both traditional and crypto markets. Recent concerns over Trump’s trade policies have particularly impacted the crypto sector, with Bitcoin retreating from its recent all-time high of $109,000 to current levels around $83,000.

    Other major crypto-linked stocks have faced similar pressures:

    • Galaxy Digital Holdings (GLXY.TO)
    • Riot Platforms (RIOT)
    • Core Scientific (CORZ)

    SPONSORED

    Trade crypto with up to 100x leverage on perpetual contracts

    Trade Now on Defx

    Expert Analysis and Market Outlook

    Oppenheimer analyst Owen Lau emphasizes that current market conditions are primarily driven by macroeconomic factors rather than crypto fundamentals. The looming recession threat has made crypto-linked stocks even more volatile than Bitcoin itself, with Coinbase facing additional risks due to its corporate structure.

    While some crypto companies like Strategy have maintained positive momentum, Coinbase’s performance highlights the growing disparity between different segments of the crypto industry.

    Frequently Asked Questions

    Why is Coinbase stock falling more than Bitcoin?

    Coinbase stock faces additional pressures from operational costs, regulatory concerns, and corporate risk factors that don’t directly affect Bitcoin.

    How does this compare to the FTX collapse period?

    The current 30% decline matches the magnitude of losses seen during the FTX crisis, though the underlying causes are different.

    What could trigger a recovery?

    Market analysts suggest that positive regulatory developments, improved macroeconomic conditions, or strong quarterly earnings could help reverse the trend.

    Despite these challenges, the cryptocurrency industry continues to gain institutional acceptance and regulatory clarity. However, as Connor Loewen from 3iQ notes, new catalysts may be needed to drive the next phase of market growth.

  • OpenAI’s $40B SoftBank Deal Pushes Valuation to $300B Milestone

    OpenAI’s $40B SoftBank Deal Pushes Valuation to $300B Milestone

    Key Takeaways:

    • OpenAI secures $40 billion funding round led by SoftBank
    • Company valuation reaches $300 billion milestone
    • ChatGPT adds 2 million new users in just 5 days

    In a landmark development for the artificial intelligence sector, OpenAI has secured a massive $40 billion funding round led by Japanese investment giant SoftBank, catapulting the company’s valuation to an unprecedented $300 billion. This funding round marks a significant milestone in OpenAI’s journey and reinforces its position as a leading force in the AI industry.

    The investment comes as OpenAI’s flagship product, ChatGPT, continues to demonstrate remarkable growth, adding two million new users in just five days. This rapid user acquisition highlights the increasing mainstream adoption of AI technology and its potential impact on various sectors, including the crypto and blockchain space.

    As noted in our recent coverage, several blockchain platforms are pivoting towards AI integration, signaling a growing convergence between AI and crypto technologies.

    SPONSORED

    Trade with confidence using advanced AI-powered analytics

    Trade Now on Defx

    Market Impact and Industry Implications

    The substantial funding round and soaring valuation demonstrate the growing investor confidence in AI technology and its potential to revolutionize various industries. SoftBank’s leading role in this investment round adds significant credibility to OpenAI’s long-term vision and technological capabilities.

    Expert Analysis

    Industry analysts suggest that this funding round could accelerate OpenAI’s research and development efforts, potentially leading to more advanced AI models that could benefit various sectors, including blockchain and cryptocurrency markets.

    FAQ Section

    • Q: How will this funding impact OpenAI’s development timeline?
      A: The investment is expected to accelerate OpenAI’s R&D efforts and product development.
    • Q: What does this mean for AI integration in crypto?
      A: This funding could lead to more advanced AI applications in crypto trading, security, and blockchain development.
    • Q: How does OpenAI’s valuation compare to major tech companies?
      A: At $300 billion, OpenAI now ranks among the world’s most valuable technology companies.

    This development comes at a time when AI-powered financial products are gaining traction in the crypto space, suggesting a broader trend of AI integration across the digital asset ecosystem.

  • Bitcoin Price Risk: Goldman Sachs Warns of 35% Recession Chance

    Goldman Sachs has raised alarm bells in the crypto market by increasing its 12-month US recession probability to 35%, sending Bitcoin and other digital assets lower on Monday. This stark assessment comes amid mounting concerns over tariffs, weakening economic growth, and deteriorating market sentiment.

    As covered in our recent analysis of Bitcoin’s price reaction to Trump tariff concerns, the cryptocurrency market continues to show increased sensitivity to macroeconomic factors.

    Goldman’s Recession Warning: Key Points

    • 35% probability of US recession within 12 months
    • 2025 GDP growth forecast cut to 1.0% (down 0.5%)
    • Core PCE inflation projection raised to 3.5%
    • Unemployment forecast increased to 4.5%

    SPONSORED

    Navigate market uncertainty with up to 100x leverage on perpetual contracts

    Trade Now on Defx

    Impact on Crypto Markets

    Bitcoin’s price dipped to $83,230 following the news, reflecting the asset’s growing correlation with traditional market risk factors. However, industry experts remain divided on the long-term implications for crypto assets during a recession.

    Expert Analysis: Mixed Outlook

    BlackRock’s Global Head of Digital Assets, Robbie Mitchnick, suggests that a recession could actually benefit Bitcoin through increased fiscal spending and monetary stimulus. This aligns with BlackRock’s broader perspective on Bitcoin’s role in the global financial system.

    FAQ Section

    How does a recession affect Bitcoin price?

    Short-term: Potential downward pressure due to risk-off sentiment
    Long-term: Could benefit from stimulus measures and monetary policy response

    What are the key recession indicators to watch?

    – Yield curve inversion
    – GDP growth rates
    – Unemployment figures
    – Consumer confidence metrics

    Market Outlook

    While immediate market reaction has been cautious, institutional interest remains strong, as evidenced by recent developments. Traders should monitor both traditional economic indicators and crypto-specific metrics for potential market direction.

  • Bitcoin Rally Predicted by Truflation Data: Key Inflation Signals

    Bitcoin Rally Predicted by Truflation Data: Key Inflation Signals

    Truflation’s real-time inflation data analysis has revealed a compelling correlation with Bitcoin price movements, suggesting an imminent rally for the leading cryptocurrency. This comprehensive analysis examines how inflation trends could impact Bitcoin’s trajectory in the coming weeks.

    Key Points:

    • Truflation’s data shows strong correlation between inflation pauses and Bitcoin rallies
    • Bitcoin classified as a risk asset with unique inflation-hedge properties
    • Historical pattern suggests potential price surge during stable inflation periods

    As Bitcoin’s price continues to show significant volatility, Truflation’s analysis provides a fresh perspective on potential price catalysts. The real-time inflation data provider has identified a consistent pattern: Bitcoin tends to rally when disinflation trends temporarily stabilize or reverse.

    Understanding the Inflation-Bitcoin Connection

    Truflation’s methodology differs from traditional inflation metrics by providing real-time data analysis. Their research indicates that Bitcoin’s price movements have shown remarkable sensitivity to inflation trend changes, particularly during periods of relative stability.

    SPONSORED

    Trade Bitcoin with up to 100x leverage on perpetual contracts

    Trade Now on Defx

    Market Implications

    This correlation becomes particularly significant as institutional buyers continue to show strength in the market. The combination of stable inflation periods and institutional interest could create optimal conditions for Bitcoin’s next major price movement.

    FAQ Section

    How does inflation affect Bitcoin prices?

    Inflation typically influences Bitcoin prices through its impact on monetary policy and investor risk appetite. During periods of stable inflation, investors often show increased interest in risk assets like Bitcoin.

    What makes Truflation’s data different from traditional metrics?

    Truflation utilizes real-time data sources and blockchain technology to provide more immediate and accurate inflation insights compared to traditional monthly reports.

    How reliable are these correlation patterns?

    While historical correlations show consistent patterns, market participants should consider multiple factors when making investment decisions.

    Expert Analysis

    Market analysts suggest that this inflation-based indicator could complement traditional technical analysis tools, providing a more comprehensive view of potential market movements.

  • PEPE Price Crashes 5% as Whale Dumps $1.14M Worth of Tokens

    A major PEPE whale has triggered significant market volatility after offloading 150 billion tokens worth $1.14 million on Binance, causing the meme coin’s price to plummet by over 5%. This latest sell-off comes amid broader market uncertainty, as Bitcoin also faces pressure dropping below $82K due to mounting Trump tariff concerns.

    Early Investor’s Massive ROI Highlights PEPE’s Volatile Journey

    The selling whale, identified as an early PEPE investor, originally purchased 1.5 trillion tokens for just $2,184. At the peak of PEPE’s price surge, this position was worth an astronomical $43 million, representing one of the most profitable meme coin investments of 2025.

    After this latest sale of 150 billion tokens, the investor has now cashed out a total of 1.02 trillion PEPE for $6.66 million, while retaining 493 billion tokens currently valued at $3.64 million. The total profit stands at an impressive $10.3 million – a 4,718x return on investment.

    SPONSORED

    Trade meme coins like PEPE with up to 100x leverage on perpetual contracts

    Trade Now on Defx

    Technical Analysis Points to Further Downside

    PEPE’s price has declined to $0.00006976, with technical indicators suggesting more pain ahead:

    • MACD showing strong bearish divergence
    • RSI at oversold levels of 24.55
    • Support level at $0.0000075 under threat
    • Potential 20% drop to $0.00000585 if support breaks

    Market Impact and Trading Activity

    Despite the price decline, trading volume has increased by 3.90% to $421.28 million, indicating active market participation. This surge in volume, coupled with the oversold RSI, suggests potential accumulation at lower levels by smaller investors.

    FAQ

    Why did the PEPE whale sell their position?

    While the exact reason remains unclear, profit-taking after a 4,718x return appears to be the primary motivation, especially given current market uncertainty.

    What’s the outlook for PEPE price?

    Technical indicators suggest continued downward pressure, with analysts projecting a possible 20% decline if the $0.0000075 support level fails to hold.

    How does this affect the broader meme coin market?

    The sell-off has contributed to negative sentiment in the meme coin sector, with Dogecoin also experiencing recent price weakness.