Tag: Market Analysis

  • Bitcoin Price Faces $751M Outflow Crisis: Institutional Exodus Intensifies

    Bitcoin Price Faces $751M Outflow Crisis: Institutional Exodus Intensifies

    Bitcoin’s market stability is being tested as institutional investors withdraw a staggering $751 million from digital asset funds, marking one of the largest single-week outflows of 2025. This massive exodus comes amid growing concerns about market sentiment and macroeconomic pressures.

    Unprecedented Institutional Outflows Signal Market Shift

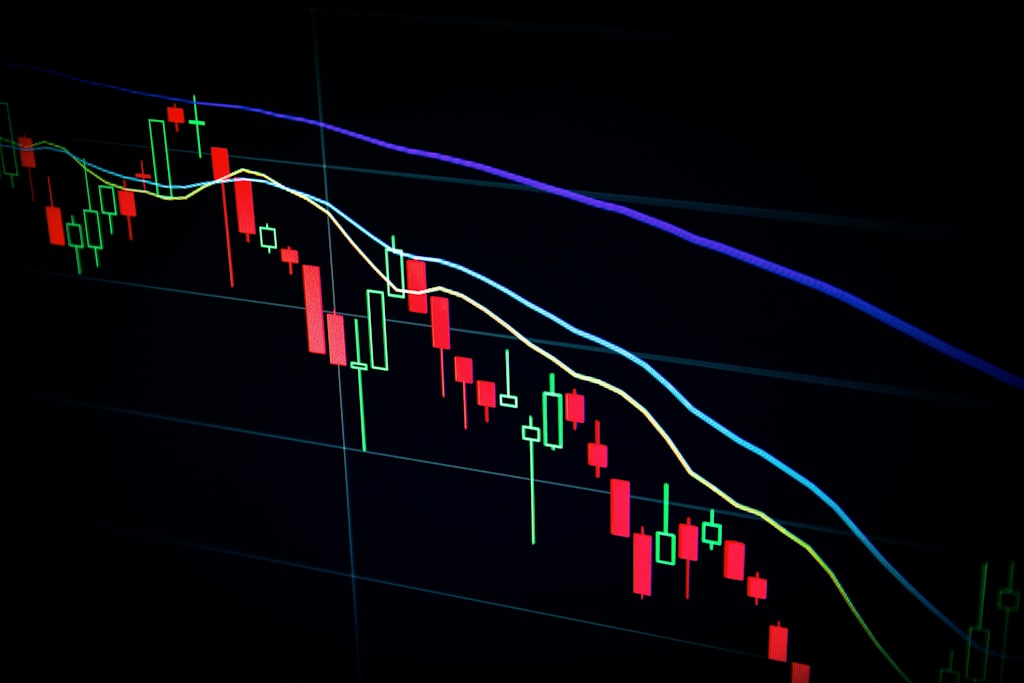
    According to CoinShares’ latest Digital Asset Fund Flows report, the crypto market witnessed a total outflow of $795 million, with Bitcoin accounting for $751 million of the withdrawal. This development coincides with Bitcoin’s recent price decline below $84,000, suggesting a broader shift in market dynamics.

    SPONSORED

    Trade Bitcoin with up to 100x leverage and maximize your profit potential

    Trade Now on Defx

    Key Market Statistics:

    • Total market outflows: $795 million
    • Bitcoin-specific outflows: $751 million
    • Year-to-date net inflows: $165 million
    • Cumulative outflows since February: $7.2 billion

    Impact on Other Cryptocurrencies

    The bearish sentiment has spread beyond Bitcoin, affecting multiple digital assets:

    • Ethereum: $37 million in outflows
    • Solana: $5.1 million in outflows
    • Aave: $0.78 million in outflows
    • SUI: $0.58 million in outflows

    Political Factors and Market Recovery

    The market turbulence appears closely tied to recent political developments, particularly Trump’s tariff policies affecting global trade relations. However, a late-week policy reversal has provided some relief, boosting total Assets Under Management from $120 billion to $130 billion.

    FAQ Section

    Why are institutions withdrawing from Bitcoin?

    Institutions are responding to a combination of factors including political uncertainty, tariff concerns, and potential profit-taking after recent market gains.

    Will Bitcoin recover from these outflows?

    Historical patterns suggest market resilience, but recovery timing depends on institutional sentiment and macroeconomic conditions stabilizing.

    How does this compare to previous outflows?

    This represents one of the largest single-week outflows in 2025, significantly impacting year-to-date inflow figures.

    As the market digests these significant outflows, investors should monitor institutional behavior and political developments for signs of stabilization. The coming weeks will be crucial in determining whether this represents a temporary setback or a more sustained shift in market sentiment.

  • Cardano (ADA) Price Setup Signals 15% Rally Potential, Key Levels Revealed

    Cardano (ADA) is showing strong technical signals that point to a potential 15% upside move, as multiple chart indicators align in a bullish formation. Recent developments in Cardano’s DeFi capabilities combined with the current technical setup create a compelling case for ADA’s next major move.

    Technical Analysis Reveals Bullish Pattern Formation

    According to respected crypto analyst Thomas Anderson, ADA is currently consolidating within a descending triangle pattern on the 1-hour timeframe. The price is testing critical support at $0.6292, which has proven resilient in recent trading sessions. This technical formation, combined with increasing buying pressure, suggests that bulls are preparing for a potential breakout.

    SPONSORED

    Trade ADA with up to 100x leverage on perpetual contracts

    Trade Now on Defx

    Key Price Levels to Watch

    The technical analysis highlights several crucial price levels:

    • Current Support: $0.6292
    • Major Resistance: $0.6974
    • Secondary Support: $0.60
    • Critical Support: $0.58

    Moving Average Analysis

    The 200-period moving average remains a significant technical barrier, with ADA currently trading below this key indicator. However, the formation of higher lows on the 4-hour chart suggests growing bullish momentum, despite the current resistance at $0.6974.

    Volume Analysis and Market Sentiment

    Trading volume patterns indicate accumulation at current levels, with the potential for increased buying pressure if key resistance levels are breached. A successful break above $0.6974 could trigger a cascade of buy orders, potentially pushing ADA toward higher price targets.

    Risk Factors and Alternative Scenarios

    Traders should remain cautious of potential downside risks. A failure to hold support at $0.6292 could trigger a correction toward $0.60 or even $0.58. These levels will be crucial for maintaining the broader uptrend structure.

    Frequently Asked Questions

    What is the key resistance level for Cardano?

    The primary resistance level is at $0.6974, which needs to be broken for confirmation of the bullish scenario.

    What technical patterns support the bullish case?

    The descending triangle pattern, higher lows formation, and increasing buying pressure at support levels all suggest potential upside movement.

    What are the main risk factors?

    The main risks include a potential break below $0.6292 support and continued resistance at the 200-period moving average.

  • Stablecoin Market to Hit $2T by 2028: Standard Chartered Report

    Stablecoin Market to Hit $2T by 2028: Standard Chartered Report

    Key Takeaways:

    • Standard Chartered predicts 10x growth in stablecoin market cap by 2028
    • GENIUS Act passage could accelerate stablecoin adoption
    • Current market cap expected to expand from $200B to $2T

    Standard Chartered, the London-based banking giant, has released a groundbreaking report projecting massive growth in the stablecoin market over the next four years. The analysis suggests the total stablecoin market capitalization could surge to $2 trillion by 2028, representing a nearly ten-fold increase from current levels.

    This forecast comes as JPMorgan’s recent expansion of its Kinexys network signals growing institutional interest in the stablecoin sector.

    GENIUS Act: Catalyst for Stablecoin Growth

    The bank’s bullish prediction hinges significantly on the potential passage of the Guiding and Establishing National Innovation for U.S. Stablecoins (GENIUS) Act later this year. This regulatory framework could provide much-needed clarity and legitimacy to the stablecoin sector.

    SPONSORED

    Trade stablecoins with up to 100x leverage on perpetual contracts

    Trade Now on Defx

    Market Impact and Growth Drivers

    Several key factors are expected to drive this explosive growth:

    • Increased institutional adoption
    • Cross-border payment efficiency
    • DeFi integration
    • Regulatory clarity
    • Traditional finance partnerships

    Frequently Asked Questions

    What is the current stablecoin market cap?

    The current stablecoin market capitalization stands at approximately $200 billion.

    How will the GENIUS Act affect stablecoin growth?

    The GENIUS Act is expected to provide regulatory clarity and boost institutional confidence in stablecoins.

    Which stablecoins are likely to benefit most?

    USD-backed stablecoins from regulated institutions are positioned to capture the largest market share.

    Expert Analysis and Market Implications

    This projection from Standard Chartered represents one of the most ambitious forecasts for the stablecoin sector to date. The bank’s analysis suggests that improved regulatory frameworks and institutional adoption will be key drivers of growth.

    Conclusion

    Standard Chartered’s $2 trillion prediction underscores the growing importance of stablecoins in the global financial ecosystem. As regulatory frameworks evolve and institutional adoption increases, the stablecoin market appears poised for significant expansion through 2028.

  • Bitcoin Price Drops Below $84K as Market Sentiment Shifts Bearish

    Bitcoin Price Drops Below $84K as Market Sentiment Shifts Bearish

    Key Takeaways:

    • Bitcoin price declined 0.8% from $86,450 to $83,904
    • Market pullback aligns with broader Wall Street retreat
    • Tariff concerns weigh on both crypto and traditional markets

    Bitcoin’s price trajectory took a bearish turn on Tuesday afternoon, as the leading cryptocurrency slipped below the crucial $84,000 level amid growing market uncertainty. This price action follows recent optimism that saw Bitcoin testing the $90,000 resistance level.

    The 0.8% decline from $86,450 to $83,904 coincides with broader market caution, particularly as ongoing discussions about tariffs impact both traditional and crypto markets.

    Market Analysis: Understanding the Current Pullback

    Several key factors are contributing to the current market dynamics:

    • Increased correlation with traditional equities
    • Growing concerns over trade policies
    • Technical resistance at the $86,000 level
    • Profit-taking after recent rallies

    Technical Outlook

    The current price action suggests a potential consolidation phase, with key support levels to watch:

    • Strong support: $82,500
    • Secondary support: $80,000
    • Resistance level: $86,450

    SPONSORED

    Trade Bitcoin with up to 100x leverage and maximize your profit potential

    Trade Now on Defx

    FAQs

    Q: What caused Bitcoin’s price drop?
    A: The decline appears to be driven by broader market uncertainty, particularly related to tariff concerns and correlation with traditional markets.

    Q: Is this pullback part of a larger trend?
    A: While the immediate price action is bearish, longer-term indicators still suggest an overall bullish market structure.

    Q: What are the key levels to watch?
    A: Traders should monitor the $82,500 support level and $86,450 resistance for potential trend confirmation.

  • Ethereum Price Hits Critical $1,546 Support: Bulls Eye $1,875 Target

    Ethereum Price Hits Critical $1,546 Support: Bulls Eye $1,875 Target

    Ethereum (ETH) is testing a crucial support level at $1,546 as bulls attempt to defend the $1,600 psychological threshold amid heightened market volatility. The second-largest cryptocurrency has shown resilience despite macroeconomic headwinds, with on-chain metrics revealing a potential springboard for recovery.

    Key Support Level Could Trigger ETH Recovery

    According to Glassnode data, Ethereum’s most critical support sits at $1,546.55 – a level where whales have accumulated over 822,440 ETH. This substantial buying zone could serve as a foundation for a potential bounce, especially given that recent policy shifts around US tariffs have injected fresh optimism into crypto markets.

    SPONSORED

    Trade ETH with up to 100x leverage and maximize your profit potential

    Trade Now on Defx

    Technical Analysis Points to $1,875 Target

    ETH has surged over 20% from recent lows, currently trading at $1,630. For a confirmed bullish reversal, prices must reclaim the critical $1,875 resistance – a zone aligning with both the 4-hour 200-day moving average and EMA. This level’s importance is amplified as it coincides with previous support-turned-resistance levels.

    On-Chain Metrics Show Accumulation

    Whale activity suggests strong hands are accumulating ETH at current levels. The recent accumulation of 822,440 ETH at the $1,546 support zone indicates institutional confidence in Ethereum’s long-term prospects. This pattern often precedes significant price movements, as seen in previous market cycles.

    Market Outlook and Key Levels to Watch

    Bulls must defend the $1,600 psychological level while pushing toward $1,875 for a confirmed trend reversal. Failure to hold current support could trigger a retest of the $1,500 zone. The next 48-72 hours will be crucial for determining Ethereum’s short-term trajectory.

    Frequently Asked Questions

    Q: What is the key support level for Ethereum?
    A: The critical support level sits at $1,546.55, where whales have accumulated over 822,440 ETH.

    Q: What price must ETH reach for a bullish reversal?
    A: ETH needs to break above $1,875 to confirm a bullish reversal, as this level aligns with key technical indicators.

    Q: How much has ETH recovered from recent lows?
    A: Ethereum has gained over 20% since hitting lows near $1,380 last Wednesday.

  • Bitcoin Corporate Holdings Surge 16% in Q1 2025: 12 New Firms Join Rally

    Public companies have dramatically increased their Bitcoin exposure in Q1 2025, with corporate holdings surging 16% to reach a record 688,000 BTC ($56.7 billion). This significant uptick in institutional adoption comes as companies discover innovative ways to transform idle Bitcoin into strategic capital.

    Q1 2025 Corporate Bitcoin Adoption Highlights

    • Total corporate Bitcoin holdings: 688,000 BTC ($56.7 billion)
    • Quarter-over-quarter increase: 16%
    • New Bitcoin-holding companies: 12
    • Total public companies holding BTC: 79

    New Corporate Bitcoin Buyers Analysis

    The first quarter saw remarkable diversification in corporate Bitcoin adoption, with 12 new companies entering the market. Notable acquisitions include:

    Company BTC Purchased Purchase Timeline
    Ming Shing (Lead Benefit) 833 BTC January-February 2025
    Rumble 188 BTC March 2025
    HK Asia Holdings 1 BTC February 2025

    SPONSORED

    Trade Bitcoin with up to 100x leverage and maximize your profit potential

    Trade Now on Defx

    Japanese Investment Giant Expands Holdings

    Metaplanet’s strategic acquisition of 319 BTC at $82,770 per coin positions them as the 10th largest public company Bitcoin holder globally. Their total holdings now stand at 4,525 BTC, valued at approximately $383.2 million.

    Market Impact and Price Analysis

    Bitcoin’s price has shown resilience, trading at $85,787 as of April 15, representing a 2.5% gain since Q1’s end. The recent price action suggests strong institutional support, even after a brief correction below $75,000 triggered by new US tariff announcements.

    FAQ: Corporate Bitcoin Holdings

    Why are companies buying Bitcoin in 2025?

    Companies are increasingly viewing Bitcoin as a treasury diversification tool and hedge against inflation. The success of early corporate adopters has created a compelling case for Bitcoin as a strategic asset.

    How does corporate adoption affect Bitcoin’s price?

    Corporate buying typically reduces available supply and can create sustained upward pressure on price, especially when multiple firms compete for large acquisitions.

    What’s the outlook for corporate Bitcoin adoption?

    With 79 public companies now holding Bitcoin and growing institutional acceptance, analysts expect the trend to accelerate throughout 2025.

    Featured Image: Shutterstock

  • Bitcoin Price Target $144K as Global M2 Money Supply Hits ATH

    Bitcoin Price Target $144K as Global M2 Money Supply Hits ATH

    Bitcoin’s trajectory towards new all-time highs above $100,000 appears increasingly likely as the Global M2 money supply metric flashes strongly bullish signals. Crypto analyst Colin’s latest analysis suggests BTC could reach as high as $144,000 in the coming months, backed by compelling macro indicators.

    This bullish outlook aligns with recent institutional developments, as highlighted in recent news of major Bitcoin acquisitions by institutional players, demonstrating growing confidence in BTC as a monetary asset.

    Global M2 Money Supply Analysis Points to Bitcoin Breakout

    According to Colin’s detailed analysis shared on X (formerly Twitter), the Global M2 money supply metric has maintained all-time high levels for three consecutive days. This sustained elevation represents a “fantastic sign” for Bitcoin and other risk assets, though the analyst cautions that actual liquidity flows into BTC may take several weeks to materialize.

    SPONSORED

    Trade Bitcoin with up to 100x leverage on perpetual contracts

    Trade Now on Defx

    Key Technical Levels and Timeline

    The analysis projects a potential “slow bleed” until mid-April, specifically around April 16-17, creating what could be the last major dip buying opportunity before a significant price surge. Technical indicators suggest the real breakout movement may not initiate until May 2025.

    Understanding Global M2’s Impact on Bitcoin

    Colin emphasizes the importance of viewing the Global M2 metric through a macro lens, noting that:

    • The correlation shows 20% deviation periods
    • Short-term price movements shouldn’t overshadow the broader trend
    • Patience is crucial for capitalizing on this macro indicator

    Additional Technical Confirmation

    Supporting this bullish outlook, analyst Titan of Crypto has identified a potential momentum flip in Bitcoin’s price action. Key technical indicators showing strength include:

    • LMACD displaying clear momentum shift
    • Weekly chart showing robust price action
    • RSI breaking key trendline resistance
    • Price targeting $90,000 in the near term

    Current Market Position

    As of the latest market data, Bitcoin trades at $85,400, showing a 1% increase over 24 hours. This price level positions BTC strategically for its projected move toward the $100,000 milestone.

    FAQ Section

    What is the Global M2 money supply?

    Global M2 money supply is a measure of the money supply that includes cash, checking deposits, and easily convertible near money. It’s considered a key indicator of potential asset price inflation.

    Why is the $144,000 target significant?

    This price target represents a key technical and psychological level based on Global M2 correlation patterns and historical price action analysis.

    When could Bitcoin reach these predicted levels?

    According to the analysis, the major price movement could begin in May 2025, following a potential dip in mid-April.

  • Dogecoin Whales Accumulate 800M DOGE: Key $0.17 Level in Focus

    Dogecoin Whales Accumulate 800M DOGE: Key $0.17 Level in Focus

    Recent on-chain data reveals massive Dogecoin (DOGE) accumulation by whale addresses, with over 800 million DOGE purchased in just 48 hours. This significant buying pressure comes as the popular meme cryptocurrency tests crucial technical levels, suggesting potential for a broader market recovery.

    The meme-inspired cryptocurrency has maintained support above $0.15, with bulls now targeting the critical $0.17 resistance level. This price action coincides with recent technical analysis showing DOGE facing a crucial test at $0.1620, making the current whale accumulation particularly noteworthy.

    Whale Activity Signals Potential Trend Reversal

    According to data from Santiment, large DOGE holders have been actively accumulating positions, with whale addresses adding approximately 800 million DOGE to their holdings since Sunday. This level of institutional buying typically precedes significant price movements, as witnessed in previous rally phases.

    SPONSORED

    Trade DOGE with up to 100x leverage on perpetual contracts

    Trade Now on Defx

    Technical Analysis: Key Levels to Watch

    DOGE currently trades at $0.16, facing immediate resistance at the 200-period moving average near $0.168. A successful break above this level could trigger a rally toward $0.20, while support remains firm at $0.15. The recent whale accumulation adds credibility to the bullish case, though traders should monitor volume for confirmation.

    Market Implications and Outlook

    While the substantial whale buying activity presents a bullish case, several factors warrant careful consideration:

    • Immediate resistance at $0.17-0.18 zone needs to be cleared
    • Global market conditions remain uncertain
    • Historical precedent suggests whale accumulation often precedes major moves

    As analysts project potential significant gains for Dogecoin in April 2025, the current accumulation phase could be positioning for this anticipated move. However, traders should maintain strict risk management given the volatile nature of meme cryptocurrencies.

    FAQ Section

    What does whale accumulation mean for DOGE price?

    Historically, large-scale whale accumulation often precedes significant price movements, though it’s not a guaranteed indicator of direction.

    What are the key resistance levels for Dogecoin?

    Current key resistance levels are $0.168 (200 MA), $0.17, and $0.20, with support at $0.15 and $0.13.

    How significant is the 800M DOGE accumulation?

    This represents one of the largest 48-hour accumulation periods in 2025, suggesting strong institutional confidence in DOGE’s short-term potential.

  • Bitcoin Whales Reduce Long Positions Despite $86K Price Rally

    Bitcoin Whales Reduce Long Positions Despite $86K Price Rally

    Bitcoin’s recent surge to $86,000 has revealed an intriguing market divergence, as whale investors appear to be taking a more cautious stance despite the broader market optimism. Recent on-chain analysis had warned of potential false signals at the $84K level, and now we’re seeing concrete evidence of institutional hesitation.

    Whale Activity Shows Bearish Divergence

    According to data from FundingVest, a respected on-chain analytics platform, large Bitcoin holders are systematically reducing their long positions even as the flagship cryptocurrency tests new resistance levels. This behavior marks a significant shift in market dynamics, particularly as retail traders continue to increase their exposure.

    SPONSORED

    Trade Bitcoin with up to 100x leverage and maximize your profit potential

    Trade Now on Defx

    Retail vs Institutional Sentiment Analysis

    The Bitcoin Whale vs Retail Ratio, a key metric for market sentiment, shows:

    • Significant decrease in whale-held long positions
    • Increasing retail trader participation
    • Growing divergence between institutional and retail sentiment

    Market Implications and Technical Outlook

    This institutional pullback could signal several potential scenarios:

    1. Preparation for a market correction
    2. Strategic repositioning before the next major move
    3. Risk management in response to increased volatility

    Bitcoin Demand Metrics Show Mixed Signals

    While whale positions are decreasing, other market indicators suggest underlying strength:

    • 30-day apparent demand recovering from negative territory
    • Increased retail accumulation patterns
    • Growing spot market activity

    FAQ Section

    Why are Bitcoin whales reducing their positions?

    Institutional investors may be taking profits or hedging against potential market volatility as Bitcoin tests key resistance levels.

    What does this mean for retail investors?

    While retail enthusiasm remains high, caution is warranted given the divergence between institutional and retail positioning.

    Could this lead to a market correction?

    Historical patterns suggest increased volatility when whale positions and retail sentiment diverge significantly.

    Traders should monitor these developments closely as they could signal important shifts in market dynamics. The current situation bears similarities to previous market cycles where institutional positioning proved to be a leading indicator for subsequent price action.

  • XRP Price Coils Under $2.20: Key Breakout Pattern Forms

    XRP Price Coils Under $2.20: Key Breakout Pattern Forms

    XRP continues to show resilience as it consolidates below the critical $2.20 level, with technical indicators suggesting a potential breakout could be imminent. The sixth-largest cryptocurrency by market capitalization is currently trading at $2.14, maintaining a strong position above key support levels while forming a compelling coiling pattern.

    Market Metrics and Technical Setup

    Current key metrics for XRP include:

    • Price: $2.14
    • Market Cap: $124 billion
    • 24h Trading Volume: $2.47 billion
    • Daily Range: $2.103 – $2.185

    This price action follows the pattern identified in recent analysis targeting $2.50, with the current consolidation phase potentially setting up for the next leg higher.

    Technical Analysis and Price Patterns

    The one-hour chart reveals a tight trading range between $2.13 and $2.18, forming a classic compression pattern. This type of price action typically precedes significant moves, with key levels to watch:

    • Immediate Resistance: $2.20
    • Key Support: $2.10
    • Secondary Support: $2.03

    SPONSORED

    Trade XRP with up to 100x leverage on perpetual contracts

    Trade Now on Defx

    Market Sentiment and Volume Analysis

    The current trading volume of $2.47 billion indicates healthy market participation, though slightly below recent averages. This consolidation phase aligns with broader market patterns, as open interest data shows increasing bullish sentiment.

    FAQ Section

    What is causing XRP’s current price consolidation?

    The consolidation appears to be driven by a balance between buying and selling pressure as traders await a clear breakout signal above $2.20.

    What are the key levels to watch for XRP?

    The primary resistance level is $2.20, while strong support exists at $2.10. A break above $2.20 could trigger a move toward $2.50.

    When might XRP break out of its current range?

    While exact timing is impossible to predict, the coiling pattern typically resolves within 24-48 hours of formation.