Tag: Market Bottom

  • Bitcoin Tests $88K: New Investor Wave Signals Market Bottom

    Bitcoin Tests $88K: New Investor Wave Signals Market Bottom

    Bitcoin (BTC) is showing renewed strength as it tests critical resistance levels around $88,000, with a fresh wave of new investors entering the market amid global economic uncertainty. This surge comes at a pivotal moment as Bitcoin’s decoupling from traditional markets intensifies, particularly as US-China trade tensions reshape the financial landscape.

    Key Market Highlights

    • Bitcoin reclaims $88,000 level after weeks of consolidation
    • New investor metrics flash ‘Buy’ signal for first time in 10 days
    • Trading volume increases 23% amid institutional interest
    • 200-day SMA at $88,400 emerges as critical resistance

    New Investor Metrics Signal Potential Bottom

    Crypto analyst Axel Adler’s data reveals a significant uptick in new market participants, historically a reliable bottom indicator. This pattern mirrors previous major corrections, including the 2021 China mining ban recovery and the $65,000 cooldown period.

    SPONSORED

    Trade Bitcoin with up to 100x leverage and maximize your profit potential

    Trade Now on Defx

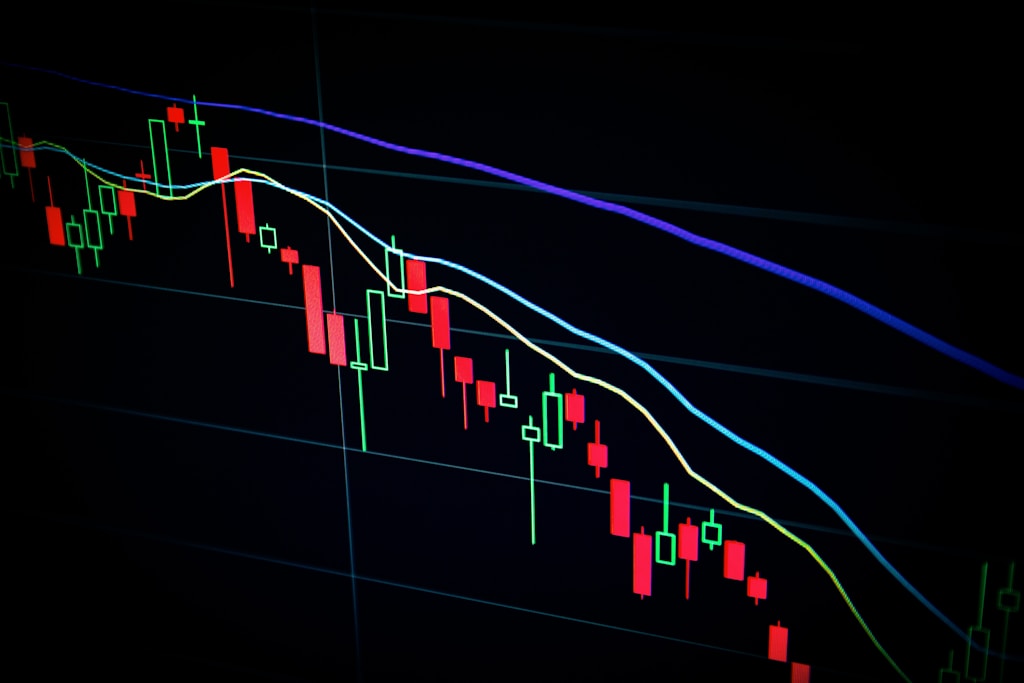
    Technical Analysis: Critical Price Levels

    Bitcoin faces immediate resistance at $88,400, coinciding with the 200-day SMA. A successful breakthrough could trigger a rally toward $90,000, while failure might lead to retests of $85,000 or $82,000 support levels. Rising open interest suggests increasing market participation and potential volatility ahead.

    Macroeconomic Factors

    The current price action plays out against a backdrop of escalating US-China trade tensions and President Trump’s calls for rate cuts. These factors, combined with traditional market weakness, position Bitcoin as a potential hedge against macroeconomic uncertainty.

    FAQ

    Is this a genuine market bottom?

    While new investor metrics suggest a potential bottom, confirmation requires sustained trading above $90,000 and improved market fundamentals.

    What could trigger the next bull run?

    Key catalysts include institutional adoption, macroeconomic uncertainty, and technical breakouts above major resistance levels.

    How does this compare to previous market cycles?

    Current patterns share similarities with past corrections, particularly in terms of new investor behavior and market structure.

    As the market approaches critical resistance levels, traders should maintain cautious optimism while monitoring key support and resistance zones. The next few days could determine Bitcoin’s trajectory for the remainder of the quarter.

  • Ethereum Price Crashes Below Realized Price: Historic Bottom Signal

    Ethereum Price Crashes Below Realized Price: Historic Bottom Signal

    Ethereum (ETH) has plunged to a critical support level of $1,380, marking the first time the cryptocurrency has traded below its realized price since March 2020. This rare technical event has historically preceded major market reversals, drawing intense attention from analysts and investors alike.

    The dramatic decline comes amid broader market turbulence, with escalating trade war tensions and new EU tariffs sending shockwaves through crypto markets. ETH has shed over 33% of its value since late March, testing long-term holder resolve.

    Understanding the Realized Price Signal

    The realized price, currently at $2,000, represents the average price at which ETH tokens last moved on-chain. Trading below this metric has historically indicated peak fear in the market and maximum pain for investors. Notable crypto analyst Carl Runefelt highlights that the last occurrence in March 2020 preceded a dramatic recovery from $109 to new all-time highs.

    SPONSORED

    Trade Ethereum with up to 100x leverage on perpetual contracts

    Trade Now on Defx

    Technical Analysis and Price Targets

    Current technical indicators paint a concerning picture for Ethereum:

    • Support levels: Primary at $1,380, secondary at $1,200
    • Resistance zones: $1,850 (previous support turned resistance)
    • Volume profile: Showing historically low buying interest
    • RSI: Deeply oversold on multiple timeframes

    Market Implications and Outlook

    While the current price action appears bearish, historical data suggests extreme fear periods often mark strategic accumulation opportunities. Recent data showing plunging open interest on major exchanges could signal a potential trend reversal ahead.

    FAQ

    What is Ethereum’s realized price?
    The realized price represents the average price at which all ETH tokens last moved, currently at $2,000.

    Why is trading below realized price significant?
    This rare occurrence has historically marked market bottoms and preceded strong recoveries.

    What are the key support levels to watch?
    Critical support exists at $1,380, with secondary support at $1,200-1,100.

    Time will tell whether this historic signal marks another major turning point for Ethereum or if further downside remains ahead.

  • Bitcoin Bottom Analysis: Market Experts Reveal Key Support Levels

    As Bitcoin’s price action remains volatile amid Trump’s tariff announcements, leading crypto analysts are weighing in on whether the market has found its bottom. Recent market rebounds following tariff-related uncertainty have sparked intense debate among industry experts.

    Market Sentiment and Technical Indicators

    The current market dynamics show striking similarities to previous cycles. Technical analysis indicates strong support at $86.5K, with multiple indicators suggesting a potential accumulation phase.

    Expert Perspectives on Bitcoin’s Bottom

    • Historical price patterns and volume analysis
    • Institutional buying behavior at key levels
    • On-chain metrics indicating accumulation
    • Market sentiment indicators and their reliability

    Political Impact on Crypto Markets

    Trump’s recent policy decisions have introduced new variables into the crypto market equation. The launch of Trump-affiliated financial products has added another layer of complexity to market analysis.

    SPONSORED

    Maximize your trading potential with up to 100x leverage on perpetual contracts

    Trade Now on Defx

    FAQs About Bitcoin’s Market Bottom

    Q: What technical indicators suggest a market bottom?
    A: Key indicators include trading volume, RSI levels, and accumulation patterns.

    Q: How do political factors influence Bitcoin’s price floor?
    A: Policy decisions and regulatory changes can significantly impact market sentiment and institutional adoption.

    Conclusion and Market Outlook

    While uncertainty remains, multiple indicators suggest the market may be approaching or has reached a bottom. Continued monitoring of institutional activity and political developments will be crucial for confirming this analysis.

  • Bitcoin Bottom Forms at $77K as Trump Eases Tariff Stance: Analysis

    Bitcoin Bottom Forms at $77K as Trump Eases Tariff Stance: Analysis

    Bitcoin (BTC) appears to be forming a local bottom around $77,000 as market sentiment improves following reports that former President Donald Trump may soften his stance on upcoming reciprocal tariffs. This development, combined with positive macroeconomic signals, suggests a potential trend reversal for the leading cryptocurrency.

    According to a comprehensive analysis by 10X Research, Bitcoin’s recent price action and several key indicators point to a bottoming formation. The critical support level at $83,000 continues to hold, providing a foundation for potential upward momentum.

    Multiple Factors Signal Bitcoin Bottom Formation

    Several key factors support the bottom formation thesis:

    • Trump’s flexibility on April 2 reciprocal tariffs easing global market concerns
    • Federal Reserve’s indication to slow balance sheet reduction
    • February 2025 CPI data meeting expectations
    • Bullish reversal in BTC’s 21-day moving average at $85,200
    • Network activity surge with transaction fees tripling

    SPONSORED

    Trade Bitcoin with up to 100x leverage and maximize your profit potential

    Trade Now on Defx

    Technical Analysis Points to Higher Targets

    Crypto analyst Ali Martinez identifies $94,000 as the crucial resistance level Bitcoin needs to overcome. A successful breach could propel BTC toward $112,000. Current market sentiment and technical indicators suggest a major breakout could be imminent.

    Key Price Levels to Watch

    Level Significance
    $77,000 Current bottom formation
    $85,200 21-day moving average
    $94,000 Critical resistance
    $112,000 Potential target

    FAQ Section

    What caused Bitcoin’s recent bottom formation?

    A combination of Trump’s softening stance on tariffs, positive Fed signals, and increased network activity contributed to the bottom formation.

    What are the key resistance levels for Bitcoin?

    The primary resistance level is at $94,000, with a potential target of $112,000 if this level is breached.

    How does Trump’s tariff policy affect Bitcoin?

    Trump’s trade policies impact global market sentiment and risk assets like Bitcoin, with a more flexible stance generally being positive for crypto markets.

    At press time, Bitcoin trades at $87,650, showing a 3.6% increase over the past 24 hours. While the immediate outlook appears positive, traders should remain cautious and monitor key resistance levels for confirmation of the bottom formation.

  • Dogecoin’s Last Chance? Analyst Reveals $0.16 Bottom!

    Dogecoin’s Last Chance? Analyst Reveals $0.16 Bottom!

    Market Analysis Reveals Critical Dogecoin Support Level

    Crypto analyst Kevin (@Kev_Capital_TA) has identified what he believes could be the final opportunity to acquire Dogecoin at relatively low prices, with technical indicators converging at a critical support level near $0.158. This analysis comes amid growing institutional interest in Dogecoin ETFs and increasing market volatility.

    Technical Indicators Signal Strong Support

    Multiple technical factors are aligning to suggest a potential bottom formation:

    • Macro 0.5 Fibonacci retracement test at $0.158
    • Convergence with 200-week SMA and EMA ($0.13-$0.17 range)
    • Historically low 3-Day RSI readings
    • Retest of multi-year descending trendline

    Key Price Levels to Watch

    The analysis highlights several critical support and resistance zones:

    • Current Support: $0.158 (0.5 Fib level)
    • Lower Support Zones:
      – $0.1157 (0.618 Fib)
      – $0.1092 (0.65 Fib)
      – $0.097 (0.70 Fib)
      – $0.080 (0.786 Fib)
    • Key Resistance: $0.28 (0.236 Fib)
    • Major Resistance: $0.47-$0.48 (Previous swing high)

    Macroeconomic Factors Support Bullish Case

    Beyond technical analysis, several macro factors support a potential upside:

    • Strong employment numbers
    • Declining inflation rates
    • Potential Federal Reserve policy pivot
    • Easing geopolitical tensions

    SPONSORED

    Trade meme coins with up to 100x leverage on perpetual contracts

    Trade Now on Defx

    Market Implications

    The current market structure suggests a potential accumulation phase, with strong technical support coinciding with improving macro conditions. Traders should monitor the $0.158 level closely, as holding above this support could confirm the bullish scenario.

    At press time, DOGE trades at $0.16, presenting what the analyst describes as an optimal risk-reward setup for long-term positioning.

  • Ethereum’s $11.5K Target: Oversold Signal Shocks Bulls!

    Ethereum’s $11.5K Target: Oversold Signal Shocks Bulls!

    Market Analysis Reveals Ethereum’s Potential Breakout

    Ethereum (ETH) has entered a critical phase as the second-largest cryptocurrency tests significant support levels amid mounting bearish pressure. Trading below $2,000, ETH’s recent price action has caught the attention of seasoned analysts who see a potential major reversal on the horizon.

    In a significant development that aligns with previous bullish predictions for Ethereum, technical indicators suggest an imminent trend reversal that could propel ETH to new heights.

    Key Technical Indicators Signal Bottom Formation

    According to renowned market expert Trader Tardigrade, Ethereum has entered a crucial oversold zone on the Stochastic indicator – a development not seen in the last three years. This technical formation historically precedes significant price rallies, with similar patterns observed in 2019 and 2022.

    • Current Price: $1,892
    • Key Support Level: $1,440
    • Resistance Level: $2,060
    • 24h Volume Change: -37%

    Historical Pattern Analysis

    The current market structure bears striking similarities to previous bottom formations that led to substantial rallies. Trader Tardigrade’s analysis suggests a potential surge toward $11,500, representing a significant upside from current levels.

    SPONSORED

    Trade Ethereum with up to 100x leverage on perpetual contracts

    Trade Now on Defx

    Critical Support Levels to Watch

    Crypto analyst Ali Martinez highlights the importance of the MVRV Extreme Deviation Pricing Bands, indicating that ETH is testing crucial support levels. The realized price of $2,060 serves as a pivotal point, with $1,440 representing the next major support level if current levels fail to hold.

    Market Implications and Future Outlook

    The convergence of technical indicators, historical patterns, and market structure suggests that Ethereum could be preparing for a significant move. However, investors should remain cautious of immediate bearish pressure, as evidenced by the declining trading volume and loss of key support levels.

    Source: Bitcoinist

  • Bitcoin Bottom Signal Flashes: $200K Target Revealed!

    Bitcoin Bottom Signal Flashes: $200K Target Revealed!

    Market Analysis Reveals Critical Bitcoin Bottom

    In a significant development for cryptocurrency markets, renowned analyst Master Ananda has declared that Bitcoin has reached its bottom following last week’s dramatic decline below $80,000. This analysis comes as Bitcoin surges past $92,000, suggesting a powerful recovery phase may be underway.

    Technical Analysis Breakdown

    According to Master Ananda’s detailed TradingView analysis, the recent price action demonstrates classic bottom formation characteristics:

    • Bottom price established at $78,300
    • 28% retracement from the all-time high of $109,000
    • Classic bullish retracement pattern identified
    • Strong support level confirmation

    Price Trajectory and Market Implications

    The analysis suggests several key price targets and milestones:

    • Daily price increases of $500-$800 expected
    • Potential $200,000 price target for next month
    • Current accumulation phase identified
    • Strong buy signal for market participants

    SPONSORED

    Trade Bitcoin with up to 100x leverage on perpetual contracts

    Trade Now on Defx

    Supporting Technical Indicators

    Additional analysis from Titan of Crypto reinforces the bullish outlook:

    • Strong reaction to Kijun support on weekly chart
    • Key resistance at $94,000 (Tenkan level)
    • Supertrend indicator remains bullish
    • No bear market signals present

    Current Market Status

    As of the latest market data, Bitcoin is trading at $92,000, showing a robust 5% gain in the past 24 hours. This price action aligns with the broader bullish narrative and suggests potential for continued upward momentum.

    Source: CoinMarketCap

  • Bitcoin Crash Triggers $818M Loss: Bottom Signal?

    Market Analysis: Bitcoin’s Recent Price Action

    Bitcoin investors have experienced a significant setback as recent market volatility triggered the second-largest realized loss event of the current cycle, totaling $818 million. This massive capitulation event, revealed through Glassnode’s on-chain data analysis, signals a potential turning point in market sentiment.

    The dramatic sell-off comes as Bitcoin trades near $90,300, showing a 7% weekly gain despite the recent turbulence.

    Understanding the Realized Loss Metric

    The Entity-Adjusted Realized Loss metric, which tracks actual losses taken by investors through their transactions, has revealed several key insights:

    • Second Largest Loss Event: The $818 million in realized losses ranks as the second-highest for this market cycle
    • Historical Context: Only surpassed by last year’s yen-carry trade unwind at $1.34 billion
    • Market Implications: Such capitulation events historically signal potential market bottoms

    Technical Analysis and Market Outlook

    Market analysts suggest this massive capitulation could represent a classic “weak hands to strong hands” transfer of assets. Historical data shows that such events often precede significant price recoveries, as panic selling typically exhausts itself at market bottoms.

    SPONSORED

    Trade Bitcoin with up to 100x leverage and capitalize on market volatility

    Trade Now on Defx

    Looking Ahead

    While the magnitude of losses suggests significant market stress, the subsequent price action showing a 7% weekly gain indicates potential recovery momentum. Traders and investors should monitor order flow and on-chain metrics for confirmation of a potential bottom formation.

  • Bitcoin Fear Index Hits 2022 Low: Buy Signal Alert!

    Market Sentiment Crashes to Historic Levels

    The cryptocurrency market is experiencing a significant sentiment shift as the Bitcoin Fear & Greed Index plummets to 10, marking its lowest point since the 2022 bear market. This dramatic decline comes amid Bitcoin’s recent price correction, with Bitcoin’s flash crash causing over $106M in liquidations.

    Understanding the Fear & Greed Index

    The Fear & Greed Index, developed by Alternative.me, operates on a scale of 0-100 and measures market sentiment through five distinct zones:

    • Extreme Fear: 25 and under
    • Fear: 26 to 46
    • Neutral: 47 to 53
    • Greed: 54 to 75
    • Extreme Greed: 76 and over

    Historical Context and Market Implications

    The current reading of 10 represents a dramatic shift from the neutral territory observed just days ago. Historically, such extreme fear levels have often preceded significant market bottoms, presenting potential opportunities for contrarian investors.

    SPONSORED

    Trade Bitcoin with up to 100x leverage and maximize market opportunities

    Trade Now on Defx

    Expert Analysis

    Market analyst Michael van de Poppe suggests, ‘The extreme fear levels we’re seeing typically represent oversold conditions. Historical data shows that accumulating during such periods has led to significant returns.’

    Current Market Status

    Bitcoin is currently trading around $84,700, showing a 14% decline over the past week. This correction has triggered widespread fear, but as Warren Buffett famously stated, investors should ‘be fearful when others are greedy, and greedy when others are fearful.’

    Looking Ahead

    While the current sentiment suggests a potential buying opportunity, investors should remain cautious and consider their risk tolerance. The market could require additional consolidation before establishing a definitive bottom.

    Source: Bitcoinist