Key Takeaways:
- Robert Kiyosaki warns of unprecedented market crash
- Predicts billions in capital flight to Bitcoin
- Traditional markets showing signs of instability
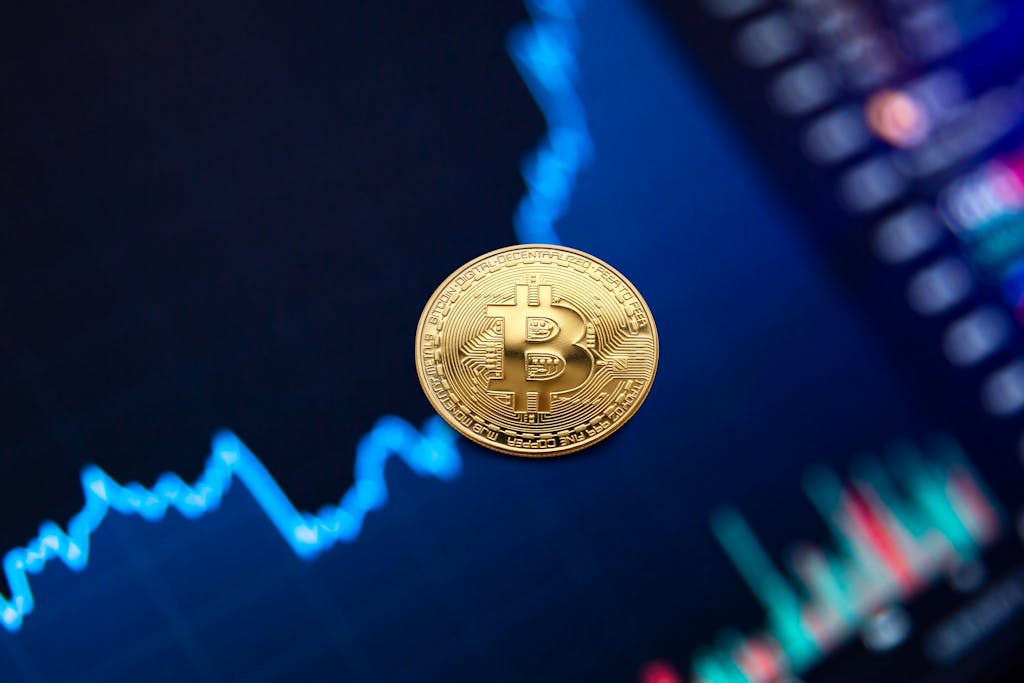
Rich Dad Poor Dad author Robert Kiyosaki has issued a stark warning about an impending market crash that could trigger a massive influx of capital into Bitcoin this summer. The renowned financial educator and cryptocurrency advocate believes the current market conditions are creating the perfect storm for Bitcoin adoption.
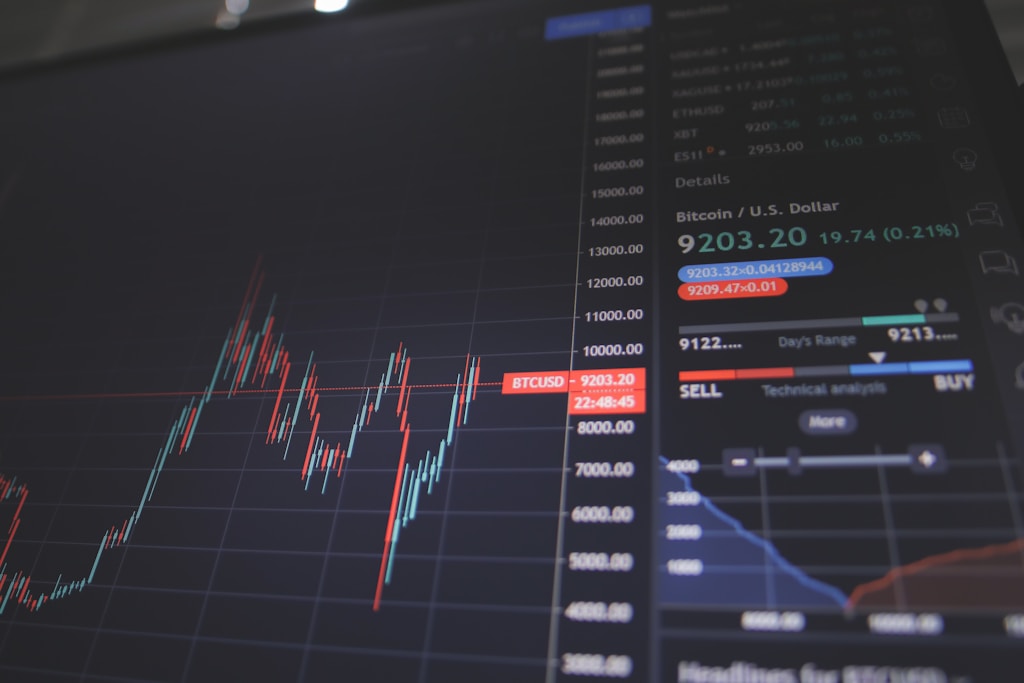
This prediction comes at a crucial time, as Bitcoin continues to maintain support above $105,000 despite recent market volatility.
Understanding Kiyosaki’s Market Crash Theory
Kiyosaki’s analysis suggests that traditional financial markets are on the brink of their biggest crash in history. This assessment aligns with recent market indicators and growing institutional interest in cryptocurrency as a hedge against traditional market risks.
Institutional Bitcoin Adoption Trends
The prediction gains credibility when viewed alongside recent institutional movements. Major corporations continue to add Bitcoin to their treasuries, demonstrating growing confidence in cryptocurrency as a store of value.
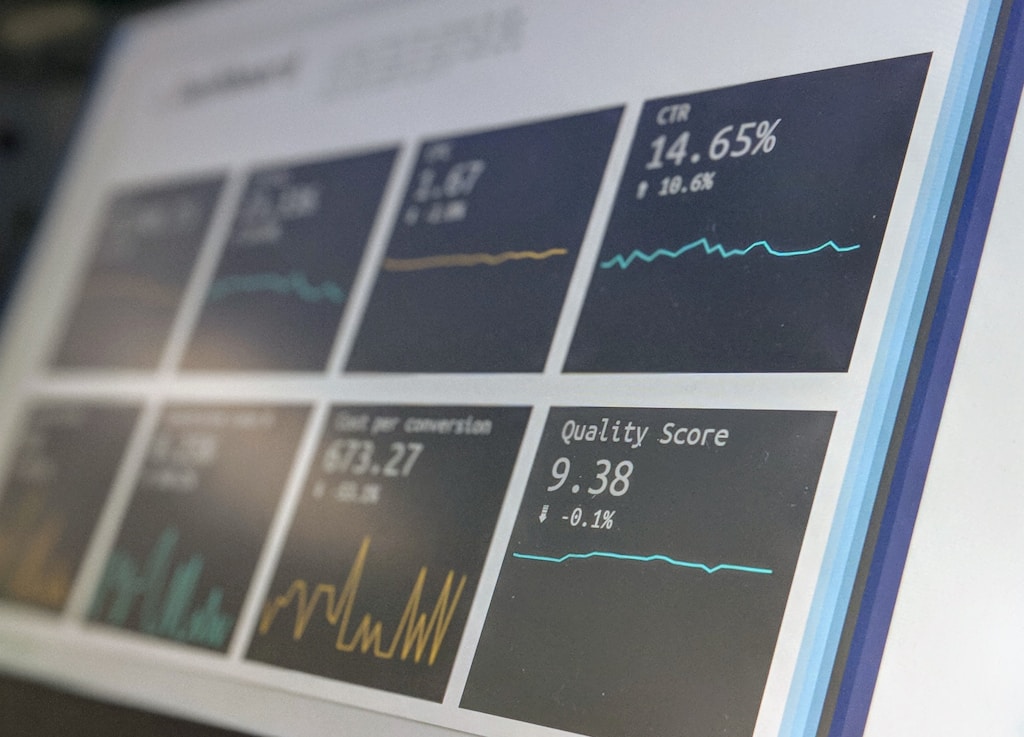
Market Impact Analysis
Key factors supporting Kiyosaki’s prediction include:
- Rising inflation concerns
- Traditional market instability
- Increasing institutional adoption
- Growing retail investor interest
FAQ Section
Q: When does Kiyosaki expect the market crash to begin?
A: According to his analysis, the crash is already underway and will accelerate through summer 2025.
Q: How might this affect Bitcoin’s price?
A: Kiyosaki suggests the influx of capital could drive significant price appreciation.
Q: What are the key risk factors to consider?
A: Market volatility, regulatory changes, and global economic conditions remain important considerations.
Expert Perspectives
Market analysts largely agree with Kiyosaki’s assessment of traditional market risks, though some debate the timeline and magnitude of the predicted crash. This aligns with recent observations from other financial experts who have noted increasing systemic risks in traditional markets.
Conclusion
While Kiyosaki’s predictions are notably bullish for Bitcoin, investors should maintain a balanced approach and consider multiple market scenarios. The coming months will be crucial in validating these predictions as market conditions continue to evolve.