Tag: Market Indicators

  • Bitcoin Price Holds $85K: 4 Key Metrics Signal Market Direction

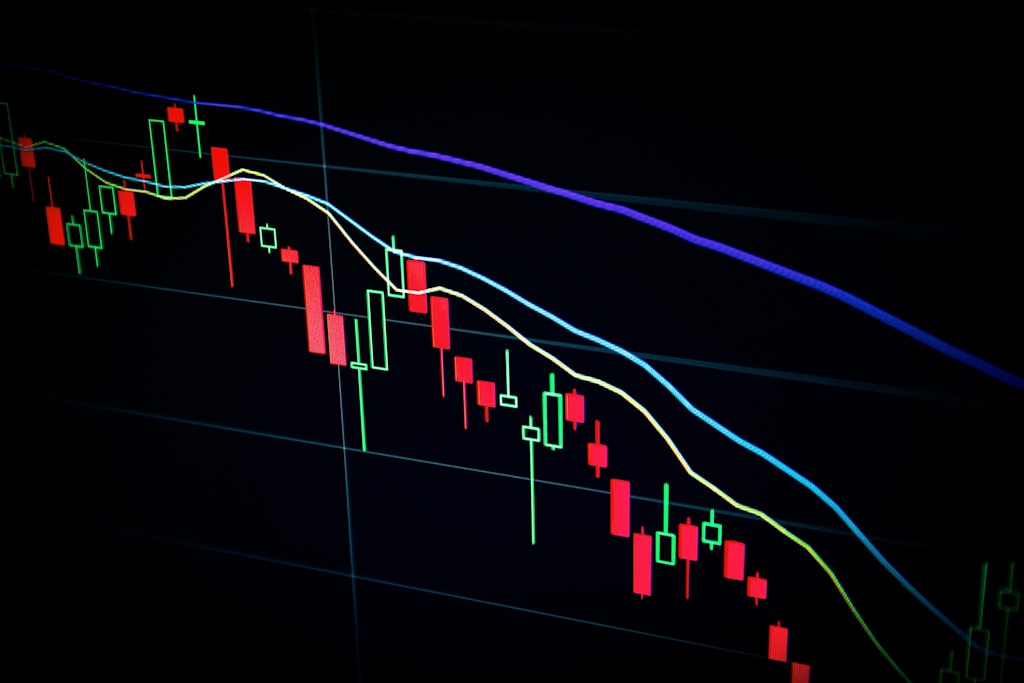
    Bitcoin continues to demonstrate resilience at the $85,000 level, with on-chain metrics providing crucial insights into the market’s next potential move. As recent price action tests key resistance zones, analysts are closely monitoring four critical indicators that could determine Bitcoin’s short-term trajectory.

    Market Overview: Bitcoin’s Current Position

    Bitcoin is maintaining stability around $87,000, experiencing only a minor 0.4% decline over the past 24 hours. This relative strength comes after the cryptocurrency briefly touched $88,000 earlier in the week, suggesting continued buying pressure despite market uncertainties.

    SPONSORED

    Maximize your trading potential with up to 100x leverage on perpetual contracts

    Trade Now on Defx

    Four Critical On-Chain Metrics Analysis

    1. Internal Funding Pressure (IFP)

    The IFP metric currently sits at 696K, below its 90-day SMA of 794K. Historical data suggests that crossing above the SMA90 typically precedes significant bullish momentum. The current positioning indicates potential accumulation phases before the next upward move.

    2. Bull & Bear Market Cycle Indicator

    Current readings show the DMA30 at -0.16 versus the DMA365 at 0.18. This divergence mirrors previous cycle patterns where temporary bearish signals preceded strong recoveries.

    3. Market Value to Realized Value (MVRV)

    The MVRV score remains below its 365-day SMA, historically a precursor to increased market activity. While this might suggest near-term selling pressure, similar patterns during the August 2024 crisis resolved positively.

    4. Net Unrealized Profit/Loss (NUPL)

    With NUPL at 0.49 compared to its 0.53 moving average, the metric suggests room for growth while staying within healthy market parameters.

    Expert Analysis and Market Implications

    According to CryptoQuant analyst Burak Kesmeci, these metrics collectively indicate market turbulence but fall short of suggesting a cycle top. This analysis aligns with recent support level studies that point to strong fundamental backing at current prices.

    Looking Ahead: Market Scenarios

    While short-term uncertainty persists, the broader market structure remains intact. External factors, including recent economic developments and regulatory discussions, continue to influence price action. However, the technical framework suggests Bitcoin maintains the potential for continued upward momentum once current resistance levels are cleared.

    FAQ Section

    What do the current on-chain metrics suggest for Bitcoin’s price?

    The metrics indicate short-term turbulence but don’t suggest a market top, pointing to potential continuation of the broader uptrend once current resistance levels are cleared.

    How does the current market structure compare to previous cycles?

    Current indicators show similarities to previous accumulation phases, particularly the patterns observed during the 2024 market recovery.

    What are the key resistance levels to watch?

    The immediate resistance lies at $88,000, with secondary resistance at the recent high of $89,000.

  • Stablecoin Market Cap Hits $220B: Bullish Signal for Crypto Rally

    Stablecoin Market Cap Hits $220B: Bullish Signal for Crypto Rally

    Stablecoin Market Cap Hits $220B: Bullish Signal for Crypto Rally

    The cryptocurrency market is witnessing a significant shift as the total stablecoin market capitalization surpasses $220 billion, potentially signaling an imminent bullish reversal. This development comes amid declining market sentiment and recent price corrections across major cryptocurrencies.

    Key Stablecoin Market Developments

    According to data from IntoTheBlock, the stablecoin market has reached a historic milestone of $220 billion, with CoinGecko reporting an even higher figure of $236.7 billion when including all stablecoin categories. This substantial liquidity pool represents capital that hasn’t left the crypto ecosystem but rather moved to sideline positions.

    SPONSORED

    Trade with confidence using up to 100x leverage on perpetual contracts

    Trade Now on Defx

    Market Implications and Analysis

    The growing stablecoin market cap carries several significant implications for the broader crypto market:

    • Ready-to-deploy capital for potential market upswings
    • Increased liquidity availability for quick market entry
    • Strong indicator of maintained investor interest despite market uncertainty

    Ripple’s RLUSD Emergence

    A notable development in the stablecoin sector is Ripple’s RLUSD, which has accumulated a circulating supply of $160 million since its December 2024 launch. This growth aligns with broader positive momentum in the Ripple ecosystem.

    Expert Insights and Market Outlook

    Market analysts suggest that the current stablecoin accumulation phase could precede a significant market upswing. The substantial liquidity buildup indicates investors are maintaining strategic positions rather than exiting the market entirely.

    FAQ Section

    Why is stablecoin market cap growth considered bullish?

    Growing stablecoin reserves indicate ready-to-deploy capital that can quickly enter the crypto market when sentiment improves.

    What impact could this have on Bitcoin price?

    The $220B+ in stablecoin liquidity could fuel significant price appreciation across major cryptocurrencies when market confidence returns.

    How does this compare to previous market cycles?

    Current stablecoin market cap levels represent historical highs, suggesting unprecedented potential for future market movements.

    Time to Read: 5 minutes

  • Bitcoin STH Losses Hit $7B: Bull Run Signals Remain Strong at $84K

    Bitcoin’s short-term holder (STH) realized losses have reached $7 billion amid price consolidation between $81,000-$86,000, yet key metrics suggest the bull market remains intact. Recent ETF inflows of $632M continue to provide strong market support despite the current correction phase.

    Short-Term Holder Losses: A Closer Look at Market Health

    According to blockchain analytics firm Glassnode, Bitcoin’s STH cohort is experiencing mounting pressure as unrealized losses approach the significant +2σ threshold. However, these losses remain well within typical bull market parameters, particularly when compared to the massive $19.8 billion and $20.7 billion capitulation events of 2021 and 2022.

    Key market indicators worth monitoring:

    • 30-day rolling realized losses: $7 billion
    • Current price consolidation range: $81,000-$86,000
    • 24-hour price change: +0.3%
    • 7-day performance: -0.6%

    Why Current Losses Don’t Signal Market Top

    Despite reaching the highest sustained loss event in the current cycle, several factors suggest we’re far from a market top:

    Metric Current Cycle 2021 Peak
    STH Realized Losses $7B $19.8B
    Market Sentiment Cautious Extreme Fear
    Institutional Interest Growing Limited

    SPONSORED

    Trade Bitcoin with up to 100x leverage and maximize your profit potential

    Trade Now on Defx

    Expert Analysis and Market Outlook

    Market analysts point to several bullish indicators that suggest the current correction is healthy for sustained growth. Technical analysis suggests a potential rally to $112K once key resistance levels are cleared.

    Frequently Asked Questions

    What are Bitcoin short-term holders?

    Short-term holders (STH) are investors who have held their Bitcoin for less than 155 days, typically more sensitive to price movements and market sentiment.

    Why are realized losses significant?

    Realized losses indicate actual selling pressure in the market, helping analysts gauge investor behavior and potential market bottoms or tops.

    What could trigger the next leg up?

    Continued institutional adoption, ETF inflows, and technical breakouts above $86,000 could catalyze the next significant price movement.

    Time to read: 5 minutes

  • Bitcoin Price Rally Imminent as M2 Money Supply Shows Bullish Pattern

    Bitcoin Price Rally Imminent as M2 Money Supply Shows Bullish Pattern

    Bitcoin (BTC) appears poised for another significant price surge as a key macroeconomic indicator – the M2 money supply – signals bullish momentum ahead. Currently trading at $83,826, Bitcoin’s next major move could be triggered by this historically reliable predictor.

    Understanding the M2 Money Supply Correlation

    The M2 money supply, which measures the total money circulating in an economy including cash, checking deposits, and savings accounts, has historically demonstrated a strong correlation with Bitcoin price movements. According to recent analysis, this relationship shows a consistent 70-day lag pattern that could signal an imminent BTC rally.

    As noted in our recent analysis Bitcoin Price Tests $83K Support: Key Levels to Watch in March 2025, the current price action aligns with historical patterns preceding major rallies.

    Key Technical Indicators Support Bullish Outlook

    Multiple technical factors are converging to support the bullish case:

    • Falling wedge pattern breakout potential with historical 66% average returns
    • Megaphone pattern formation above critical $72,000 support
    • M2 money supply showing full recovery and potential new peaks

    SPONSORED

    Maximize your trading potential with up to 100x leverage on perpetual contracts

    Trade Now on Defx

    Potential Timeline for Bitcoin’s Next Move

    Based on historical data analysis:

    • Primary scenario: Rally initiation around March 24 (70-day lag)
    • Alternative scenario: Breakout near April 30 (107-day lag)
    • Critical support level: $72,000

    Market Risks and Considerations

    Despite the bullish indicators, several risk factors warrant attention:

    • U.S. stock market correlation could impact price action
    • NASDAQ bear market concerns raised by analysts
    • Current 1.7% daily decline suggesting short-term volatility

    Frequently Asked Questions

    What is the significance of M2 money supply for Bitcoin?

    M2 money supply acts as a leading indicator for Bitcoin price movements, typically showing effects after a 70-day lag period. It helps predict potential market liquidity and investment flows.

    What price targets are analysts suggesting?

    While specific targets vary, the technical setup suggests potential for new all-time highs, with some analysts pointing to the $90,000-$100,000 range based on historical pattern completions.

    How reliable is the M2 correlation with Bitcoin?

    Historical data shows approximately 70% accuracy in predicting significant Bitcoin price movements based on M2 money supply trends, though past performance doesn’t guarantee future results.

  • Bitcoin Whales Open $87K Short Positions: Market Leverage Hits Critical Level

    Bitcoin Whales Open $87K Short Positions: Market Leverage Hits Critical Level

    Bitcoin whales are signaling bearish sentiment as they open significant short positions following BTC’s recent surge to $87,000. This strategic shift by large holders could indicate an impending market correction, with on-chain data revealing concerning leverage levels.

    Whale Activity Signals Market Caution

    According to data from Alphractal, a leading crypto analytics platform, Bitcoin whales have initiated substantial short positions after BTC tested critical support levels. This bearish positioning comes amid rising market leverage, suggesting increased volatility ahead.

    SPONSORED

    Trade Bitcoin with up to 100x leverage and maximize your profit potential

    Trade Now on Defx

    Key Market Metrics Show Rising Risk

    The Bitcoin Aggregated Open Interest/Market Cap Ratio has reached concerning levels, indicating potential market instability. This metric’s elevation historically precedes significant price movements, often leading to mass liquidations.

    On-Chain Analysis Reveals Mixed Signals

    While short-term sentiment appears bearish, data from IntoTheBlock shows whales have accumulated approximately 62,000 BTC since March, suggesting possible long-term bullish positioning. This contradictory behavior indicates market uncertainty and potential volatility ahead.

    Technical Analysis Points to Possible Reversal

    Despite current bearish positioning, technical analysis reveals a Falling Wedge pattern that could signal an upcoming reversal. Crypto analyst Captain Faibik projects a potential surge to $109,000 following a 10-15 day consolidation period.

    FAQ Section

    What does increased whale shorting mean for Bitcoin?

    Increased whale shorting often precedes market corrections and can lead to heightened volatility in Bitcoin’s price action.

    How does leverage affect Bitcoin’s price?

    Higher leverage in the market increases the risk of cascading liquidations, which can amplify price movements in either direction.

    What is the significance of the Falling Wedge pattern?

    The Falling Wedge is typically considered a bullish reversal pattern, suggesting potential upward price movement after the pattern completes.

  • Bitcoin Hot Supply Crashes 50%: Liquidity Crisis or Bullish Signal?

    Bitcoin Hot Supply Crashes 50%: Liquidity Crisis or Bullish Signal?

    Recent on-chain data reveals a dramatic shift in Bitcoin’s market dynamics as the Hot Supply metric plummets by over 50% in just three months. This significant development could signal major changes ahead for the leading cryptocurrency’s price trajectory and market structure.

    Key Findings: Bitcoin’s Hot Supply Hits Critical Low

    According to data from Glassnode, Bitcoin’s Hot Supply – representing coins moved within the past week – has dropped from 5.9% to just 2.8% of total supply. This dramatic decline coincides with significant changes in Bitcoin’s open interest metrics, suggesting a broader shift in market dynamics.

    SPONSORED

    Trade Bitcoin with up to 100x leverage and maximize your profit potential

    Trade Now on Defx

    Market Impact Analysis

    The sharp reduction in Hot Supply carries several important implications:

    • Exchange inflows have decreased from 58,600 BTC to 26,900 BTC daily
    • Futures Open Interest has declined 35% from its ATH of $57 billion
    • Overall market liquidity shows significant contraction

    Expert Insights and Technical Analysis

    This liquidity contraction comes as Bitcoin maintains its position above $85,000, suggesting potential accumulation by long-term holders. The reduced trading activity could indicate a shift from speculative trading to strategic holding patterns.

    FAQ: Understanding Bitcoin’s Hot Supply Metric

    What is Bitcoin Hot Supply?

    Hot Supply refers to Bitcoin that has moved within the past week, indicating active trading or transfer activity.

    Why is the Hot Supply decrease significant?

    A decreasing Hot Supply typically indicates reduced selling pressure and potential accumulation by long-term investors.

    How does this affect Bitcoin’s price outlook?

    Reduced liquidity often precedes major price movements, though direction depends on broader market conditions and catalyst events.

    Market Outlook and Trading Implications

    With Bitcoin trading near $85,000 and liquidity metrics showing significant contraction, traders should monitor these key levels:

    • Support: $82,000
    • Resistance: $88,500
    • Critical volume zones: $84,000-$86,000

    This market development comes amid increasing institutional interest in cryptocurrency, suggesting potential for sustained price appreciation despite reduced trading activity.

  • Bitcoin UTXO Ratio Signals Major Bottom: 30% Drop Next?

    Bitcoin UTXO Ratio Signals Major Bottom: 30% Drop Next?

    Market at Critical Juncture as Bitcoin Tests $80K Support

    Bitcoin finds itself at a decisive moment as the UTXO Profit/Loss ratio hits 50.2, potentially signaling the end of the current correction phase. With markets closely watching Fed decisions, this technical indicator could provide crucial insight into BTC’s next major move.

    Understanding the UTXO P/L Ratio Signal

    The Bitcoin UTXO Block P/L Count Ratio Model, currently at 50.2, measures the proportion of Bitcoin transactions occurring at a profit versus those at a loss. According to leading analyst Axel Adler, a 30-point drop from current levels would align with historical correction bottoms, potentially marking a significant turning point for the market.

    Key Market Statistics:

    • Current Bitcoin Price Range: $80,000 – $85,000
    • All-Time High: $109,000 (January 2025)
    • Current Drawdown: 29% from ATH
    • Critical Support Level: $80,000
    • Key Resistance: $85,000

    Technical Analysis and Market Structure

    Bitcoin’s price action remains contained between crucial technical levels, with the 200-day moving average at $84,200 serving as a pivotal point. A sustained break below $80,000 could trigger further selling pressure, while reclaiming $85,000 might signal the start of a recovery phase.

    SPONSORED

    Trade Bitcoin with up to 100x leverage on perpetual contracts

    Trade Now on Defx

    Macroeconomic Factors

    The current market uncertainty is amplified by broader economic challenges, including trade tensions and monetary policy concerns. These factors have contributed to increased volatility across both crypto and traditional markets.

    Expert Perspectives

    Market analysts suggest that the current UTXO ratio levels, combined with technical support at $80,000, could present a strategic entry point for long-term investors. Historical data shows similar patterns preceding significant market recoveries.

    Looking Ahead

    The coming weeks will be crucial for Bitcoin’s price trajectory. A break below $80,000 could test support levels at $78,000-$75,000, while a recovery above $85,000 might reignite bullish momentum toward the $90,000 level.

  • Bitcoin Warning: Fischer Signal Hints at 4-Month Pain

    Bitcoin Warning: Fischer Signal Hints at 4-Month Pain

    Market Analysis Reveals Bearish Signals

    Bitcoin’s recent price action has triggered a concerning technical signal that could spell trouble for crypto investors. According to prominent analyst Tony Severino, the Fischer Transform indicator has dropped to levels last seen during the 2022 bear market, suggesting a potentially significant downturn ahead. Recent market analysis warned of this potential downside, and now technical indicators are confirming these fears.

    Technical Indicators Paint Bearish Picture

    The Fischer Transform, a momentum oscillator designed to identify price extremes, has plunged to -1.96, with its trigger line at -1.66. These readings mirror the conditions that preceded major market corrections in 2022. Currently trading at $83,285, Bitcoin has already declined over 20% from its recent all-time high above $104,000.

    Market Outlook and Price Targets

    Analysis of the Bollinger Bands suggests a period of extended consolidation, with key levels to watch:

    • Support Level: $79,633 (Lower Bollinger Band)
    • Resistance Level: $94,917 (Middle Band)
    • Potential Upside Target: $110,201 (Upper Band)

    SPONSORED

    Protect your portfolio with up to 100x leverage on perpetual contracts

    Trade Now on Defx

    Expert Predictions and Timeline

    Severino predicts a 90-120 day period of range-bound trading before any significant breakout attempts. This extended consolidation phase could test investor patience and potentially shake out overleveraged positions.

    Source: Bitcoinist

  • Bitcoin’s 20-Day Warning: Critical $70K Support Test!

    Market Alert: Bitcoin Faces Critical Technical Test

    Bitcoin investors are on high alert as a crucial technical indicator suggests potential bearish momentum ahead. Crypto analyst Tony Severino has identified that the S&P 500 monthly LMACD has turned bearish, giving bulls just 20 days to prevent what could become a significant market downturn. This development follows Bitcoin’s recent 30% correction, raising concerns about market stability.

    Technical Analysis Breakdown

    Key technical factors currently affecting Bitcoin’s price outlook:

    • S&P 500 monthly LMACD crossing bearish
    • Strong price correlation between BTC and traditional markets
    • Current support level at $76,000
    • 20-day window for potential trend reversal

    Expert Perspectives on Market Direction

    Despite the bearish signals, several prominent analysts maintain optimistic outlooks. BitMEX co-founder Arthur Hayes suggests the current correction is a normal part of the bull market cycle, noting that the 30% pullback from all-time highs aligns with historical patterns. Hayes predicts a strong recovery once the Federal Reserve shifts toward monetary easing.

    SPONSORED

    Trade Bitcoin with up to 100x leverage on perpetual contracts

    Trade Now on Defx

    Market Implications and Future Outlook

    Analyst Kevin Capital provides a more measured perspective, suggesting Bitcoin could test the $70,000-$75,000 range while maintaining its overall bullish structure. Critical factors that could influence near-term price action include:

    • Upcoming US CPI data release
    • FOMC meeting outcomes
    • 3-day MACD reset potential
    • Key market structure support levels

    Current Market Status

    As of the latest data, Bitcoin is trading at $81,860, showing resilience with a 2% increase over the past 24 hours. This price action suggests that despite technical warnings, substantial buyer support remains active in the market.

    Source: NewsBTC

  • Ethereum RSI Hits Record Low: Major Bottom Signal?

    Ethereum RSI Hits Record Low: Major Bottom Signal?

    Market Analysis Shows Historic ETH Oversold Levels

    In a significant development for Ethereum investors, the cryptocurrency’s price continues its downward trajectory, breaking below the crucial $2,000 support level for the first time since December 2023. More importantly, the monthly Relative Strength Index (RSI) on Ethereum’s CME Futures chart has plunged to unprecedented lows, surpassing even the bearish depths of 2022.

    Technical Indicators Paint Mixed Picture

    Crypto analyst Tony “The Bull” Severino has identified a potentially significant market signal through his analysis of Ethereum’s technical indicators. The monthly RSI reading has fallen to its lowest recorded level, dropping below the previous bottom established during the 2022 bear market. This extreme oversold condition could signal either an imminent reversal or further downside pressure.

    Key Technical Levels to Watch:

    • Current Price: $1,920
    • Recent Low: $1,851
    • Key Support: $1,900
    • Previous Major Bottom: $900 (2022)

    Hidden Bullish Divergence Possibility

    Despite the bearish price action, there’s a potential silver lining. The extreme RSI readings mirror conditions that preceded Ethereum’s previous major recovery. During the 2022 bottom, similar oversold conditions led to a substantial rally after ETH found support around $900. This historical parallel suggests the possibility of a hidden bullish divergence forming at current levels.

    Stochastic Oscillator Signals Extended Bear Phase

    The monthly Stochastic oscillator has dipped below the crucial 50 mark, traditionally indicating bear market territory. Historical data suggests that Ethereum typically doesn’t find a solid bottom until this indicator reaches extreme oversold levels below 20. This pattern implies that the current bearish phase could persist for several months before a sustainable recovery emerges.

    SPONSORED

    Trade Ethereum with up to 100x leverage and maximize your profit potential

    Trade Now on Defx

    Market Implications and Outlook

    While the extreme RSI readings might suggest a potential bottom formation, traders should remain cautious. The combination of technical indicators points to continued bearish pressure in the near term, with the possibility of further price deterioration before a sustainable recovery can begin.

    Source: NewsbtC