Market Uncertainty Intensifies as QCP Capital Signals Warning
Leading crypto trading firm QCP Capital has issued a stark warning about prolonged market uncertainty, citing mounting economic pressures and geopolitical tensions that could significantly impact digital asset valuations. This analysis comes just one month after the S&P 500’s record high, suggesting a potential shift in market dynamics that could affect both traditional and crypto markets.
Key Market Indicators
- Increased defensive positioning by major hedge funds
- Rising geopolitical tensions affecting market sentiment
- Macroeconomic uncertainties creating downward pressure
- Notable losses reported by established firms like Millennium and Brevan Howard
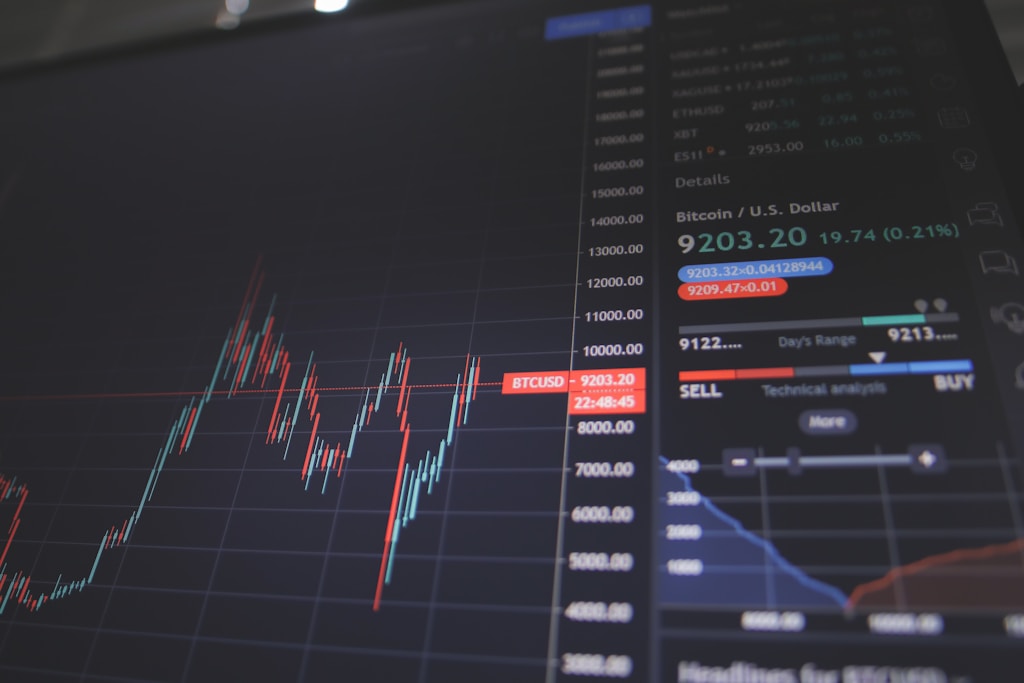
This development aligns with recent market observations highlighted in Bitcoin’s recent support test at $80K, indicating growing caution among institutional investors.
Expert Analysis and Market Implications
QCP Capital’s analysis suggests that investors should prepare for potential market turbulence ahead. The firm’s warning comes at a crucial time when traditional finance and crypto markets show increasing correlation, potentially amplifying downside risks.
Defensive Strategies and Risk Management
In light of these developments, investors are advised to:
- Maintain higher cash positions
- Implement strict risk management protocols
- Consider defensive asset allocation strategies
- Monitor key market indicators for potential trend reversals
Source: Bitcoin.com