Tag: Market Sentiment

  • Bitcoin Outflows Hit $207M as Trade Tariff Fears Shake Crypto Markets

    The cryptocurrency market is experiencing significant capital outflows amid growing concerns over global trade tensions, with Bitcoin leading the exodus according to the latest CoinShares report. Total crypto investment products saw net outflows of $240 million in the past week, marking one of the largest weekly withdrawals of 2025.

    This market movement comes as recent trade tariff announcements have sent shockwaves through both traditional and crypto markets, testing investor confidence across all asset classes.

    Bitcoin Bears the Brunt of Investor Exodus

    Bitcoin experienced the most substantial outflows, with investors withdrawing $207 million from BTC investment products. Despite this short-term bearish sentiment, Bitcoin’s year-to-date inflows remain positive at $1.3 billion, suggesting longer-term investor conviction remains intact.

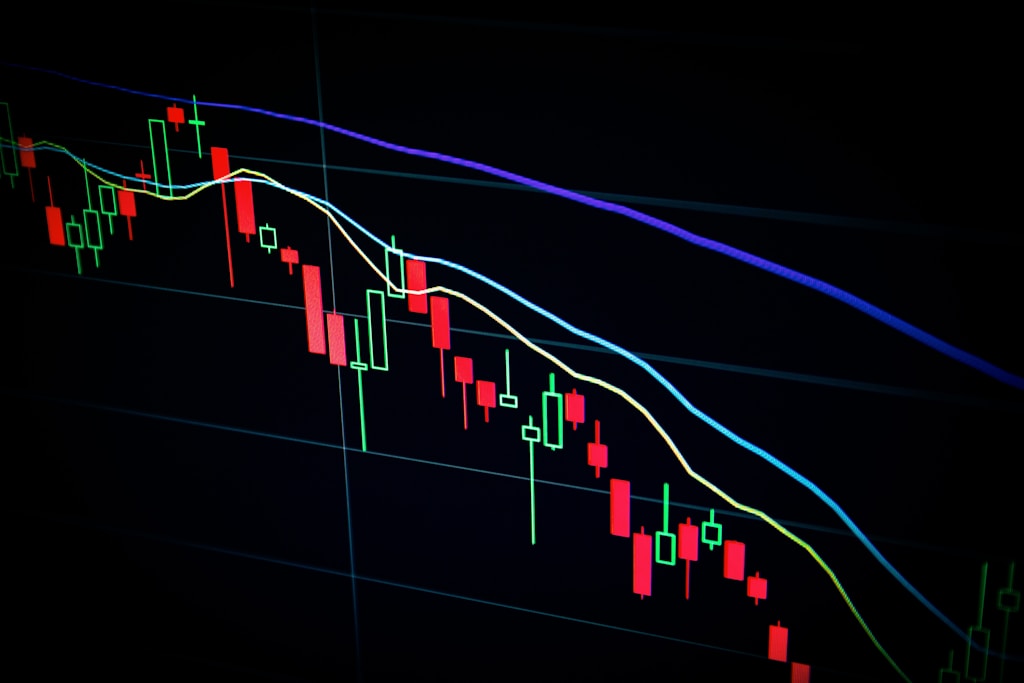
    The impact on prices has been severe, with Bitcoin dropping below the critical $75,000 support level as short-term holders face mounting pressure to sell.

    Altcoin Market Faces Similar Pressure

    Ethereum wasn’t spared from the market turbulence, recording $37.7 million in outflows. Other major altcoins including Solana and Sui saw outflows of $1.8 million and $4.7 million respectively. However, Toncoin (TON) managed to attract $1.1 million in new investments, demonstrating selective investor appetite for specific projects.

    SPONSORED

    Navigate market volatility with up to 100x leverage on perpetual contracts

    Trade Now on Defx

    Regional Investment Patterns

    The geographical distribution of outflows reveals interesting patterns:

    • US investors led withdrawals with $210 million
    • German investors pulled out $17.7 million
    • Canadian investors showed resilience with $4.8 million in inflows

    Market Resilience Despite Pressure

    Despite the significant outflows, total assets under management (AUM) have shown remarkable stability, increasing 0.8% week-over-week to $132.6 billion. This resilience stands in stark contrast to traditional markets, where MSCI World equities declined 8.5% during the same period.

    FAQ Section

    Why are investors pulling money from crypto now?

    Investors are responding to global economic uncertainty, particularly concerns about trade tariffs and their potential impact on economic growth.

    Is this a long-term bearish signal for Bitcoin?

    While short-term sentiment is cautious, Bitcoin’s strong year-to-date inflows of $1.3 billion suggest sustained long-term investor confidence.

    How does this compare to previous market corrections?

    The current outflows, while significant, haven’t matched the severity of previous major corrections, and AUM remains relatively stable.

  • Bitcoin Price Crashes Below $75K as Short-Term Holders Face Pressure

    Bitcoin Price Crashes Below $75K as Short-Term Holders Face Pressure

    Bitcoin’s price has plunged below the critical $75,000 level amid growing concerns over global tariff disputes, with short-term holders showing signs of increasing pressure. Recent market volatility triggered by tariff fears has sent shockwaves through the crypto market, raising questions about potential capitulation.

    Market Analysis: Short-Term Holder Behavior Under Scrutiny

    According to CryptoQuant analyst Yonsei Dent, the STH-SOPR (Short-Term Holder Spent Output Profit Ratio) metric reveals crucial insights into current market dynamics. This key indicator measures whether recent buyers are selling at a profit or loss, with readings below 1.0 signaling potential capitulation events.

    Despite Bitcoin’s significant decline of over 10% in the past two weeks, the STH-SOPR remains notably resilient compared to previous correction events in 2024. The formation of a death cross at $76K adds technical significance to the current price action.

    SPONSORED

    Trade Bitcoin with up to 100x leverage and maximize your profit potential

    Trade Now on Defx

    Key Support Levels and Technical Outlook

    The $78,000 level has emerged as a crucial support zone, with market participants closely monitoring this threshold for signs of stabilization. Technical analyst Merlijn The Trader suggests the current price range represents a “green zone” – historically significant accumulation levels reminiscent of 2015, 2019, and 2020 buying opportunities.

    Frequently Asked Questions

    What is causing Bitcoin’s current price decline?

    The primary factors include global tariff disputes, broader market uncertainty, and potential short-term holder capitulation.

    What is the STH-SOPR indicator showing?

    The STH-SOPR remains above extreme capitulation levels, suggesting that while pressure exists, widespread panic selling hasn’t materialized.

    What are the key support levels to watch?

    The critical support zone lies at $78,000, with secondary support at $75,000.

  • Bitcoin Price Plummets as Bull Score Index Hits Critical Low of 10

    Bitcoin’s bearish momentum intensified today as the CryptoQuant Bull Score Index dropped to a concerning level of 10, signaling severely negative market sentiment. The recent market turmoil, sparked by Trump’s global tariff announcements, has pushed BTC down 5.7% in the past 24 hours.

    Currently trading well below the $87,000 mark, Bitcoin has declined approximately 24.7% from its January all-time high above $109,000. This significant correction has triggered multiple bearish indicators that deserve close attention from traders and investors.

    Understanding the Bull Score Index Collapse

    CryptoQuant analyst Julio Moreno’s latest analysis reveals that the Bull Score Index has been flashing warning signals since Bitcoin traded near $96,000. The index’s dramatic fall to 10 represents one of its lowest readings in recent months, suggesting extreme bearish sentiment in the market.

    SPONSORED

    Trade Bitcoin with up to 100x leverage and maximize your profit potential

    Trade Now on Defx

    Long-Term Holder Activity Raises Concerns

    Adding to the bearish outlook, CryptoQuant analyst Maartunn identified significant movement among long-term Bitcoin holders. Over 1,057 BTC that remained dormant for 7-10 years have recently become active, potentially indicating selling pressure from veteran investors.

    Technical Analysis Shows Mixed Signals

    Despite the overwhelmingly bearish sentiment, some analysts maintain optimism. Technical analyst Javon Marks points to the Relative Strength Index (RSI) maintaining key support levels, suggesting potential for a recovery. However, critical support at $78.6K remains crucial for preventing further downside.

    FAQ Section

    Q: What does a Bull Score Index of 10 indicate?
    A: This extremely low reading suggests severe bearish sentiment and significant selling pressure in the Bitcoin market.

    Q: How significant is the movement of long-term holder coins?
    A: When coins that haven’t moved for 7-10 years become active, it often precedes increased selling pressure and potential market volatility.

    Q: What are the key support levels to watch?
    A: Traders should monitor the $78.6K level as crucial support, with secondary support at $75K.

  • Bitcoin Open Interest Plunges $7.4B: Market Confidence Shaken at $85K

    Bitcoin Open Interest Plunges $7.4B: Market Confidence Shaken at $85K

    Bitcoin’s market dynamics are showing signs of strain as open interest experiences a dramatic $7.4 billion decline, despite BTC maintaining price levels above $85,000. This significant shift in derivatives markets signals potential volatility ahead, even as long-term holders demonstrate remarkable resilience in the face of market uncertainty.

    Key Findings: Bitcoin’s Open Interest Collapse

    • $7.4 billion reduction in open interest over 7 days
    • All major exchanges affected except Bitfinex
    • Current BTC price: $85,107 (+3% in 24 hours)
    • 159,000 BTC accumulated by long-term holders in 30 days

    Market Impact Analysis

    The sharp decline in open interest comes at a crucial time as Bitcoin tests critical resistance levels around $85,500. This reduction in leveraged positions could signal either a healthy market reset or growing uncertainty among derivatives traders.

    SPONSORED

    Maximize your trading potential with up to 100x leverage on perpetual contracts

    Trade Now on Defx

    Long-term Holder Confidence

    Despite the derivatives market pullback, on-chain data reveals strong accumulation patterns among veteran investors:

    • 159,000 BTC purchased by long-term holders
    • Continued accumulation despite price volatility
    • Positive funding rates indicating long bias

    Market Outlook and Risk Factors

    Several key factors could influence Bitcoin’s price trajectory in the coming weeks:

    • Macroeconomic uncertainty
    • Political developments including Trump’s initiatives
    • Exchange flow patterns
    • Derivatives market rebalancing

    Frequently Asked Questions

    What does declining open interest mean for Bitcoin?

    Declining open interest typically indicates reduced leverage in the market, which can lead to lower volatility but may also signal decreasing trader confidence.

    Why are long-term holders still accumulating?

    Long-term holders often view market uncertainty as an opportunity to accumulate at better prices, demonstrating confidence in Bitcoin’s long-term value proposition.

    Could this lead to a major price correction?

    While the declining open interest raises concerns, strong accumulation by long-term holders and positive funding rates suggest underlying market strength.

    Current market conditions require careful monitoring as Bitcoin navigates this crucial period of reduced leverage and institutional repositioning.

  • Bitcoin Enters Asymmetric Demand Zone: 64% Drop in Selling Pressure

    Bitcoin’s market dynamics are showing a significant shift as the cryptocurrency enters what analysts are calling an ‘asymmetric demand zone,’ marked by a dramatic 64% reduction in selling pressure. This technical development comes at a crucial time as BTC navigates through global market uncertainty and tests critical support levels.

    As whale accumulation continues near the $83K support level, on-chain metrics reveal a compelling narrative of diminishing sell-side pressure that could set the stage for Bitcoin’s next major move.

    Key Market Indicators Signal Potential Accumulation Phase

    According to CryptoQuant data, daily selling pressure on major exchanges has plummeted from 81,000 BTC to just 29,000 BTC, representing a 64% decrease. This substantial reduction in selling activity suggests the market has successfully absorbed profit-taking following Bitcoin’s recent surge above $100,000.

    SPONSORED

    Trade Bitcoin with up to 100x leverage on perpetual contracts

    Trade Now on Defx

    Technical Analysis: Critical Support and Resistance Levels

    Bitcoin currently trades at $84,200, maintaining position above crucial support at $81,000. The immediate challenge lies in reclaiming the $86,500 resistance level, which coincides with both the 200-day MA and EMA. Recent NVT indicator analysis suggests caution as the market tests these critical levels.

    Macro Factors Influencing Bitcoin’s Price Action

    Global markets face increased uncertainty due to geopolitical tensions and policy shifts, particularly regarding new tariff announcements. These external factors continue to influence Bitcoin’s price action, though on-chain metrics suggest strong underlying accumulation patterns.

    FAQ Section

    What is the asymmetric demand zone?

    The asymmetric demand zone refers to a market condition where selling pressure has significantly decreased while buying interest remains stable or increases, potentially creating favorable conditions for price appreciation.

    Why is the $81,000 support level significant?

    This price level represents a key technical and psychological support zone that has previously acted as resistance. Maintaining this level is crucial for sustaining bullish momentum.

    What could trigger the next surge in Bitcoin’s price?

    A combination of reduced selling pressure, sustained accumulation by large holders, and favorable macro conditions could catalyze the next significant price movement.

    As the market digests these developments, the coming weeks will be crucial in determining whether Bitcoin can capitalize on this reduced selling pressure to stage its next major rally.

  • Bitcoin Price Crashes to $81.6K: Market Fear Intensifies

    Bitcoin Price Crashes to $81.6K: Market Fear Intensifies

    Bitcoin’s price trajectory took a sharp downturn this weekend, with the leading cryptocurrency plummeting to $81,629 – a significant drop that has intensified market fears and sparked concerns about potential further corrections. This price action comes as key support levels face mounting pressure in the broader crypto market.

    Market Overview: Crypto Sentiment Turns Bearish

    The cryptocurrency market witnessed a substantial decline, with the total market capitalization dropping 2.14% to $2.66 trillion. This bearish price action has triggered widespread concern among investors and traders alike.

    SPONSORED

    Navigate volatile markets with up to 100x leverage on perpetual contracts

    Trade Now on Defx

    Technical Analysis: Critical Support Levels

    The current price action suggests Bitcoin is testing several crucial support levels:

    • Primary support: $81,500
    • Secondary support: $80,000
    • Last-line defense: $78,500

    Market Sentiment Indicators

    The Fear and Greed Index has shifted significantly towards the fear zone, indicating growing uncertainty in the market. This sentiment shift aligns with recent exchange outflow data that suggested potential accumulation at higher levels.

    Expert Outlook

    Market analysts remain divided on Bitcoin’s short-term trajectory. While some view this as a healthy correction within a broader bull market, others warn of potential further downside.

    FAQs

    What caused Bitcoin’s recent price drop?

    The decline appears to be driven by a combination of profit-taking and broader market uncertainty.

    Will Bitcoin recover from this dip?

    Historical patterns suggest that such corrections are common during bull markets, though past performance doesn’t guarantee future results.

    What are the key levels to watch?

    The $80,000 psychological level remains crucial for maintaining bullish momentum.

  • Bitcoin Price Dips 2.5% as Trump Tariffs Spark Market Selloff

    Bitcoin Price Dips 2.5% as Trump Tariffs Spark Market Selloff

    The cryptocurrency market is experiencing significant downward pressure as Bitcoin (BTC) dropped 2.5% amid growing concerns over President Donald Trump’s upcoming reciprocal tariffs and crucial macroeconomic data releases. The leading cryptocurrency is currently trading at $85,266.30, with the broader digital asset market showing even steeper declines.

    This market movement coincides with recent liquidations in the Bitcoin market, suggesting a continuation of the bearish trend as key support levels are tested.

    Market Impact and Alternative Assets

    While Bitcoin’s decline appears relatively contained, altcoins are bearing the brunt of the market correction:

    • Ethereum (ETH): -6% (trading at $1,911.49)
    • XRP: -5.5%
    • Dogecoin (DOGE): -7%
    • CoinDesk 20 Index: -4.65%

    SPONSORED

    Protect your portfolio with up to 100x leverage on perpetual contracts

    Trade Now on Defx

    Key Market Factors

    Several significant factors are contributing to the current market conditions:

    1. Trump Tariffs

    Set to take effect on April 2, the new tariffs include a 25% levy on imported automobiles and certain car parts, creating uncertainty in global markets.

    2. Options Expiry

    A record-breaking $12.2 billion in BTC options are expiring on Deribit today, with a max pain point at $85,000. However, market analysts suggest limited impact due to relatively small options open interest compared to spot trading volume.

    3. ETF Flows

    Despite market turbulence, spot Bitcoin ETFs continue showing strength with:

    • $89 million in daily net inflows
    • $36.42 billion in cumulative net flows
    • Total BTC holdings reaching 1,122 million

    Expert Analysis

    According to Wintermute OTC trader Jake O., “These expirations are yet to consistently move markets, largely because BTC options open interest remains small relative to spot activity. The $12B in options is dwarfed by $28B in spot volume traded over the past 24 hours.”

    Looking Ahead

    Traders should monitor several key events:

    • PCE report release (March 28)
    • Trump tariffs implementation (April 2)
    • Technical support at $85,000

    Frequently Asked Questions

    What is causing the current crypto market decline?

    The decline is primarily driven by concerns over Trump’s upcoming tariffs, pending macroeconomic data, and general risk-off sentiment in global markets.

    Will the Bitcoin options expiry impact prices?

    Analysts suggest limited impact due to the relatively small size of options open interest compared to spot trading volume.

    How are institutional investors responding?

    Institutional interest remains strong, evidenced by continued inflows into spot Bitcoin ETFs despite market volatility.

  • Solana Price Eyes $180 as Social Sentiment Hits Record High

    Solana (SOL) is showing strong bullish momentum as social sentiment reaches unprecedented positive levels, suggesting a potential rally toward the $180 mark. On-chain data and technical analysis point to a significant shift in market dynamics for crypto’s fifth-largest asset by market capitalization.

    Record-Breaking Social Sentiment Signals Major Rally

    According to data from Santiment, Solana’s social sentiment has achieved a remarkable positive-to-negative commentary ratio of 18:1, marking a historic high. This surge in bullish sentiment comes as SOL demonstrates impressive price action, recovering 14% from recent lows of $121.

    Institutional interest has played a key role in this sentiment shift. GameStop’s recent crypto initiatives and BlackRock’s integration of tokenized treasury funds on Solana have significantly boosted investor confidence.

    SPONSORED

    Trade Solana with up to 100x leverage on perpetual contracts

    Trade Now on Defx

    Technical Analysis Points to $180 Target

    SOL has successfully reclaimed the crucial $136 support level, which served as a significant resistance point throughout Q1 2024. The recent price action shows the formation of an ascending triangle pattern, typically a bullish continuation signal.

    The recovery comes after a challenging period marked by the LIBRA token controversy and various memecoin-related incidents that temporarily dampened market sentiment.

    Key Price Levels to Watch

    • Current Support: $136-139 range
    • Immediate Resistance: $145
    • Major Target: $180
    • Extended Target: $270 (per analyst predictions)

    FAQ Section

    Q: What’s driving Solana’s current price momentum?
    A: A combination of institutional adoption, improved market sentiment, and technical breakout patterns are fueling SOL’s upward movement.

    Q: What are the key resistance levels ahead?
    A: The immediate resistance lies at $145, followed by a major barrier at $180.

    Q: How significant is the current social sentiment reading?
    A: The 18:1 positive-to-negative ratio represents an all-time high, suggesting strong bullish momentum.

    As of this writing, Solana trades at $138, showing a 2% weekly gain. The combination of strong social metrics, institutional backing, and technical breakout patterns suggests SOL could be preparing for its next major move toward the $180 target.

  • Ethereum Price Alert: Retail Sentiment Hits Bottom as $3K Target Emerges

    Ethereum (ETH) appears to be at a critical juncture as retail sentiment hits multi-year lows, while multiple technical indicators suggest an impending breakout could push prices toward $3,000. Recent data showing surging institutional ETF demand adds another bullish catalyst to the mix.

    Retail Sentiment Reaches Historic Low

    According to cryptocurrency analyst Mister Crypto, retail interest in ETH has plummeted to ‘extremely low’ levels based on Google Trends data. Current sentiment metrics show retail participation at its lowest point since 2017, suggesting widespread retail pessimism – a historically reliable contrarian indicator.

    Institutional Accumulation Phase

    While retail investors remain sidelined, institutional players appear to be quietly accumulating ETH. The potential approval of an Ethereum ETF and upcoming Pectra network upgrade could serve as major catalysts. Analyst Crypto Patel projects a post-April breakout with an ambitious $10,000 long-term target.

    SPONSORED

    Trade ETH with up to 100x leverage on perpetual contracts

    Trade Now on Defx

    Technical Indicators Flash Bullish Signals

    Multiple technical indicators support the bullish thesis. Titan of Crypto highlights a bullish crossover on ETH’s weekly Stochastic RSI – a pattern that has historically marked market bottoms. The MVRV-Z score also suggests ETH is trading at historically undervalued levels.

    Key Price Levels to Watch

    For confirmation of a bullish reversal, ETH needs to break above the critical $2,300 resistance level. A successful breakthrough could trigger a rally toward $3,000. However, failure to hold current levels could see prices test support at $1,300, according to analyst Ali Martinez.

    FAQ

    Q: What is causing low retail sentiment in Ethereum?
    A: A combination of sluggish price action, macro uncertainty, and focus on Bitcoin has dampened retail interest.

    Q: When could Ethereum break out of its current range?
    A: Analysts suggest April 2025 as a potential timeline, coinciding with ETF decisions and network upgrades.

    Q: What are the key resistance levels for ETH?
    A: The primary resistance sits at $2,300, with $3,000 as the next major target upon breakout.

    At press time, ETH trades at $2,007, down 0.5% over 24 hours as the market awaits its next major move.

  • Bitcoin Short-Term Holders Face $17B Loss as $90K Test Looms

    Bitcoin Short-Term Holders Face $17B Loss as $90K Test Looms

    Bitcoin’s price action continues to test critical resistance levels as short-term holders (STH) grapple with significant unrealized losses. On-chain data reveals STHs are currently sitting on approximately $17 billion in paper losses, yet showing remarkable resilience in the face of market volatility. This analysis explores the current market dynamics and what they signal for Bitcoin’s next major move.

    Key Short-Term Holder Metrics Signal Market Resilience

    According to recent data from CryptoQuant, short-term Bitcoin holders have demonstrated significant accumulation behavior since the start of 2025. As whale accumulation continues to shape market dynamics, STHs have added 201,743 BTC to their positions, bringing their total holdings to 5,750,076 BTC.

    SPONSORED

    Maximize your trading potential with up to 100x leverage on perpetual contracts

    Trade Now on Defx

    Market Structure Analysis: Key Price Levels

    Bitcoin currently trades near $88,200, having reclaimed crucial technical levels including the 4-hour 200 MA and 200 EMA around $87,000. The immediate challenge lies in conquering the $89,000 resistance level, which could catalyze a move toward $92,000.

    Short-Term Holder Behavior: Key Insights

    • Total STH Supply: 5,750,076 BTC
    • Recent Accumulation: 201,743 BTC since January 1st, 2025
    • Unrealized Losses: ~$17 billion
    • Historical Context: Current levels below previous cycle peaks (8.4M and 7M BTC)

    Technical Outlook and Price Targets

    The market structure suggests two potential scenarios:

    Bullish Scenario:

    • Break above $89,000 could trigger rally to $92,000
    • Sustained momentum could flip market structure bullish
    • STH accumulation suggests growing confidence

    Bearish Scenario:

    • Failure to break $89,000 could lead to retest of $81,500
    • Increased selling pressure from STHs seeking to minimize losses
    • Macro uncertainties weighing on sentiment

    Frequently Asked Questions

    What defines a Short-Term Holder in Bitcoin?

    Short-Term Holders are typically defined as addresses holding Bitcoin for less than 155 days (approximately 6 months).

    Why are unrealized losses significant?

    Unrealized losses can indicate potential selling pressure if holders decide to exit positions, but can also signal strong conviction if holders maintain positions despite being underwater.

    What could trigger a market reversal?

    A combination of sustained buying pressure, improved macro conditions, and technical breakouts above key resistance levels could catalyze a broader market recovery.

    As Bitcoin tests critical price levels, the market remains in a decisive phase. While short-term holders face significant unrealized losses, their holding behavior suggests growing market resilience. The coming days will be crucial in determining whether Bitcoin can build momentum for a sustained recovery or faces further consolidation.