Tag: Market Update

  • Bitcoin Price Nears $105K: Mixed Signals Warn of Potential Pullback

    Bitcoin Price Nears $105K: Mixed Signals Warn of Potential Pullback

    Key Takeaways:

    • Bitcoin trading at $104,071 with $2.067T market cap
    • 24-hour range: $103,108 – $104,836
    • Strong daily momentum meets short-term caution signals

    Bitcoin continues its impressive rally near the $105,000 mark, though technical indicators suggest traders should proceed with caution. As Bitcoin tests the critical $105K resistance level, market participants are closely monitoring short-term signals for potential consolidation.

    Market Analysis: Strength Meets Caution

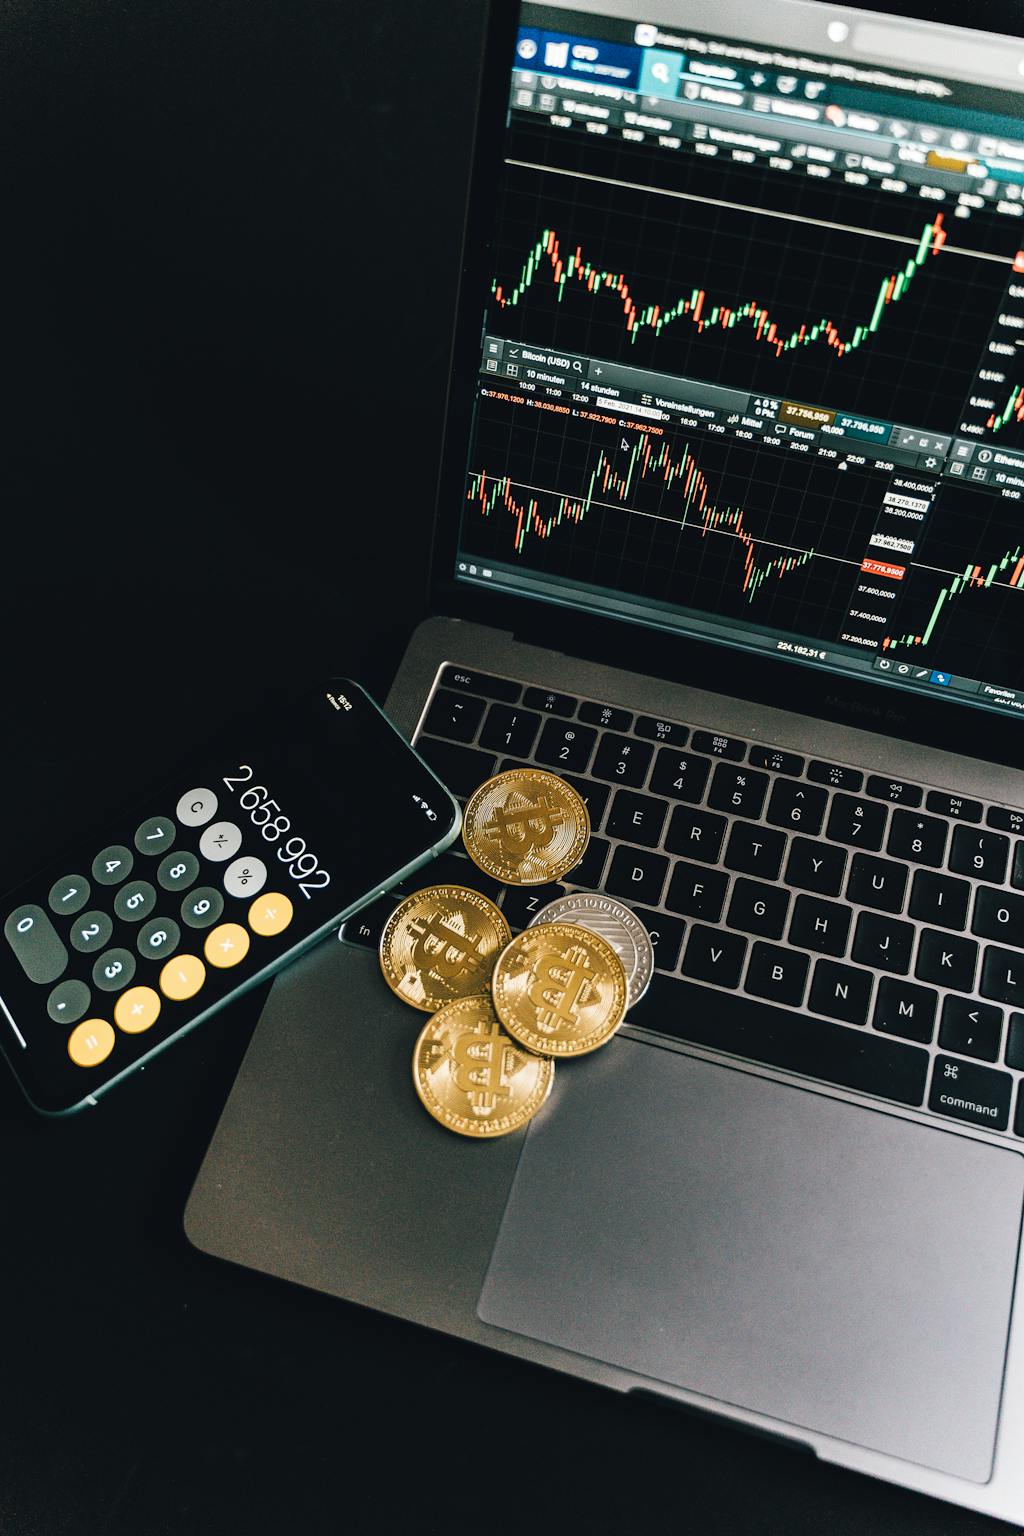
    The leading cryptocurrency is demonstrating remarkable strength, currently trading at $104,071 with a substantial market capitalization of $2.067 trillion. The 24-hour trading volume of $30.25 billion indicates healthy market participation, though slightly lower than recent peaks.

    Technical Outlook

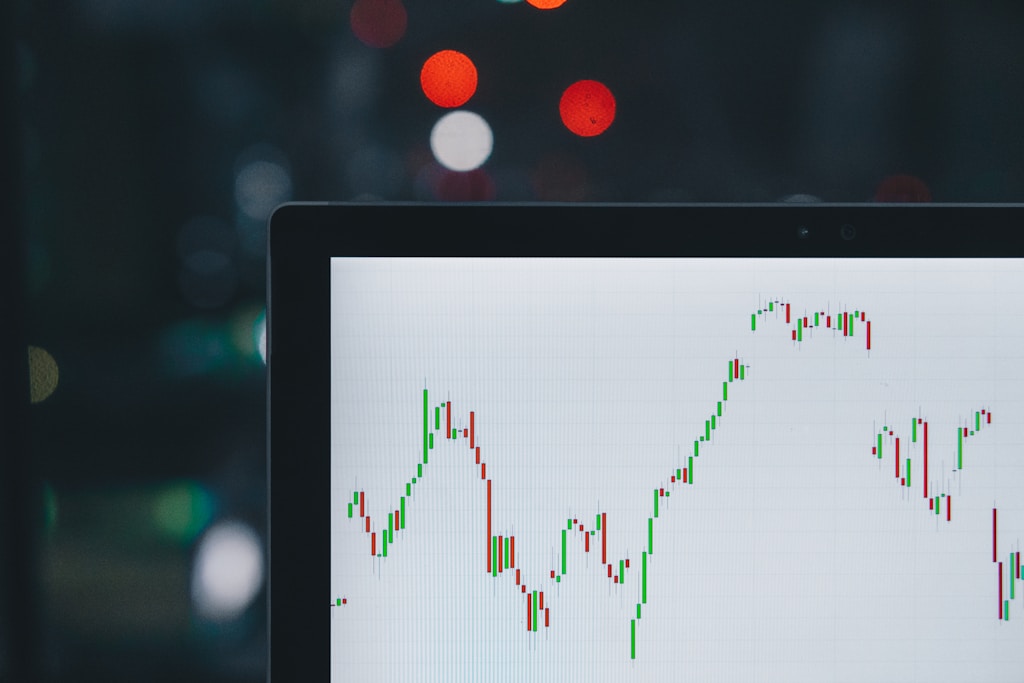
    Bitcoin’s price action shows a tight consolidation pattern, with the 24-hour range between $103,108 and $104,836 suggesting decreasing volatility near all-time highs. This consolidation follows significant whale accumulation, which had previously pushed prices higher.

    SPONSORED

    Maximize your Bitcoin trading potential with up to 100x leverage on perpetual contracts

    Trade Now on Defx

    Risk Factors to Consider

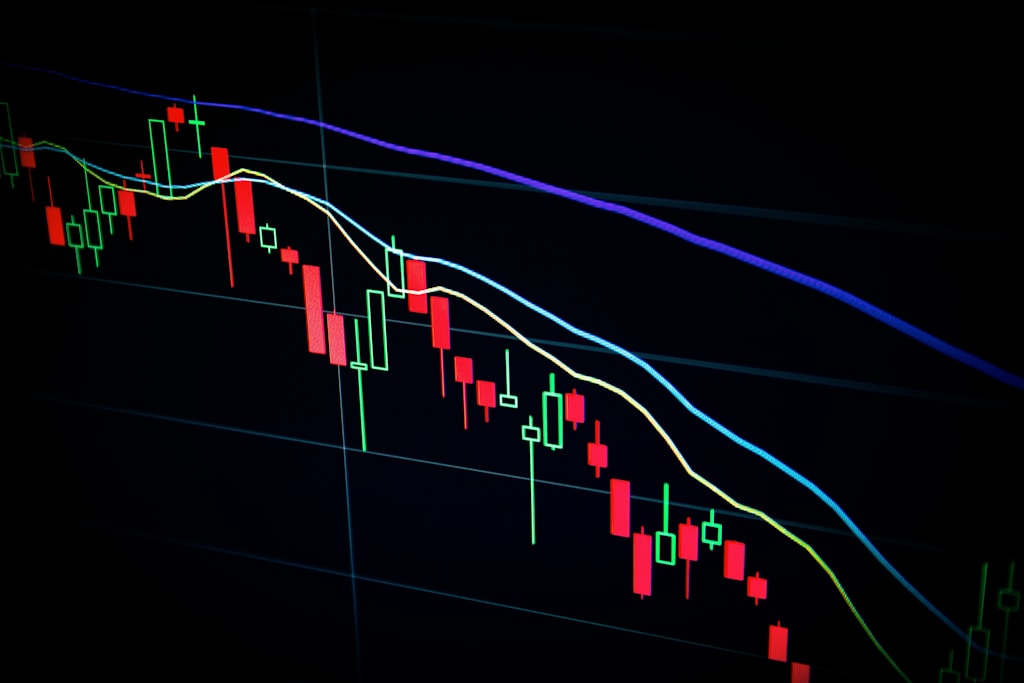
    Despite the overall bullish momentum, several short-term indicators suggest caution:

    • Decreasing trading volume near resistance
    • Tight price consolidation potentially signaling exhaustion
    • RSI showing slight bearish divergence on lower timeframes

    Expert Outlook

    Market analysts suggest that while the long-term trend remains firmly bullish, traders should be prepared for potential short-term pullbacks as the market digests recent gains.

    Frequently Asked Questions

    Q: What’s causing Bitcoin’s current price action?
    A: A combination of strong institutional buying, reduced selling pressure, and overall market optimism has supported Bitcoin’s price near $105K.

    Q: Should investors be concerned about a potential pullback?
    A: While short-term corrections are normal in bull markets, the strong fundamental backdrop suggests any dips could present buying opportunities.

    Q: What are the key support levels to watch?
    A: Major support levels exist at $103,000, $101,500, and the psychological $100,000 mark.

  • Dogecoin Supply Shock: 96M DOGE Tokens Unlock Could Impact Price

    Dogecoin Supply Shock: 96M DOGE Tokens Unlock Could Impact Price

    In a significant development for the popular meme cryptocurrency, Dogecoin’s upcoming token unlock is set to introduce nearly 100 million new DOGE tokens into circulation, potentially impacting the token’s market dynamics and price action.

    Understanding the Dogecoin Token Unlock Event

    According to prominent crypto reporter Wu Blockchain, Dogecoin is preparing for a substantial linear token unlock spanning seven days. The unlock will release approximately 96.52 million DOGE tokens, valued at $22.75 million at current market prices. This translates to daily releases of about 14 million tokens worth $3.41 million.

    SPONSORED

    Trade DOGE with up to 100x leverage on perpetual contracts

    Trade Now on Defx

    Market Impact Analysis

    While the 0.06% supply increase might seem minimal, the unlock’s timing and market conditions could influence DOGE’s price action. Currently, Dogecoin maintains support above $0.22, suggesting strong buyer confidence despite the imminent supply increase.

    Broader Token Unlock Landscape

    The cryptocurrency market is witnessing several major token unlocks, including:

    • Solana: 455,770 SOL ($81.84M)
    • Worldcoin: 37.23M tokens ($48.02M)
    • Aptos, Avalanche, and Arbitrum: $30M+ each

    Expert Price Predictions

    Despite potential selling pressure from the token unlock, market analysts remain optimistic about DOGE’s price trajectory. Technical indicators suggest the market could absorb the new supply without significant downward pressure, particularly if current buying momentum persists.

    FAQ Section

    How will the token unlock affect Dogecoin’s price?

    While some selling pressure is expected, strong market support above $0.22 suggests potential resilience.

    When does the token unlock begin?

    The linear unlock process begins on Monday and continues for seven days.

    What’s the total value of tokens being unlocked?

    The total value of the unlocked tokens is approximately $22.75 million at current market prices.

    Investors should monitor market indicators closely during this period and consider the broader crypto market conditions when making trading decisions.

  • Dogecoin Price Surges 13% as Bullish Divergence Pattern Confirms

    Dogecoin (DOGE) has experienced a dramatic 13% price surge following key technical confirmations and major macroeconomic developments that have reinvigorated the broader crypto market. The popular meme coin’s momentum shift comes amid President Trump’s announcement of a 90-day tariff pause that sent Bitcoin above $80,000.

    Technical Analysis Confirms Bullish Setup

    Renowned crypto analyst Kevin (@Kev_Capital_TA) has identified a clear bullish divergence pattern on Dogecoin’s daily timeframe, which began playing out as predicted. The technical setup gained additional momentum from positive macro catalysts, though Kevin notes that chart indicators had already been suggesting potential upside.

    SPONSORED

    Trade DOGE with up to 100x leverage on perpetual contracts

    Trade Now on Defx

    Critical Support Levels and Price Targets

    The analysis highlights $0.139 as a crucial support level that Dogecoin must maintain. Multiple technical indicators, including the 3-Day MACD and Weekly Stoch RSI, are approaching reset levels, potentially setting up for continued upward momentum.

    Fibonacci Extension Targets

    Key Fibonacci levels to watch include:

    • Short-term target: $0.19039 (0.5 Fib level)
    • Mid-term target: $0.41339 (0.786 Fib level)
    • Long-term target: $0.73839 (1.0 Fib level)

    Market Correlation and Bitcoin Dependency

    The analyst emphasizes that Dogecoin’s bullish outlook remains contingent on Bitcoin maintaining support above $70,000. This correlation was evident in the recent market-wide rally triggered by Trump’s tariff policy announcement.

    FAQ Section

    What caused Dogecoin’s recent price surge?

    The 13% price increase was triggered by a combination of technical factors (bullish divergence) and macro developments (Trump’s tariff pause announcement).

    What is the key support level for Dogecoin?

    The critical support level is $0.139, which must be maintained for the bullish outlook to remain valid.

    What are the potential price targets for Dogecoin?

    Based on Fibonacci levels, key targets range from $0.19039 in the short term up to $0.73839 for long-term holders.

    At press time, DOGE is trading at $0.15751, showing strong momentum above key support levels.

  • Ethereum Price Crashes 10% to $1,410 – Critical Support Tested

    Ethereum Price Crashes 10% to $1,410 – Critical Support Tested

    Ethereum (ETH) has experienced a sharp 10% decline, with the price plummeting below multiple support levels and testing a critical threshold at $1,410. This significant drop mirrors broader cryptocurrency market weakness and could signal further downside ahead.

    As previously reported, the $1,400 level represents a crucial support zone that bulls need to defend to prevent additional losses.

    Key Technical Levels Under Pressure

    The latest price action shows several bearish developments:

    • Price failed to hold above $1,620 support
    • Trading below the 100-hour Simple Moving Average
    • Bearish trend line resistance at $1,520
    • RSI indicating oversold conditions below 50

    SPONSORED

    Trade ETH with up to 100x leverage and maximize your profit potential

    Trade Now on Defx

    Critical Support Levels to Watch

    Traders should monitor these key support zones:

    • Primary support: $1,410
    • Secondary support: $1,385
    • Last line of defense: $1,320

    Potential Recovery Scenarios

    For any meaningful recovery, ETH needs to:

    1. Break above $1,520 resistance
    2. Reclaim the $1,560 level
    3. Push toward $1,620 to invalidate the bearish setup

    Expert Analysis

    Technical indicators suggest continued bearish momentum:

    • MACD showing increasing bearish momentum
    • RSI below 50, indicating seller control
    • Volume profile supporting the downward move

    Frequently Asked Questions

    What caused Ethereum’s price drop?

    The decline appears driven by broader market weakness, technical resistance failures, and increased selling pressure at higher levels.

    Will ETH bounce from $1,410 support?

    While historically significant, the $1,410 level needs strong buying volume to act as reliable support.

    What’s the worst-case scenario?

    If $1,385 breaks, ETH could test deeper support at $1,320 or even $1,240 in extreme cases.

    Traders should maintain strict risk management and watch for potential reversal signals near the identified support levels.

  • Bitcoin Price Plunges Below $75K – Key Support Levels to Watch

    Bitcoin’s price trajectory has taken a bearish turn, with BTC dropping sharply below the critical $78,000 level as market sentiment shifts. This comprehensive analysis examines the key support and resistance levels traders should monitor, along with technical indicators suggesting potential price direction.

    Bitcoin’s Latest Price Movement Analysis

    In a significant market development that follows recent tests of the $80,000 support level, Bitcoin has entered a decisive bearish phase. The flagship cryptocurrency has broken several key support levels:

    • Initial breach below $78,500
    • Sharp decline through $77,000
    • Critical support at $75,000 compromised
    • New local low established at $74,475

    Technical Analysis and Key Levels

    The current price action shows several bearish indicators:

    • Trading below the 100-hour Simple Moving Average
    • Bearish trend line resistance at $79,500
    • RSI below 50, indicating bearish momentum
    • MACD gaining momentum in the bearish zone

    SPONSORED

    Trade Bitcoin with up to 100x leverage and maximize your profit potential

    Trade Now on Defx

    Critical Support and Resistance Levels

    Traders should monitor these key price levels:

    Resistance Levels:

    • Primary resistance: $78,500
    • Secondary resistance: $79,500
    • Major resistance: $81,500

    Support Levels:

    • Immediate support: $75,750
    • Critical support: $74,750
    • Major support: $70,000

    Market Outlook and Trading Implications

    The current price action suggests two potential scenarios:

    Bullish Scenario:

    A break above $79,500 could trigger a rally toward $81,500, with potential extension to $82,000.

    Bearish Scenario:

    Failure to reclaim $78,500 could lead to further decline, potentially testing the $72,000 support level.

    Frequently Asked Questions

    What caused Bitcoin’s recent price drop?

    The decline appears technical in nature, following repeated tests of the $80,000 resistance level and broader market uncertainty.

    Could Bitcoin fall below $70,000?

    While $70,000 represents major psychological support, a break below current levels could trigger increased selling pressure toward this mark.

    What technical indicators should traders watch?

    Key indicators include the 100-hour SMA, RSI levels, and the MACD momentum indicator for potential trend reversals.

  • Dogecoin Price Alert: DOGE Tests Critical $0.13 Support Level

    Dogecoin Price Alert: DOGE Tests Critical $0.13 Support Level

    The cryptocurrency market’s favorite meme coin is facing a crucial moment as Dogecoin (DOGE) tests a critical support level at $0.1293, raising questions about its future trajectory. Recent price action suggests a potential shift in momentum, with technical indicators showing mixed signals for the popular digital asset.

    Technical Analysis Reveals Bullish Divergence

    According to respected crypto analyst Cantonese Cat, a notable bullish divergence has formed on Dogecoin’s Relative Strength Index (RSI), potentially signaling a trend reversal. This technical pattern, characterized by lower price lows but higher RSI readings, often precedes significant price recoveries in the cryptocurrency market.

    SPONSORED

    Trade DOGE with up to 100x leverage and maximize your profit potential

    Trade Now on Defx

    Key Price Levels to Watch

    The immediate support level at $0.1293 has proven crucial for DOGE’s price action. A successful defense of this level could pave the way for a recovery toward the next significant resistance at $0.18. Beyond that, traders are eyeing potential targets at $0.2403 and $0.2923.

    This price action follows a broader trend where Dogecoin recently led an altcoin market recovery, demonstrating its continued influence in the cryptocurrency ecosystem.

    Market Sentiment and Trading Volume

    Trading volume has remained subdued compared to previous rallies, suggesting cautious sentiment among investors. The once-vibrant community engagement that characterized Dogecoin’s meteoric rise appears to be cooling, though core supporters maintain their long-term bullish outlook.

    FAQ Section

    Q: What is causing Dogecoin’s current price movement?
    A: A combination of technical factors, including RSI bullish divergence and key support level testing, along with shifting market sentiment toward utility-driven tokens.

    Q: What are the key resistance levels for DOGE?
    A: The primary resistance levels are $0.18, followed by $0.2403 and $0.2923.

    Q: Is Dogecoin still a viable investment?
    A: While showing technical resilience, investors should consider the current market conditions and conduct thorough research before making investment decisions.

    Looking Ahead

    The coming weeks will be crucial for Dogecoin’s price trajectory. A successful defense of the $0.1293 support could reinvigorate buyer confidence and potentially trigger a new upward trend. However, broader market conditions and sustained buying pressure will be essential for any meaningful recovery.

  • XRP Price Struggles at $2.00: Key Support Levels Under Pressure

    XRP’s price action has taken a bearish turn as the cryptocurrency faces significant resistance at the crucial $2.00 level. The digital asset is showing signs of weakness after failing to maintain momentum above key support zones, suggesting potential further downside ahead.

    In a market development that mirrors Bitcoin’s recent test of $80K support levels, XRP has entered a corrective phase that could define its short-term trajectory.

    Technical Analysis Shows Mounting Pressure

    The latest price action reveals several critical technical developments:

    • Price declined below multiple support levels: $1.950, $1.80, and $1.750
    • Formation of a local bottom at $1.610
    • Trading activity now concentrated below the 100-hourly Simple Moving Average
    • Bearish trend line resistance emerging at $1.935

    SPONSORED

    Trade XRP with up to 100x leverage on perpetual contracts

    Trade Now on Defx

    Key Price Levels to Watch

    Traders should monitor these critical support and resistance levels:

    Resistance Levels Support Levels
    $2.00 $1.850
    $2.050 $1.80
    $2.120 $1.740

    Market Indicators and Outlook

    Technical indicators present a mixed picture:

    • MACD: Showing bullish momentum despite price weakness
    • RSI: Positioned above 50, indicating neutral to slightly bullish sentiment
    • Fibonacci retracement: Price testing 61.8% level at $1.935

    Frequently Asked Questions

    What’s causing XRP’s current price weakness?

    The primary factors include technical resistance at $2.00 and broader market correlation with major cryptocurrencies experiencing similar corrections.

    Could XRP break above $2.00 in the near term?

    While possible, the current technical setup suggests significant resistance, requiring substantial buying pressure to overcome the $2.00 barrier.

    What’s the worst-case scenario for XRP?

    If support at $1.80 fails, the price could test lower support levels at $1.740 and potentially $1.650.

    Traders should maintain strict risk management practices given the current market volatility and watch for potential breakdown below key support levels.

  • Bitcoin Price Crashes 11% to $77K as Trump Tariffs Spark Global Panic

    Bitcoin Price Crashes 11% to $77K as Trump Tariffs Spark Global Panic

    The cryptocurrency market faced a severe downturn today as Trump’s new tariff policies triggered what traders are calling ‘Black Monday.’ Bitcoin’s dramatic price movement has sent shockwaves through both traditional and crypto markets, with the flagship cryptocurrency plummeting 11% to test critical support at $77,000.

    Market Impact of Trump’s Tariff Announcement

    The selloff intensified after Trump announced a 10% baseline tariff on all US imports, with additional reciprocal tariffs targeting both allies and competitors. This aggressive trade policy, set to take effect on April 9, has sparked fears of a global economic slowdown.

    Key market movements include:

    • NASDAQ down 11% in two sessions
    • Bitcoin (BTC) dropped 11% to $77,000
    • Ethereum (ETH) plunged 20% to $1,429

    SPONSORED

    Navigate market volatility with up to 100x leverage on perpetual contracts

    Trade Now on Defx

    Expert Analysis and Market Outlook

    Bill Ackman, despite being a Trump supporter, has called for a 90-day pause on the tariffs, warning of potential ‘nuclear winter’ for the US economy. Meanwhile, Van de Poppe from MN Consultancy suggests these measures could be reversed within 6-12 months.

    Potential Recovery Catalysts

    Several factors could support a market recovery:

    • Possible Fed intervention with interest rate cuts
    • Potential quantitative easing (QE) cycle
    • Growing institutional interest in crypto as a hedge

    Alternative Investment Opportunities

    While the market experiences turbulence, several presale opportunities have emerged as potential safe havens, offering immunity from current market volatility. These include BTC Bull Token ($BTCBULL), SUBBD Token ($SUBBD), and Lightchain AI ($LCAI).

    FAQs

    Q: How long could the market downturn last?
    A: Experts suggest the impact could be temporary, with possible recovery within 6-12 months.

    Q: What are the key support levels to watch?
    A: Bitcoin’s immediate support lies at $75,000, with secondary support at $72,000.

    Q: How might this affect crypto adoption?
    A: The situation could accelerate crypto adoption as a hedge against economic uncertainty.

  • Dogecoin Price Crashes 20% to $0.135: Critical Bull Line in Focus

    Dogecoin Price Crashes 20% to $0.135: Critical Bull Line in Focus

    Dogecoin (DOGE) has plummeted over 20% in the last 24 hours amid a broader cryptocurrency market selloff, with the meme coin now testing a crucial technical support level that could determine its next major move. Recent technical analysis had identified the $0.16 level as critical support, making the current price action particularly significant.

    Key Technical Level Under Pressure

    Crypto analyst Kevin (@Kev_Capital_TA) maintains that DOGE is holding its “bull market line” at $0.139, despite the sharp decline. This level represents the last major support before a potential shift in market structure that could trigger further downside.

    “Nothing much has changed on Dogecoin since my last post on 3/22. Higher time frame indicators are mostly reset and we are holding the bull market line in the sand of support,” Kevin notes, adding that favorable economic data and Bitcoin stability could fuel a recovery.

    Technical Indicators Reset

    Several key technical indicators are approaching oversold territory, including:

    • 3-Day MACD
    • Weekly Stochastic RSI
    • 2-Week Stochastic RSI

    These readings suggest a potential bounce may be forming, provided broader market conditions stabilize. Bitcoin’s recent drop below $80,000 has added significant pressure to altcoins like DOGE.

    SPONSORED

    Trade DOGE with up to 100x leverage on perpetual contracts

    Trade Now on Defx

    Global Liquidity Context

    The analyst’s overlay of the Global Liquidity Index reveals DOGE is retesting the breakout point from its extended bear market range (May 2021 – October 2024). This coincides with the macro 0.382 Fibonacci level at $0.142, potentially offering strong technical support.

    Key Price Levels to Watch

    • Critical Support: $0.139
    • Macro Fibonacci Level: $0.142
    • Current Price: $0.13558
    • Bitcoin Correlation Level: $70,000

    FAQ

    Q: What is the key support level for Dogecoin?
    A: The critical bull market support line sits at $0.139, with the macro 0.382 Fibonacci level at $0.142 serving as additional resistance.

    Q: How does Bitcoin affect Dogecoin’s price?
    A: As a high-beta altcoin, DOGE shows amplified reactions to Bitcoin’s movements. Current analysis suggests Bitcoin needs to hold above $70,000 to maintain DOGE’s bullish structure.

    Q: What could trigger a DOGE recovery?
    A: A combination of favorable economic data, Bitcoin stability, and improving global liquidity conditions could fuel a recovery rally.

  • Bitcoin Crashes 8% to $77.3K as Trump Tariffs Rock Crypto Markets

    Bitcoin Crashes 8% to $77.3K as Trump Tariffs Rock Crypto Markets

    Bitcoin and the broader cryptocurrency market faced severe downward pressure today as Trump’s sweeping new tariff announcements sent shockwaves through global financial markets. The leading cryptocurrency plummeted 8% to $77,300, while Ethereum suffered an even steeper 14% decline.

    Market Impact of Trump’s Tariff Announcement

    Billionaire investor and Trump ally Bill Ackman has called for a 90-day pause on the implementation of new US tariffs as markets reel from the announcement. The proposed pause aims to give businesses and markets time to adjust to the dramatic policy shift.

    Key Price Levels to Watch

    Bitcoin’s critical support level at $81,000 was decisively broken during today’s selloff, opening the door for further downside. Technical analysts are now watching the $75,000 level as the next major support zone.

    Broader Market Implications

    The crypto market’s reaction mirrors broader financial market concerns, with liquidations reaching $900 million as traders rush to reduce risk exposure.

    SPONSORED

    Trade Bitcoin with up to 100x leverage and maximize your profit potential

    Trade Now on Defx

    Expert Analysis

    Market analysts suggest this correction could present a buying opportunity for long-term investors, though short-term volatility is expected to persist as markets digest the implications of the new tariff policies.

    FAQ

    How long could this market downturn last?

    Analysts expect volatility to continue until there’s more clarity on the implementation of the new tariffs.

    What are the key support levels to watch?

    After breaking $81,000, the next major support levels are at $75,000 and $72,000.

    How does this compare to previous market corrections?

    This correction is notably different as it’s driven by macro policy changes rather than crypto-specific factors.