Tag: Meme Coins

  • Base Meme Coin Crashes 92%: Coinbase Warning Comes Too Late

    Base Meme Coin Crashes 92%: Coinbase Warning Comes Too Late

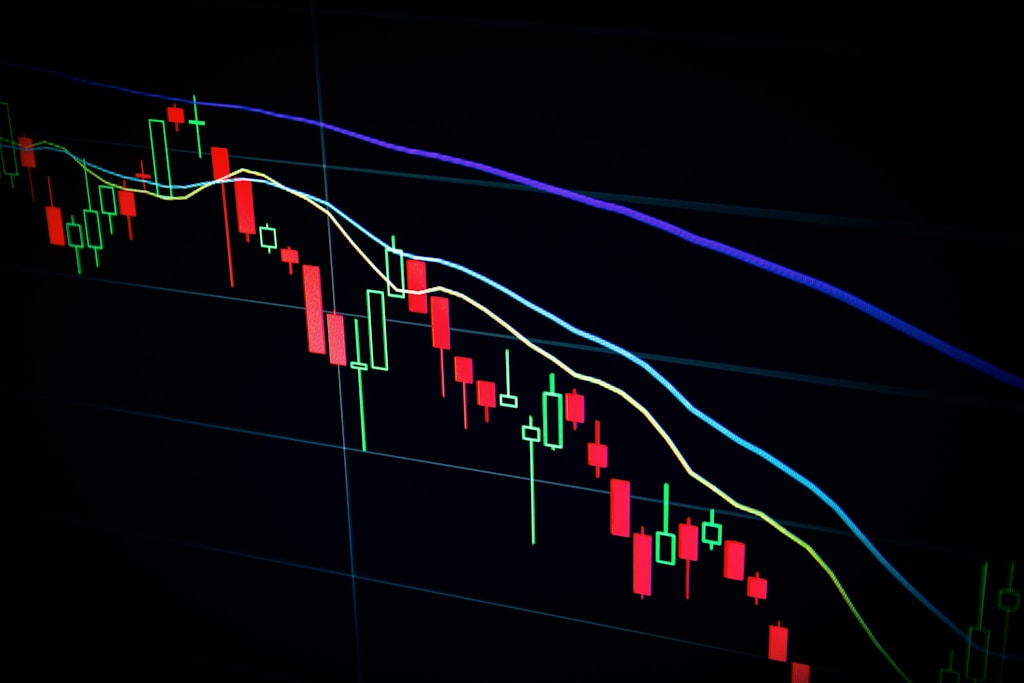
    A meme coin associated with Coinbase’s Base network has experienced a dramatic 92% crash, leaving traders with substantial losses despite explicit warnings about its unofficial status. This incident highlights the ongoing risks in the volatile meme coin sector and raises questions about cryptocurrency exchange responsibilities.

    Key Takeaways:

    • Unofficial Base network meme coin surges then crashes 92%
    • Token was explicitly labeled “not an investment”
    • Traders ignored warnings, leading to significant losses
    • Incident mirrors recent Bigcoin crash patterns

    The Rise and Fall of the Base Meme Token

    The unofficial Base token, despite being clearly labeled as a digital collectible with no investment value, attracted significant trader attention. The token’s price action followed a familiar pattern in the meme coin space: rapid appreciation followed by a devastating crash.

    SPONSORED

    Trade meme coins safely with advanced risk management tools

    Trade Now on Defx

    Market Impact and Warning Signs

    This incident bears striking similarities to other recent meme coin crashes, including warning signs observed in Dogecoin trading patterns. The rapid price movement and subsequent collapse demonstrate the continued speculative nature of meme token trading.

    Risk Management Lessons

    The Base token crash serves as a crucial reminder about the importance of due diligence in cryptocurrency investing, particularly with unofficial or unendorsed tokens.

    FAQ Section

    What was the Base token?

    An unofficial meme token created as a digital collectible associated with Coinbase’s Base network, explicitly labeled as not being an investment vehicle.

    Why did traders invest despite warnings?

    Speculative fever and FOMO (Fear of Missing Out) often drive traders to ignore explicit warnings in pursuit of quick profits.

    What are the lessons for crypto investors?

    Always verify token legitimacy, heed official warnings, and conduct thorough due diligence before investing in any cryptocurrency asset.

  • Shiba Inu vs Dogecoin: 79% of Experts Reject SHIB Flippening Potential

    Shiba Inu vs Dogecoin: 79% of Experts Reject SHIB Flippening Potential

    A comprehensive survey by Finders has revealed that an overwhelming 79% of financial experts believe Shiba Inu (SHIB) will never overtake Dogecoin (DOGE) in market capitalization, casting doubt on the popular meme coin’s long-term potential. This analysis comes at a crucial time for both cryptocurrencies, with Dogecoin’s long positions reaching 72% on Binance, suggesting increased market speculation.

    Expert Survey Reveals Skepticism About SHIB’s Future

    The survey, which gathered insights from 14 prominent finance experts, paints a clear picture of market sentiment. Only 7% of respondents expressed confidence in SHIB’s ability to surpass DOGE, with these optimists projecting a potential flip by 2026. The remaining 14% maintained an uncertain stance on the matter.

    SPONSORED

    Trade meme coins with up to 100x leverage and maximize your potential returns

    Trade Now on Defx

    Supply Dynamics: The Core Challenge

    Dr. Sathvik Vishwanath, Unnocoin’s jurisdictional head, highlights the fundamental supply disparity between the two tokens. SHIB’s massive circulating supply of 589.25 trillion tokens dwarfs DOGE’s 148.82 billion, creating a significant barrier to market cap dominance despite Shiba Inu’s strong tokenomics and community backing.

    Market Cap Analysis: The 240% Challenge

    Currently, Dogecoin maintains its position as the 8th largest cryptocurrency with a $24.60 billion market cap, while Shiba Inu sits at 17th place with $7.3 billion. For SHIB to achieve a flippening, it would need a remarkable 240% increase in value, assuming DOGE’s price remains stable.

    Recent Whale Activity Signals Potential Shift

    Despite expert skepticism, recent on-chain data shows increasing whale interest in SHIB. IntoTheBlock reports a surge in daily trading volume to 224 billion tokens, with large holder inflows more than doubling from 96 billion to 224 billion SHIB between April 13-14.

    Historical Context: The 2021 Temporary Flippening

    This isn’t uncharted territory for these meme coins. In 2021, SHIB briefly surpassed DOGE with a $39 billion market cap, though this victory proved temporary as Dogecoin quickly reclaimed its position as the leading meme cryptocurrency.

    FAQ Section

    Can Shiba Inu realistically overtake Dogecoin?

    While technically possible, experts suggest it’s highly unlikely due to the massive supply disparity and current market dynamics.

    What factors could enable a SHIB flippening?

    A combination of significant token burns, increased institutional adoption, and enhanced utility could potentially create conditions for a flippening scenario.

    How does whale activity impact SHIB’s price?

    Large whale movements often precede significant price action, with recent increased activity potentially signaling growing institutional interest.

  • PEPE Price Analysis: Technical Patterns Signal 796% Rally Potential

    PEPE Price Analysis: Technical Patterns Signal 796% Rally Potential

    The PEPE token has entered a critical accumulation phase, with technical analysis suggesting a potential 796% price surge by 2025. As the broader crypto market experiences sideways movement, similar to what we’ve seen with Dogecoin’s recent technical patterns indicating a 400% rally potential, PEPE’s chart structure is forming a compelling bullish case.

    Technical Analysis Reveals Bullish Pattern Formation

    The meme coin’s price action has been relatively subdued recently, experiencing consistent selloffs amid market volatility. However, crypto analyst MasterAnanda has identified a promising technical formation that mirrors PEPE’s previous rally to its all-time high of $0.00002803.

    Historical Price Pattern Comparison

    The current technical setup shows remarkable similarities to PEPE’s 2024 performance, where the token:

    • Traded in a descending channel (May-September 2024)
    • Broke out of the channel structure
    • Formed a lower low before significant upward movement
    • Rallied to peak levels in December 2024

    SPONSORED

    Trade meme coins like PEPE with up to 100x leverage on perpetual contracts

    Trade Now on Defx

    Key Support Levels and Accumulation Zones

    The analysis highlights several critical technical factors:

    • Formation of a short-term higher low
    • Strong support level consolidation
    • Potential for one final shakeout before upward momentum
    • Clear reversal structure on daily timeframes

    Fibonacci Extension Targets

    The technical analysis identifies two major price targets based on Fibonacci extensions:

    • 1.618 Fibonacci level: 480% potential upside ($0.0004264)
    • 2.618 Fibonacci level: 796% potential upside

    Risk Management Considerations

    While the technical outlook appears promising, traders should consider:

    • Potential short-term weakness and volatility
    • The importance of proper position sizing
    • Different strategies for spot vs. leveraged trading
    • Current price level: $0.00000708 (down 4.7% in 24 hours)

    Frequently Asked Questions

    What is the current PEPE price prediction for 2025?

    Technical analysis suggests a potential 796% rally, with price targets reaching $0.0004264 based on Fibonacci extension levels.

    What are the key support levels for PEPE?

    The token has established strong support at the current higher low formation, with additional technical support at previous consolidation levels.

    Is PEPE a good investment in 2025?

    While technical indicators suggest significant upside potential, investors should conduct thorough research and consider the high-risk nature of meme coins.

  • TRUMP Token Team Withdraws $4.6M Before $309M Unlock Event

    In a significant development that has raised concerns in the crypto community, the team behind the TRUMP meme coin has withdrawn $4.6 million worth of USDC from their liquidity pool, just hours before a scheduled $309 million token unlock event.

    Key Takeaways:

    • $4.6 million USDC withdrawn from liquidity pool
    • Major token unlock worth $309M scheduled for Thursday
    • Timing raises concerns about potential market impact

    Analysis of the Withdrawal

    The withdrawal comes at a particularly sensitive time, as market manipulation concerns continue to plague the crypto sector. The substantial removal of liquidity just before a major token unlock event has sparked discussions about potential market implications and investor protection.

    Token Unlock Details

    The upcoming token unlock, valued at approximately $309 million, represents a significant portion of the TRUMP token’s total supply. Such events typically lead to increased market volatility as newly unlocked tokens become available for trading.

    SPONSORED

    Trade meme coins with up to 100x leverage and protect yourself from market volatility

    Trade Now on Defx

    Market Impact Assessment

    The withdrawal of liquidity could potentially impact:

    • Token price stability
    • Trading volume
    • Market confidence

    FAQ Section

    What does this mean for TRUMP token holders?

    Token holders should monitor market conditions closely as reduced liquidity could lead to increased price volatility.

    How might this affect the token unlock event?

    The reduced liquidity could amplify price movements during the unlock period.

    What are the potential risks?

    Investors face increased slippage risk and potential difficulty executing trades due to reduced liquidity.

  • Dogecoin Price Signals Recovery: Technical Analysis Points to 400% Rally Potential

    Dogecoin Price Signals Recovery: Technical Analysis Points to 400% Rally Potential

    The cryptocurrency market has been closely watching Dogecoin (DOGE) as the popular meme coin shows signs of a potential trend reversal after falling below $0.16. Despite losing over 50% of its value since December 2024, technical analysis suggests the pullback may be reaching its conclusion, setting the stage for a significant recovery. Recent data showing 72% long positions on Binance adds another layer of intrigue to this developing situation.

    Technical Indicators Signal Potential Breakout

    Crypto analyst Trader Tardigrade has identified striking similarities between current market conditions and those preceding Dogecoin’s 400% rally in late 2024. Two key technical indicators stand out:

    • MACD Consolidation: Following January’s market downturn, DOGE has entered a consolidation phase remarkably similar to the pattern observed before the November 2024 surge
    • RSI Divergence: The current RSI pattern mirrors the October 2024 setup, showing a sharp dip followed by quick recovery – a historically bullish signal

    Price Targets and Market Implications

    If historical patterns repeat, Dogecoin could be positioning for another 400% rally, potentially pushing prices toward the following targets:

    Price Target Percentage Increase Historical Significance
    $0.50 ~200% Previous rally peak (2024)
    $0.73 ~400% All-time high

    SPONSORED

    Trade DOGE with up to 100x leverage and maximize your profit potential

    Trade Now on Defx

    Market Risks and External Factors

    Several factors could impact Dogecoin’s potential recovery:

    • Macroeconomic conditions
    • Trump’s tariff policies (currently on 3-month pause)
    • Overall crypto market sentiment
    • Meme coin sector dynamics

    Frequently Asked Questions

    What caused Dogecoin’s recent price decline?

    The decline began in December 2024 after reaching a local peak, with broader market conditions and reduced trading volume contributing to the 50% value loss.

    What technical indicators suggest a potential recovery?

    MACD consolidation patterns and RSI divergence similar to those seen before the 2024 rally indicate a possible trend reversal.

    How high could Dogecoin price go in this recovery?

    Based on historical patterns, a 400% rally could push DOGE toward its all-time high of $0.73, though market conditions will ultimately determine the extent of any recovery.

  • Dogecoin Price Target $2.10: Wyckoff Pattern Signals Major Rally Ahead

    Dogecoin (DOGE) appears poised for a significant price surge as multiple technical indicators align with the Wyckoff Accumulation pattern, suggesting an imminent rally that could push the leading meme coin to new all-time highs. Recent analysis predicting a 300% DOGE rally gains further credibility with this development.

    Wyckoff Pattern Points to $2.10 Target

    Renowned crypto analyst Trader Tardigrade has identified that DOGE is entering the crucial Phase E of the Wyckoff Accumulation pattern after completing several key technical milestones:

    • Last Point of Support (LPS) at $0.174
    • Sign of Strength (SOS) level at $0.18
    • Successful completion of Phase C TEST
    • Confirmation of Phase D support levels

    Multiple Technical Patterns Confirm Bullish Outlook

    Supporting the Wyckoff analysis, several other technical formations have emerged:

    • Inverse Head and Shoulders pattern on the 4-hour timeframe
    • Potential rally to $0.183 as immediate target
    • Higher timeframe support maintaining strong price structure

    SPONSORED

    Trade DOGE with up to 100x leverage and maximize your profit potential

    Trade Now on Defx

    Key Price Levels to Watch

    Traders should monitor these critical price points:

    • Current support: $0.13
    • Immediate resistance: $0.17
    • Secondary target: $0.21
    • Maximum projection: $0.29

    Market Factors Influencing DOGE’s Trajectory

    Several market dynamics could impact Dogecoin’s price movement:

    • Whale activity currently showing neutral positioning
    • Bitcoin price correlation remains strong
    • Key $89,000 BTC level identified as catalyst

    FAQ

    What is the Wyckoff Accumulation Pattern?

    The Wyckoff Accumulation Pattern is a technical analysis framework that identifies market cycles through phases A through E, helping predict potential price reversals and continuations.

    What could prevent DOGE from reaching $2.10?

    Key risks include Bitcoin market volatility, whale selling pressure, and failure to maintain support at $0.13.

    When might DOGE reach the projected target?

    While exact timing is uncertain, the completion of Phase E typically occurs within 3-6 months of entering Phase D.

    At time of writing, DOGE trades at $0.16, showing a 3% decline over 24 hours. Traders should maintain strict risk management while monitoring key support and resistance levels.

  • Dogecoin Whales Accumulate 800M DOGE: Key $0.17 Level in Focus

    Dogecoin Whales Accumulate 800M DOGE: Key $0.17 Level in Focus

    Recent on-chain data reveals massive Dogecoin (DOGE) accumulation by whale addresses, with over 800 million DOGE purchased in just 48 hours. This significant buying pressure comes as the popular meme cryptocurrency tests crucial technical levels, suggesting potential for a broader market recovery.

    The meme-inspired cryptocurrency has maintained support above $0.15, with bulls now targeting the critical $0.17 resistance level. This price action coincides with recent technical analysis showing DOGE facing a crucial test at $0.1620, making the current whale accumulation particularly noteworthy.

    Whale Activity Signals Potential Trend Reversal

    According to data from Santiment, large DOGE holders have been actively accumulating positions, with whale addresses adding approximately 800 million DOGE to their holdings since Sunday. This level of institutional buying typically precedes significant price movements, as witnessed in previous rally phases.

    SPONSORED

    Trade DOGE with up to 100x leverage on perpetual contracts

    Trade Now on Defx

    Technical Analysis: Key Levels to Watch

    DOGE currently trades at $0.16, facing immediate resistance at the 200-period moving average near $0.168. A successful break above this level could trigger a rally toward $0.20, while support remains firm at $0.15. The recent whale accumulation adds credibility to the bullish case, though traders should monitor volume for confirmation.

    Market Implications and Outlook

    While the substantial whale buying activity presents a bullish case, several factors warrant careful consideration:

    • Immediate resistance at $0.17-0.18 zone needs to be cleared
    • Global market conditions remain uncertain
    • Historical precedent suggests whale accumulation often precedes major moves

    As analysts project potential significant gains for Dogecoin in April 2025, the current accumulation phase could be positioning for this anticipated move. However, traders should maintain strict risk management given the volatile nature of meme cryptocurrencies.

    FAQ Section

    What does whale accumulation mean for DOGE price?

    Historically, large-scale whale accumulation often precedes significant price movements, though it’s not a guaranteed indicator of direction.

    What are the key resistance levels for Dogecoin?

    Current key resistance levels are $0.168 (200 MA), $0.17, and $0.20, with support at $0.15 and $0.13.

    How significant is the 800M DOGE accumulation?

    This represents one of the largest 48-hour accumulation periods in 2025, suggesting strong institutional confidence in DOGE’s short-term potential.

  • Bitcoin Whale Moves $84M Off Exchange: 3 Meme Coins Set to Rally

    Bitcoin Whale Moves $84M Off Exchange: 3 Meme Coins Set to Rally

    A major Bitcoin whale just withdrew 1,000 BTC (worth $84M) from a leading crypto exchange, potentially signaling an imminent price surge. This follows a broader trend of whale confidence, with exchange inflows dropping 42% recently.

    Why This Whale Movement Matters

    When large holders move Bitcoin off exchanges, it typically indicates a long-term holding strategy rather than selling pressure. This particular movement coincides with technical analysis suggesting Bitcoin could target $90,000 in the near term.

    SPONSORED

    Trade Bitcoin with up to 100x leverage and maximize your potential returns

    Trade Now on Defx

    3 Meme Coins Positioned for Growth

    1. BTC Bull Token ($BTCBULL)

    Currently priced at $0.00246, $BTCBULL has raised $4.6M in its presale. The token features innovative burn mechanisms tied to Bitcoin price milestones, with burns scheduled at $125K, $175K, and $225K BTC price points.

    2. MIND of Pepe ($MIND)

    With $8M raised in presale and trading at $0.0037115, this AI-powered meme coin offers unique features including market analysis and trend prediction capabilities through its autonomous AI agent.

    3. Dawgz AI ($DAGZ)

    Trading at $0.004 with $3.2M raised, $DAGZ combines meme appeal with AI-driven trading algorithms, positioning it well for the anticipated market upswing.

    Market Impact Analysis

    Historical data shows that significant whale movements often precede major market rallies. With Bitcoin showing strength and meme coins typically amplifying BTC gains, these projects could see substantial growth in the coming weeks.

    FAQs

    • What does it mean when whales move Bitcoin off exchanges?
      It typically indicates a long-term holding strategy and reduced selling pressure.
    • How do meme coins perform during Bitcoin rallies?
      Meme coins often experience amplified gains during Bitcoin uptrends, sometimes outperforming BTC itself.
    • Why are AI-powered meme coins gaining traction?
      They combine the viral nature of memes with practical utility through AI technology.
  • Dogecoin Price Alert: Top Analyst Predicts 300% Rally for April 2025

    Dogecoin Price Alert: Top Analyst Predicts 300% Rally for April 2025

    The cryptocurrency market is buzzing with anticipation as a prominent analyst who accurately predicted Dogecoin’s previous surge has forecast another explosive rally for April 2025. This prediction gains credibility from the analyst’s track record and comes amid increasing technical indicators supporting a potential breakout.

    Historical Accuracy Builds Credibility

    World of Charts, a crypto analyst with over 30,000 followers, has established credibility in the Dogecoin community after successfully predicting the meme coin’s trajectory in 2024. During September 2024, when DOGE was struggling below $0.1, the analyst identified a falling wedge pattern that ultimately led to a significant price surge. This aligns with broader market analysis showing Dogecoin’s potential for major moves in 2025.

    SPONSORED

    Trade Dogecoin with up to 100x leverage on perpetual contracts

    Trade Now on Defx

    Technical Analysis Supports Bullish Outlook

    The current technical setup mirrors the conditions that preceded the previous rally, with DOGE currently trading at $0.17. The analyst’s target of a 300% increase would push the price toward the $0.50 mark, a level previously achieved in November 2024.

    Multiple Analysts Confirm Bullish Scenario

    Supporting this bullish outlook, analyst Jonathan Carter has outlined a series of price targets, starting at $0.18 and extending to $0.34. This multi-phase approach provides traders with clear entry and exit points for potential trades.

    Key Price Targets for Dogecoin

    • Initial resistance: $0.18
    • Secondary target: $0.23
    • Major resistance: $0.29
    • Ultimate target: $0.34

    FAQ Section

    What is driving the potential Dogecoin rally?

    Technical analysis shows a falling wedge pattern similar to the one that preceded the 2024 rally, combined with increasing market liquidity and positive sentiment.

    When is the breakout expected to occur?

    Analysts suggest the breakout could begin in April 2025, with the rally potentially extending through Q2 2025.

    What are the key risk factors to consider?

    Investors should monitor overall market conditions, regulatory developments, and potential resistance levels that could impact the predicted price movement.

    Disclaimer: This article is not financial advice. Always conduct your own research and consider your risk tolerance before trading.

  • Dogecoin Price Faces Critical $0.1620 Test as Bears Take Control

    Dogecoin Price Faces Critical $0.1620 Test as Bears Take Control

    Dogecoin (DOGE) is showing signs of weakness as the popular meme coin faces increasing selling pressure below the crucial $0.1700 level. Technical analysis reveals a concerning pattern that could signal further downside for DOGE holders in the coming days.

    Key Technical Levels Signal Bearish Momentum

    The latest price action shows DOGE/USD struggling to maintain support after a sharp decline from recent highs. Key technical indicators paint a bearish picture:

    • Price trading below both $0.1620 and the 100-hour moving average
    • Formation of a bearish trend line with resistance at $0.1620
    • RSI dropping below the crucial 50 level
    • MACD gaining bearish momentum in the negative zone

    This technical setup comes at a particularly challenging time for Dogecoin, as the broader crypto market shows mixed signals. While some analysts maintain long-term bullish targets for DOGE, the immediate outlook suggests caution.

    Critical Support and Resistance Levels

    Traders should watch these key price levels:

    Type Price Level Significance
    Major Resistance $0.1665 Break above could trigger rally to $0.1700
    Immediate Support $0.1575 Critical level for maintaining short-term stability

    SPONSORED

    Trade meme coins with up to 100x leverage on perpetual contracts

    Trade Now on Defx

    Market Outlook and Trading Implications

    The immediate outlook suggests traders should prepare for potential further downside. If DOGE fails to reclaim $0.1620, the following scenarios become likely:

    • Initial drop to $0.1540 support level
    • Possible extension to $0.1500 psychological support
    • In worst case, decline toward $0.1420 or $0.1350

    FAQ: Key Questions About DOGE’s Current Position

    Q: What’s causing Dogecoin’s current decline?
    A: Technical factors including the breach of key support levels and bearish momentum indicators are primary drivers.

    Q: What would signal a potential reversal?
    A: A decisive break above $0.1665 with increased volume would suggest bullish momentum returning.

    Q: How does this affect long-term DOGE holders?
    A: While short-term volatility presents challenges, long-term holders should focus on major support levels at $0.1500 and below.

    Technical Indicators Summary

    • MACD: Bearish momentum increasing
    • RSI: Below 50, indicating bearish control
    • Moving Averages: Trading below 100-hour SMA
    • Volume: Declining during recent price action