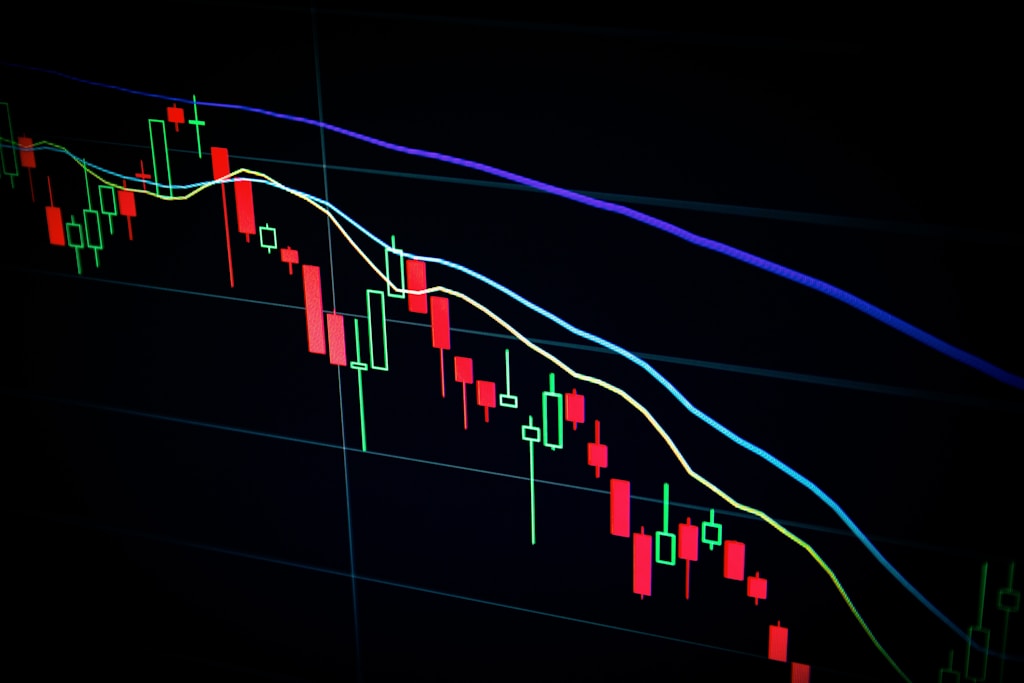
Tag: Mvrv Ratio

  • Bitcoin MVRV Ratio Hits 6-Month Low: Warning Signs for BTC Rally?

    Bitcoin MVRV Ratio Hits 6-Month Low: Warning Signs for BTC Rally?

    Bitcoin’s market health indicators are flashing warning signs as the flagship cryptocurrency’s 30-day Market Value to Realized Value (MVRV) ratio plummets to six-month lows, potentially signaling an extended correction phase ahead. This development comes as BTC tests critical resistance levels around $84,500.

    Bitcoin’s MVRV Ratio Signals Market Weakness

    After briefly touching $86,000, Bitcoin has retreated below $84,000, with on-chain metrics suggesting growing pressure on short-term holders. CryptoQuant analyst Gaah reports that the 30-day MVRV ratio has declined to levels not seen since October 2023, indicating potential market exhaustion.

    SPONSORED

    Trade Bitcoin with up to 100x leverage and maximize your profit potential

    Trade Now on Defx

    Key Market Metrics and Analysis

    The MVRV indicator has entered the bottom of its neutrality band (1.8-2.1), historically a zone that precedes significant price movements. This technical pattern mirrors the market behavior observed during Bitcoin’s previous correction to $50,000, where similar MVRV levels preceded a strong recovery.

    Short-term Holder Dynamics

    Market expert Darkfost’s analysis reveals that short-term holders face an average 10% unrealized loss, with their realized price at $92,800. This key psychological level must be reclaimed to confirm the continuation of the broader uptrend.

    Technical Outlook and Price Implications

    The current MVRV reading of 1.32 suggests short-term holders maintain a 32% average unrealized profit, despite recent market weakness. This metric hasn’t breached its upper bounds since April 2021, when it marked previous cycle tops.

    FAQ Section

    What does the MVRV ratio indicate?

    The MVRV ratio measures the relationship between Bitcoin’s market value and realized value, helping identify whether the price is overvalued or undervalued relative to fair value.

    Why is the current MVRV decline significant?

    The decline to six-month lows suggests growing market weakness and potential for further price corrections, though historical patterns indicate this could also present buying opportunities.

    What levels should traders watch?

    Key levels include the $83,000 support and $92,800 resistance (short-term holder realized price), with the latter being crucial for confirming trend continuation.

  • Bitcoin MVRV Dominance Hits 812-Day Record Over Ethereum

    Bitcoin MVRV Dominance Hits 812-Day Record Over Ethereum

    Bitcoin’s market dominance over Ethereum has reached a significant milestone, with its Market Value to Realized Value (MVRV) ratio maintaining superiority for an unprecedented 812 consecutive days. This technical achievement comes as Bitcoin continues to show resilience around the $80,000 level despite recent market uncertainty.

    Record-Breaking Capital Inflows Highlight Bitcoin’s Strength

    According to the latest Glassnode report, Bitcoin has attracted a massive $468 billion in realized capital since November 2022’s bear market bottom, dwarfing Ethereum’s modest $61 billion inflow during the same period. This stark contrast in investor interest provides crucial insight into the diverging performance of these leading cryptocurrencies.

    SPONSORED

    Trade Bitcoin with up to 100x leverage and maximize your profit potential

    Trade Now on Defx

    Understanding MVRV Ratio Implications

    The MVRV ratio, a key metric comparing market capitalization to realized capitalization, reveals that Bitcoin investors have maintained higher unrealized profits throughout this cycle. While BTC holders remain in profit territory, ETH investors have slipped underwater as the indicator dropped below 1.

    Key Market Statistics

    • Bitcoin Realized Cap Growth: $468 billion
    • Ethereum Realized Cap Growth: $61 billion
    • MVRV Dominance Streak: 812 days
    • Current Bitcoin Price: $79,300 (-3% weekly)

    Expert Analysis

    Market analysts suggest this prolonged MVRV dominance indicates a fundamental shift in investor preference toward Bitcoin, particularly as Ethereum faces critical support levels. The disparity in capital inflows reflects stronger institutional confidence in Bitcoin’s value proposition.

    Frequently Asked Questions

    What does the MVRV ratio indicate?

    The MVRV ratio compares an asset’s market value to its realized value, helping investors understand whether the cryptocurrency is overvalued or undervalued relative to its fair value.

    Why is Bitcoin outperforming Ethereum?

    Bitcoin’s outperformance can be attributed to stronger institutional adoption, clearer regulatory framework, and greater success in attracting new capital during the current market cycle.

    What does this mean for investors?

    The extended MVRV dominance suggests Bitcoin remains the preferred store of value in the cryptocurrency market, though past performance doesn’t guarantee future results.

  • Ethereum MVRV Ratio Hits 15-Month Low: Bottom Signal Emerges

    Ethereum MVRV Ratio Hits 15-Month Low: Bottom Signal Emerges

    The Ethereum market is showing potential bottom signals as a key on-chain metric reaches levels not seen since December 2022. Data from analytics firm IntoTheBlock reveals the Market Value to Realized Value (MVRV) ratio has plunged to 0.87, suggesting significant oversold conditions that historically precede price recoveries.

    As selling pressure on major exchanges like Binance shows signs of easing, this MVRV reading gains additional significance for potential trend reversal signals.

    Understanding the MVRV Ratio Bottom Signal

    The MVRV ratio compares Ethereum’s current market value against its realized value, effectively measuring whether investors are in profit or loss. When this metric falls below 1.0, it indicates that the average holder is underwater on their position. The current reading of 0.87 reveals:

    • Average ETH holder is facing a 13% unrealized loss
    • Lowest MVRV level since the 2022 bear market bottom
    • Historical precedent for price reversals at similar levels

    Technical Analysis and Market Structure

    The recent 12% price crash to $1,550 has created several technical developments worth noting:

    Price Level Technical Significance
    $1,550 Current support level being tested
    $1,620 Key resistance to reclaim for bullish momentum
    $1,480 Next major support if current level fails

    SPONSORED

    Trade ETH with up to 100x leverage and maximize your profit potential

    Trade Now on Defx

    Why This MVRV Bottom Could Be Different

    Historical data shows that MVRV bottoms typically coincide with reduced selling pressure, as underwater holders become less likely to exit positions at a loss. Key factors supporting a potential reversal include:

    • Diminishing profit-taking selling pressure
    • Reduced leverage in the system
    • Growing institutional interest in ETH staking

    Frequently Asked Questions

    What does an MVRV ratio below 1 mean?

    An MVRV ratio below 1 indicates that the current market value is below the realized value, meaning the average investor is holding at a loss.

    How reliable is the MVRV ratio as a bottom indicator?

    Historically, extreme low MVRV readings have coincided with market bottoms, though timing the exact bottom remains challenging.

    What could prevent an ETH price recovery?

    Broader market conditions, regulatory developments, or technical vulnerabilities could delay or prevent a price recovery despite favorable MVRV readings.

    Looking Ahead: Key Levels to Watch

    While the MVRV ratio suggests a potential bottom formation, traders should monitor these critical levels:

    • $1,550: Immediate support level
    • $1,620: First major resistance
    • MVRV ratio: Watch for movement above 1.0

    The coming weeks will be crucial in determining whether this historical bottom signal translates into a sustained price recovery for Ethereum.

  • XRP MVRV Ratio Breaks Below 200MA – Critical $2 Support Test Looms

    XRP MVRV Ratio Breaks Below 200MA – Critical $2 Support Test Looms

    XRP faces a pivotal moment as its Market Value to Realized Value (MVRV) ratio dips below the 200-day moving average, signaling a potential trend shift while the token tests critical $2 support levels. This technical development comes amid broader market uncertainty that has seen XRP shed over 40% from recent highs.

    The cryptocurrency has shown remarkable resilience compared to its peers, outperforming many major altcoins which have declined by over 60% in the same period. However, as recession risks loom according to Goldman Sachs’ latest warning, XRP’s ability to hold key support levels remains crucial.

    MVRV Ratio Signals Potential Trend Shift

    On-chain analytics platform Santiment revealed that XRP’s MVRV ratio has broken below its 200-day moving average – a historically significant indicator that often precedes major directional moves. This technical event has caught the attention of traders and analysts, as previous instances have marked important trend reversals.

    SPONSORED

    Trade XRP with up to 100x leverage on perpetual contracts

    Trade Now on Defx

    Critical Support at $2 Under Pressure

    XRP currently trades at $2.13, having declined 21% since March 19. The psychological $2 support level has become increasingly important as bears attempt to push prices lower. Technical analysts suggest that a decisive break below this level could trigger an accelerated selloff.

    Market Outlook and Key Levels

    For bulls to regain control, XRP needs to:

    • Defend the crucial $2 support zone
    • Reclaim $2.40 resistance
    • Show increased buying volume
    • Break above the 200-day MA

    FAQ: XRP MVRV Analysis

    What is the MVRV ratio?
    The MVRV ratio compares an asset’s market value to its realized value, helping identify overbought or oversold conditions.

    Why is the 200-day MA significant?
    The 200-day moving average is a key technical indicator that helps determine long-term trend direction and potential support/resistance levels.

    What could trigger an XRP recovery?
    A combination of improved market sentiment, successful defense of $2 support, and increased institutional buying could spark a recovery.

    The coming days will be critical for XRP as traders closely monitor these technical developments and support levels. Whether bulls can defend current prices or bears take control will likely determine the medium-term trajectory for this major altcoin.

  • Bitcoin MVRV Signal Flashes Buy Zone as BTC Tests $82K Support

    Bitcoin MVRV Signal Flashes Buy Zone as BTC Tests $82K Support

    Bitcoin’s price action has turned bearish as the leading cryptocurrency struggles to maintain support at $82,000, with key technical indicators suggesting a potential buying opportunity may be approaching. Recent market volatility has intensified fear among investors, but on-chain metrics paint a more nuanced picture.

    Bitcoin Price Under Pressure as Bears Target $80K

    After briefly touching $87,000 earlier this week, Bitcoin has faced intense selling pressure, with bears now eyeing a move below the critical $80,000 support level. The failure to reclaim the key $90,000 resistance has shifted momentum sharply in favor of sellers, dragging BTC into deeper uncertainty amid broader macroeconomic concerns.

    MVRV Ratio Approaches Historical Accumulation Zone

    Despite the current market weakness, renowned analyst Ali Martinez has identified a potentially significant buying signal emerging from Bitcoin’s Market Value to Realized Value (MVRV) Ratio. According to Martinez, the next prime accumulation zone could materialize when the MVRV crosses above its 70-day moving average – a pattern that has historically marked attractive entry points for long-term investors.

    SPONSORED

    Trade Bitcoin with up to 100x leverage on perpetual contracts

    Trade Now on Defx

    Technical Analysis: Key Support and Resistance Levels

    Bitcoin is currently testing crucial support at $82,000, with several technical indicators suggesting oversold conditions. The 4-hour chart shows BTC trading below both the 200 MA and EMA, clustered in the $87K-$85K range. These moving averages have historically provided dynamic support during uptrends, making their reclamation essential for any sustained recovery.

    Market Outlook and Trading Implications

    For bulls to regain control, Bitcoin needs to decisively break above $85,000 and reclaim the key moving averages as support. A failure to hold the $82,000 level could trigger a deeper correction toward sub-$80K prices, potentially offering the accumulation opportunity signaled by the MVRV metric.

    FAQ Section

    What is the Bitcoin MVRV Ratio?

    The MVRV Ratio compares Bitcoin’s market value to its realized value, helping identify periods of overvaluation or undervaluation. When the ratio crosses above its moving average after a decline, it often signals potential buying opportunities.

    What are the key support levels to watch?

    Current critical support levels include $82,000 and $80,000. Below these, the next major support zones lie at $77,000 and $75,000.

    When might the next bull run begin?

    While timing market bottoms is challenging, the MVRV indicator suggests an accumulation phase could begin once the ratio crosses above its 70-day moving average, potentially marking the start of the next upward cycle.

  • Ethereum MVRV Hits 0.9: Historic Bottom Signal Alert

    Ethereum MVRV Hits 0.9: Historic Bottom Signal Alert

    Key Takeaways

    • Ethereum’s MVRV ratio has dropped to 0.9, a historically significant level
    • Strong on-chain support identified between $1,843-$1,900
    • 3.56 million ETH accumulated by 4.64 million addresses in support zone

    Ethereum’s Market Value to Realized Value (MVRV) ratio has declined to 0.9, entering a zone that has historically signaled potential market bottoms. This development aligns with recent analysis showing Ethereum testing critical support levels, potentially setting up for a significant recovery.

    Understanding MVRV and Current Market Conditions

    The MVRV ratio is a crucial on-chain metric that compares Ethereum’s market capitalization to its realized value. When this ratio falls below 1, it indicates that the average holder is underwater on their investment. Currently, at 0.9, the metric suggests we’re in a historically significant accumulation zone.

    According to data from IntoTheBlock, this level has rarely been reached outside of bear market conditions, making it a potentially significant indicator for investors. Historical analysis shows that such levels have often preceded substantial price recoveries, though timing remains uncertain.

    Technical Support Analysis

    A critical support zone has emerged between $1,843 and $1,900, backed by significant on-chain data:

    • Accumulation Volume: 3.56 million ETH
    • Active Addresses: 4.64 million
    • Current Price: $1,877

    This concentration of buying activity suggests strong technical support, though a breach below could trigger further selling pressure.

    SPONSORED

    Trade Ethereum with up to 100x leverage and maximize your potential returns

    Trade Now on Defx

    Market Implications

    While the MVRV ratio suggests a potential bottom formation, investors should note that historical patterns indicate a period of consolidation may be necessary before any significant upward movement. The presence of strong support at current levels provides a potential foundation for recovery, but market participants should remain cautious of broader market conditions affecting crypto assets.

    Source: Bitcoinist

  • Bitcoin MVRV Shock: $130K Target Still in Play! 🚀

    Bitcoin MVRV Shock: $130K Target Still in Play! 🚀

    Market Analysis Shows Bitcoin Bull Run May Not Be Over

    Despite Bitcoin’s recent pullback below $80,000, on-chain data suggests the current bull cycle may still have significant upside potential. According to a detailed analysis from CryptoQuant, a key indicator points to possible price targets as high as $130,000.

    The analysis centers on the Market Value to Realized Value (MVRV) ratio, a crucial metric that has historically signaled market tops. While recent market turbulence has sparked concerns, the data reveals an intriguing possibility for further upside.

    Understanding the MVRV Indicator

    The MVRV ratio measures Bitcoin’s market capitalization against its realized capitalization, effectively gauging whether the cryptocurrency is overvalued or undervalued. Historical data shows that:

    • Previous bull cycles peaked when MVRV crossed 3.5
    • Current MVRV stands at only 2.7
    • A minimum reading of 3.0 is needed to confirm cycle top

    Key Support Levels and Price Targets

    While Bitcoin has experienced significant volatility, several critical support levels remain intact:

    • Primary Support: $65,000
    • Current Price: $85,000
    • Potential Peak: $120,000-$130,000

    SPONSORED

    Trade Bitcoin with up to 100x leverage on perpetual contracts

    Trade Now on Defx

    Expert Analysis and Market Implications

    CryptoQuant analyst Tarekonchain suggests that while the recent dip below the 365-day moving average is bearish, it may present a buying opportunity. The current market structure shares similarities with previous bull cycles that saw significant continuation after similar pullbacks.

    “The data suggests we’re not yet at the cycle top,” explains Tarekonchain. “Historical patterns indicate potential for a final surge before a true market peak is established.”

    Looking Ahead: Key Metrics to Watch

    Investors should monitor several indicators to validate this thesis:

    • MVRV ratio progression toward 3.0-3.5 range
    • Daily active addresses and transaction volume
    • Exchange inflow/outflow ratios
    • Long-term holder behavior

    Source: NewsbtC