Tag: Mvrv Ratio

  • XRP MVRV Ratio Breaks Below 200MA – Critical $2 Support Test Looms

    XRP MVRV Ratio Breaks Below 200MA – Critical $2 Support Test Looms

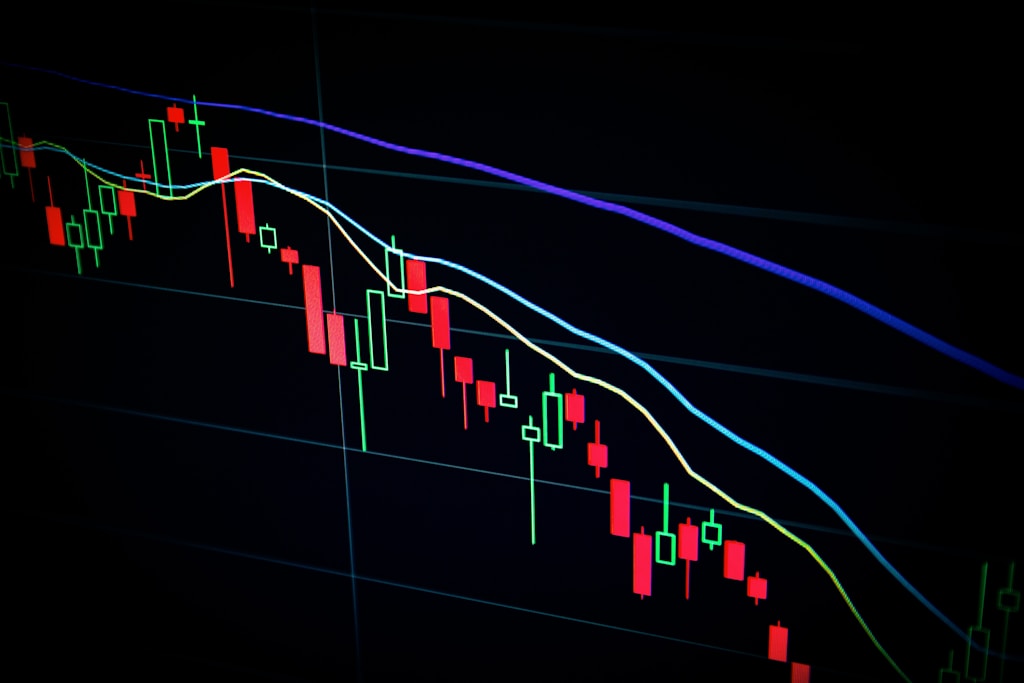
    XRP faces a pivotal moment as its Market Value to Realized Value (MVRV) ratio dips below the 200-day moving average, signaling a potential trend shift while the token tests critical $2 support levels. This technical development comes amid broader market uncertainty that has seen XRP shed over 40% from recent highs.

    The cryptocurrency has shown remarkable resilience compared to its peers, outperforming many major altcoins which have declined by over 60% in the same period. However, as recession risks loom according to Goldman Sachs’ latest warning, XRP’s ability to hold key support levels remains crucial.

    MVRV Ratio Signals Potential Trend Shift

    On-chain analytics platform Santiment revealed that XRP’s MVRV ratio has broken below its 200-day moving average – a historically significant indicator that often precedes major directional moves. This technical event has caught the attention of traders and analysts, as previous instances have marked important trend reversals.

    SPONSORED

    Trade XRP with up to 100x leverage on perpetual contracts

    Trade Now on Defx

    Critical Support at $2 Under Pressure

    XRP currently trades at $2.13, having declined 21% since March 19. The psychological $2 support level has become increasingly important as bears attempt to push prices lower. Technical analysts suggest that a decisive break below this level could trigger an accelerated selloff.

    Market Outlook and Key Levels

    For bulls to regain control, XRP needs to:

    • Defend the crucial $2 support zone
    • Reclaim $2.40 resistance
    • Show increased buying volume
    • Break above the 200-day MA

    FAQ: XRP MVRV Analysis

    What is the MVRV ratio?
    The MVRV ratio compares an asset’s market value to its realized value, helping identify overbought or oversold conditions.

    Why is the 200-day MA significant?
    The 200-day moving average is a key technical indicator that helps determine long-term trend direction and potential support/resistance levels.

    What could trigger an XRP recovery?
    A combination of improved market sentiment, successful defense of $2 support, and increased institutional buying could spark a recovery.

    The coming days will be critical for XRP as traders closely monitor these technical developments and support levels. Whether bulls can defend current prices or bears take control will likely determine the medium-term trajectory for this major altcoin.

  • Bitcoin MVRV Signal Flashes Buy Zone as BTC Tests $82K Support

    Bitcoin MVRV Signal Flashes Buy Zone as BTC Tests $82K Support

    Bitcoin’s price action has turned bearish as the leading cryptocurrency struggles to maintain support at $82,000, with key technical indicators suggesting a potential buying opportunity may be approaching. Recent market volatility has intensified fear among investors, but on-chain metrics paint a more nuanced picture.

    Bitcoin Price Under Pressure as Bears Target $80K

    After briefly touching $87,000 earlier this week, Bitcoin has faced intense selling pressure, with bears now eyeing a move below the critical $80,000 support level. The failure to reclaim the key $90,000 resistance has shifted momentum sharply in favor of sellers, dragging BTC into deeper uncertainty amid broader macroeconomic concerns.

    MVRV Ratio Approaches Historical Accumulation Zone

    Despite the current market weakness, renowned analyst Ali Martinez has identified a potentially significant buying signal emerging from Bitcoin’s Market Value to Realized Value (MVRV) Ratio. According to Martinez, the next prime accumulation zone could materialize when the MVRV crosses above its 70-day moving average – a pattern that has historically marked attractive entry points for long-term investors.

    SPONSORED

    Trade Bitcoin with up to 100x leverage on perpetual contracts

    Trade Now on Defx

    Technical Analysis: Key Support and Resistance Levels

    Bitcoin is currently testing crucial support at $82,000, with several technical indicators suggesting oversold conditions. The 4-hour chart shows BTC trading below both the 200 MA and EMA, clustered in the $87K-$85K range. These moving averages have historically provided dynamic support during uptrends, making their reclamation essential for any sustained recovery.

    Market Outlook and Trading Implications

    For bulls to regain control, Bitcoin needs to decisively break above $85,000 and reclaim the key moving averages as support. A failure to hold the $82,000 level could trigger a deeper correction toward sub-$80K prices, potentially offering the accumulation opportunity signaled by the MVRV metric.

    FAQ Section

    What is the Bitcoin MVRV Ratio?

    The MVRV Ratio compares Bitcoin’s market value to its realized value, helping identify periods of overvaluation or undervaluation. When the ratio crosses above its moving average after a decline, it often signals potential buying opportunities.

    What are the key support levels to watch?

    Current critical support levels include $82,000 and $80,000. Below these, the next major support zones lie at $77,000 and $75,000.

    When might the next bull run begin?

    While timing market bottoms is challenging, the MVRV indicator suggests an accumulation phase could begin once the ratio crosses above its 70-day moving average, potentially marking the start of the next upward cycle.

  • Ethereum MVRV Hits 0.9: Historic Bottom Signal Alert

    Ethereum MVRV Hits 0.9: Historic Bottom Signal Alert

    Key Takeaways

    • Ethereum’s MVRV ratio has dropped to 0.9, a historically significant level
    • Strong on-chain support identified between $1,843-$1,900
    • 3.56 million ETH accumulated by 4.64 million addresses in support zone

    Ethereum’s Market Value to Realized Value (MVRV) ratio has declined to 0.9, entering a zone that has historically signaled potential market bottoms. This development aligns with recent analysis showing Ethereum testing critical support levels, potentially setting up for a significant recovery.

    Understanding MVRV and Current Market Conditions

    The MVRV ratio is a crucial on-chain metric that compares Ethereum’s market capitalization to its realized value. When this ratio falls below 1, it indicates that the average holder is underwater on their investment. Currently, at 0.9, the metric suggests we’re in a historically significant accumulation zone.

    According to data from IntoTheBlock, this level has rarely been reached outside of bear market conditions, making it a potentially significant indicator for investors. Historical analysis shows that such levels have often preceded substantial price recoveries, though timing remains uncertain.

    Technical Support Analysis

    A critical support zone has emerged between $1,843 and $1,900, backed by significant on-chain data:

    • Accumulation Volume: 3.56 million ETH
    • Active Addresses: 4.64 million
    • Current Price: $1,877

    This concentration of buying activity suggests strong technical support, though a breach below could trigger further selling pressure.

    SPONSORED

    Trade Ethereum with up to 100x leverage and maximize your potential returns

    Trade Now on Defx

    Market Implications

    While the MVRV ratio suggests a potential bottom formation, investors should note that historical patterns indicate a period of consolidation may be necessary before any significant upward movement. The presence of strong support at current levels provides a potential foundation for recovery, but market participants should remain cautious of broader market conditions affecting crypto assets.

    Source: Bitcoinist

  • Bitcoin MVRV Shock: $130K Target Still in Play! 🚀

    Bitcoin MVRV Shock: $130K Target Still in Play! 🚀

    Market Analysis Shows Bitcoin Bull Run May Not Be Over

    Despite Bitcoin’s recent pullback below $80,000, on-chain data suggests the current bull cycle may still have significant upside potential. According to a detailed analysis from CryptoQuant, a key indicator points to possible price targets as high as $130,000.

    The analysis centers on the Market Value to Realized Value (MVRV) ratio, a crucial metric that has historically signaled market tops. While recent market turbulence has sparked concerns, the data reveals an intriguing possibility for further upside.

    Understanding the MVRV Indicator

    The MVRV ratio measures Bitcoin’s market capitalization against its realized capitalization, effectively gauging whether the cryptocurrency is overvalued or undervalued. Historical data shows that:

    • Previous bull cycles peaked when MVRV crossed 3.5
    • Current MVRV stands at only 2.7
    • A minimum reading of 3.0 is needed to confirm cycle top

    Key Support Levels and Price Targets

    While Bitcoin has experienced significant volatility, several critical support levels remain intact:

    • Primary Support: $65,000
    • Current Price: $85,000
    • Potential Peak: $120,000-$130,000

    SPONSORED

    Trade Bitcoin with up to 100x leverage on perpetual contracts

    Trade Now on Defx

    Expert Analysis and Market Implications

    CryptoQuant analyst Tarekonchain suggests that while the recent dip below the 365-day moving average is bearish, it may present a buying opportunity. The current market structure shares similarities with previous bull cycles that saw significant continuation after similar pullbacks.

    “The data suggests we’re not yet at the cycle top,” explains Tarekonchain. “Historical patterns indicate potential for a final surge before a true market peak is established.”

    Looking Ahead: Key Metrics to Watch

    Investors should monitor several indicators to validate this thesis:

    • MVRV ratio progression toward 3.0-3.5 range
    • Daily active addresses and transaction volume
    • Exchange inflow/outflow ratios
    • Long-term holder behavior

    Source: NewsbtC