XRP Bulls Eye $2.30: Critical Price Level Revealed! 📈
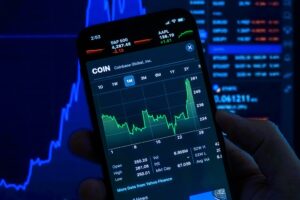
XRP's price action is heating up as bulls attempt to reclaim the crucial $2.30 level, with the digital asset currently...
XRP's price action is heating up as bulls attempt to reclaim the crucial $2.30 level, with the digital asset currently...
Market Alert: Bitcoin Miners Signal Bearish PressureIn a concerning development for Bitcoin holders, on-chain data reveals a significant spike in...
Market Analysis: Bitcoin's Recent Price ActionIn a dramatic turn of events, Bitcoin's price has experienced a significant correction, falling sharply...

Market Alert: Solana Breaks Critical Support Level In a shocking development that has sent ripples through the crypto market, Solana...
Bitcoin's price action has taken a dramatic turn as the flagship cryptocurrency plummeted to $76,624.25 overnight, marking a concerning 4-month...
Bitcoin Market Analysis: Price Slips Below Critical Support Bitcoin has entered a critical phase as its price dipped below the...

Market Alert: Bitcoin's Price Faces Severe Downward Pressure In a dramatic market development, Bitcoin (BTC) has broken below the crucial...

Market Analysis: Bitcoin's Critical Support LevelBitcoin stands at a crucial crossroads as market uncertainty intensifies amid political events and shifting...
Market Alert: Bitcoin Faces Severe Correction as Price Plummets from $92K Bitcoin's meteoric rise has hit a major roadblock as...
In a dramatic market development, Bitcoin (BTC) experienced a significant pullback, plunging to $80,000 and shedding an enormous $110 billion...


