Tag: Price Discovery

  • Bitcoin Price Hits Historic ATH on Pizza Day: Key Metrics Signal Strong Rally

    Bitcoin Price Hits Historic ATH on Pizza Day: Key Metrics Signal Strong Rally

    Time to Read: 8 minutes

    Bitcoin achieved a significant milestone last week, reaching a new all-time high (ATH) during the celebrated Bitcoin Pizza Day. While the crypto community erupted in celebration, underlying market metrics suggest this rally has strong fundamentals supporting continued upward momentum.

    Bitcoin’s Historic Price Discovery Phase

    The timing of this new ATH carries particular significance, coinciding with Bitcoin Pizza Day – a day that commemorates the first real-world Bitcoin transaction. This symbolic alignment between Bitcoin’s past and its current price discovery phase highlights how far the cryptocurrency has come in terms of adoption and value appreciation.

    Key Market Metrics Supporting the Rally

    • Funding rates remain healthy and sustainable
    • On-chain data shows strong accumulation patterns
    • Institutional inflows continue to increase
    • Market sentiment indicators suggest room for growth

    SPONSORED

    Trade Bitcoin with up to 100x leverage and maximize your profit potential

    Trade Now on Defx

    Market Analysis and Future Outlook

    While euphoria is evident in the market, technical analysts suggest that Bitcoin needs to maintain momentum above key support levels to continue its upward trajectory. The current price action represents more than just speculative interest – it reflects growing institutional adoption and improving market fundamentals.

    FAQ Section

    Q: What caused Bitcoin’s new all-time high?
    A: A combination of strong institutional buying, positive market sentiment, and historical significance of Bitcoin Pizza Day contributed to the price surge.

    Q: Is this rally sustainable?
    A: Key metrics including funding rates, institutional inflows, and on-chain data suggest strong fundamental support for continued price discovery.

    Q: What are the next key resistance levels?
    A: Technical analysts are watching several critical price points for potential resistance, with major focus on psychological barriers.
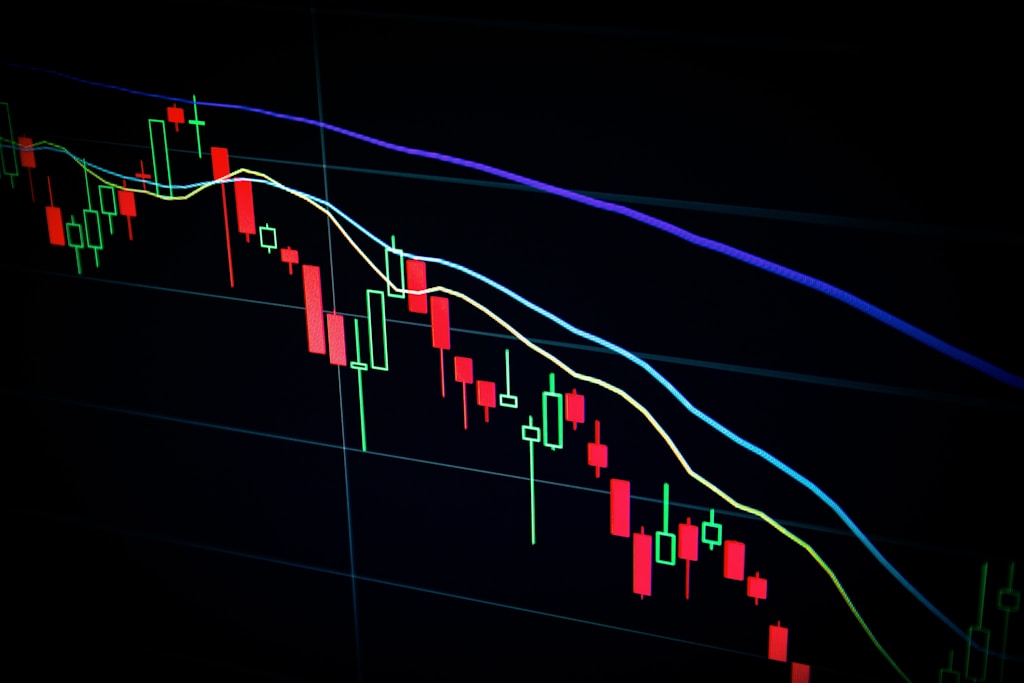
  • Bitcoin Whales Hold Strong at $112K ATH: Key On-Chain Metrics Signal Rally

    Bitcoin has entered uncharted territory, breaking through its previous all-time high of $109,000 to reach $112,000 amid surprisingly neutral whale activity. This historic price action comes as on-chain metrics suggest major holders are maintaining their positions rather than rushing to take profits.

    As Bitcoin’s spot CVD continues showing strong buy pressure, whale behavior patterns indicate potential for further upside, with exchange inflows remaining notably subdued compared to previous market tops.

    Whale Activity Analysis: A Bullish Signal?

    CryptoQuant data reveals a striking absence of aggressive selling from large holders, with the Whale to Exchange Flow metric showing relatively modest transfer volumes:

    • Current daily whale-to-exchange transfers: ~$300 million
    • Previous cycle tops: $1+ billion daily transfers
    • Exchange inflows: 70% below 2021 peak levels

    This restrained selling pressure suggests whales may be anticipating higher prices ahead, particularly as institutional demand continues surging through ETF inflows.

    SPONSORED

    Trade Bitcoin with up to 100x leverage and maximize your profit potential

    Trade Now on Defx

    Technical Analysis: Key Support and Resistance Levels

    Bitcoin maintains a bullish market structure despite recent volatility:

    • Critical support: $103,600
    • Current resistance: $112,000
    • EMA cluster support: $94,455

    FAQ: Bitcoin’s Price Discovery Phase

    What does price discovery mean for Bitcoin?

    Price discovery occurs when an asset trades above its previous all-time high, meaning there’s no historical resistance levels to reference.

    Why aren’t whales selling at these levels?

    The neutral whale activity suggests institutional investors may be viewing current prices as still undervalued relative to their long-term price targets.

    What could trigger the next major move?

    Key catalysts include ETF flows, macroeconomic developments, and whether support at $103,600 holds during retests.

    As Bitcoin navigates this crucial phase, all eyes remain on whale activity and institutional flows as potential indicators for the next major price movement.

  • Bitcoin Price Discovery Zone: $100K Target Looms! 🚀

    Bitcoin Price Discovery Zone: $100K Target Looms! 🚀

    Bitcoin Enters Critical Price Discovery Phase as Markets Eye $100K

    Bitcoin has reclaimed the pivotal $90,000 level after experiencing heightened selling pressure, setting the stage for what analysts believe could be a historic price discovery phase. The leading cryptocurrency’s resilience comes amid renewed institutional interest and former President Trump’s recent announcement of a crypto strategic reserve, which initially pushed BTC to $94,000 before a pullback to $82,000.

    Key Market Indicators Signal Major Move Ahead

    According to advanced on-chain analytics platform Alphractal, Bitcoin is approaching a crucial juncture between $70,000 and $90,000 – a $20,000 range that shows minimal historical price consolidation. Key metrics supporting this analysis include:

    • Open Interest (OI) levels showing unusual patterns
    • Trade count metrics indicating increased activity
    • Buying volume trends suggesting accumulation

    SPONSORED

    Trade Bitcoin with up to 100x leverage on perpetual contracts

    Trade Now on Defx

    Technical Analysis Points to $100K Target

    Market experts have identified $100,000 as the next major resistance level, with $70,000 expected to serve as crucial support. This setup creates a potentially explosive scenario for Bitcoin’s price action in the coming weeks.

    Whale Activity Shows Cautious Positioning

    Despite the bullish technical setup, large investor activity remains neutral. Transaction volumes above $100,000 have stayed flat since November 2022, suggesting institutional investors may be waiting for clearer signals before making significant moves.

    Market Implications and Future Outlook

    Recent data from CoinMarketCap reveals a 3% rebound in the last 24 hours, though trading volume has decreased by 26%. This divergence between price and volume suggests a potential accumulation phase before the next major move.

    As Bitcoin approaches this critical juncture, traders should watch for:

    • Breakout confirmation above $95,000
    • Volume expansion supporting price movements
    • Institutional flow indicators
    • Options market positioning

    Source: Bitcoinist