Tag: Price Prediction

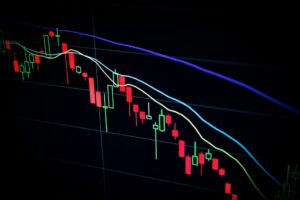
  • Chainlink Price Plunges 16% From $18: Key $10 Support in Focus

    Chainlink (LINK) has entered a critical phase as the cryptocurrency faces mounting selling pressure after failing to breach the $18 resistance level. The digital asset has experienced a sharp 16% decline, raising concerns about potential further downside in the short term. Similar to Bitcoin’s recent pullback from $107K, LINK’s technical structure shows signs of deterioration.

    Technical Analysis Points to Further Downside Risk

    Prominent crypto analyst Ali Martinez has highlighted several concerning technical factors in LINK’s current market structure:

    • Sharp rejection at the $18 resistance zone
    • Break below the 200-day EMA at $16
    • Increased selling volume during recent declines
    • Loss of critical support levels near $15

    The current support zone between $14.80-$15.00 represents a crucial battleground for bulls and bears. A failure to hold these levels could trigger an accelerated move toward the $13.20 support, with the psychological $10 level representing the next major demand zone.

    SPONSORED

    Trade LINK with up to 100x leverage on perpetual contracts

    Trade Now on Defx

    Market Conditions and Recovery Scenarios

    For LINK to regain bullish momentum, several key technical levels must be reclaimed:

    • Immediate resistance at $16 (200-day EMA)
    • Critical resistance zone at $17.50-$18.00
    • 200-day SMA at $17.79

    FAQ: Chainlink’s Current Market Position

    What caused Chainlink’s recent price drop?

    The decline was triggered by a rejection at the $18 resistance level, combined with broader market uncertainty and increased selling pressure.

    What are the key support levels to watch?

    Primary support lies at $14.80-$15.00, followed by $13.20, with the ultimate support target at $10.00.

    When could a recovery begin?

    A sustained close above the 200-day EMA ($16) would be the first signal of potential trend reversal, with confirmation coming from a break above $18.

    Traders should maintain caution in the current environment, as LINK’s price action suggests the possibility of further consolidation before any sustained recovery attempt.

  • Dogecoin Price Signals Major Rally as Falling Wedge Pattern Breaks

    Dogecoin Price Signals Major Rally as Falling Wedge Pattern Breaks

    Dogecoin (DOGE) appears primed for a significant upward move as key technical indicators align in favor of the bulls. Technical analysis reveals a decisive breakout from a falling wedge pattern, historically one of the most reliable bullish reversal formations, suggesting DOGE could be on the verge of reclaiming higher price levels.

    Technical Analysis Points to Strong Bullish Setup

    Crypto analyst TitaniumXBTC has identified a compelling technical setup that combines two powerful bullish patterns. The first is a completed falling wedge breakout, while the second shows a rounded bottom formation taking shape. When these patterns converge, they typically signal the exhaustion of downward pressure and the potential start of a new uptrend. This analysis gains additional weight in light of recent price action that tested critical support levels.

    SPONSORED

    Trade DOGE with up to 100x leverage on perpetual contracts

    Trade Now on Defx

    Key Price Targets and Resistance Levels

    The analysis highlights three critical price targets that traders should monitor:

    • First resistance: $0.3757
    • Secondary target: $0.4884
    • Major resistance: $0.6160

    These levels align with historical resistance zones and could serve as important psychological barriers. The recent market structure suggests increased buying pressure, with momentum indicators turning positive as DOGE pushes beyond key resistance areas.

    Market Implications and Trading Considerations

    While the technical setup appears promising, traders should note that confirmation of the breakout is crucial. The current pattern shows similarities to broader meme coin market movements, suggesting a potential sector-wide rally could be forming.

    Frequently Asked Questions

    What is a falling wedge pattern?

    A falling wedge is a bullish chart pattern characterized by converging trendlines with a downward slope. It typically signals a potential trend reversal from bearish to bullish.

    What makes this breakout significant?

    The combination of the falling wedge breakout with a rounded bottom formation provides stronger confirmation of a potential trend reversal than either pattern alone.

    What could invalidate this bullish setup?

    A daily close below the breakout level or significant volume decline could invalidate the current bullish setup and suggest further consolidation is needed.

  • Bitcoin Price at $106.5K Resistance: Bulls Eye $120K or Risk 27% Drop

    Bitcoin Price at $106.5K Resistance: Bulls Eye $120K or Risk 27% Drop

    Bitcoin (BTC) faces a critical moment as it tests the $106,500 resistance level, with analysts divided on whether the leading cryptocurrency will breakthrough to $120,000 or face a significant correction. This analysis comes as Bitcoin ETFs continue their strong inflow streak, though showing early signs of momentum fatigue.

    Technical Analysis Points to Make-or-Break Moment

    According to prominent crypto analyst Crypto Patel, Bitcoin is currently retesting a crucial resistance level at $106,500, which has previously triggered price rejections in both December and January. The asset’s performance at this key level could determine the next major price movement.

    SPONSORED

    Trade Bitcoin with up to 100x leverage on perpetual contracts

    Trade Now on Defx

    Key Price Levels to Watch

    • Current Price: $103,355
    • Key Resistance: $106,500
    • Critical Support: $90,000
    • Potential Downside: $75,000 (27.1% drop)
    • Bullish Target: $120,000

    Market Indicators and Analysis

    The Relative Strength Index (RSI) has recently moved out of overbought territory, suggesting a potential price correction could be imminent. However, several bullish factors remain in play:

    • US BTC spot ETFs recorded nearly $2 billion in net weekly inflows
    • 90-day US-China tariff truce reducing market uncertainty
    • Strong institutional investment continuing to drive demand

    Price Predictions and Market Outlook

    CoinCodex’s analysis reveals high market greed with a Fear & Greed Index reading of 74. Their predictions suggest:

    • 5-day target: $127,872
    • Short-term correction target: $111,616
    • 3-month projection: $155,583
    • 6-month outlook: $148,167

    FAQ Section

    What could trigger a Bitcoin price breakout above $106,500?

    Continued institutional investment through ETFs and positive macroeconomic developments could provide the necessary momentum for a breakthrough.

    What are the key support levels if Bitcoin faces rejection?

    The primary support zone lies at $90,000, with a secondary support level at $75,000 if bearish pressure intensifies.

    How significant is the current ETF inflow for Bitcoin’s price?

    The sustained ETF inflows provide crucial market support and demonstrate strong institutional confidence in Bitcoin’s long-term value proposition.

  • Bitcoin Surges Past $103K: Analysts Eye $120K Target as ETF Inflows Soar

    Bitcoin Surges Past $103K: Analysts Eye $120K Target as ETF Inflows Soar

    Bitcoin’s remarkable V-shaped recovery has pushed the leading cryptocurrency above $103,000, with institutional investors pouring over $5 billion into Bitcoin ETFs in recent days. As market momentum builds toward new all-time highs, analysts are setting their sights on $120,000 as the next major resistance level.

    Macro Factors Fuel Bitcoin’s Rise

    The latest surge comes amid growing concerns over U.S. economic stability, highlighted by Moody’s recent downgrade of the U.S. credit outlook from ‘stable’ to ‘negative.’ This development, combined with Bitcoin’s emerging safe-haven status, has accelerated institutional adoption of digital assets.

    ETF Inflows Signal Institutional Confidence

    Bitcoin ETFs have seen unprecedented interest, with over $5 billion in new capital flowing in during recent days. This surge in institutional investment represents a significant shift in market dynamics, suggesting growing mainstream acceptance of Bitcoin as a legitimate asset class.

    SPONSORED

    Trade Bitcoin with up to 100x leverage and maximize your profit potential

    Trade Now on Defx

    Technical Analysis Points to Further Upside

    The V-shaped recovery pattern on Bitcoin’s daily chart suggests strong buying pressure. Technical analysts are projecting potential targets of $120,000 in the near term, with some even calling for $160,000 based on golden ratio analysis.

    Market Sentiment and Future Outlook

    Market sentiment indicators remain strongly bullish, with funding rates staying relatively modest despite the price surge. This suggests the rally may have room to run without overleveraged positions threatening stability.

    FAQ Section

    What’s driving Bitcoin’s current price surge?

    A combination of institutional ETF inflows, macro economic concerns, and strong technical momentum are fueling Bitcoin’s rise above $103,000.

    Will Bitcoin reach $120,000?

    While nothing is guaranteed in cryptocurrency markets, multiple analysts point to $120,000 as the next major resistance level, supported by technical analysis and institutional buying pressure.

    How significant are the ETF inflows?

    The $5 billion in recent ETF inflows represents one of the largest institutional capital movements into Bitcoin, signaling strong mainstream adoption.

  • Bitcoin Price at $103K Crossroads: Key Metric Signals Potential Reversal

    Bitcoin Price at $103K Crossroads: Key Metric Signals Potential Reversal

    Bitcoin’s impressive 25% monthly surge to $103,713 has brought the cryptocurrency to a critical technical juncture, with on-chain metrics suggesting a potential trend reversal ahead. Recent derivatives data showing bearish pressure at $104K adds further weight to this pivotal moment.

    Long-Term Holder Behavior Signals Market Uncertainty

    According to on-chain analytics firm Alphractal, Bitcoin’s Long-Term Realized Cap Impulse metric has reached a crucial decision point. This technical indicator, which measures long-term holder behavior, suggests the market could be preparing for a significant move in either direction.

    SPONSORED

    Trade Bitcoin with up to 100x leverage and maximize your profit potential

    Trade Now on Defx

    Understanding the Long-Term Realized Cap Impulse

    The metric provides crucial insights into market dynamics:

    • Positive values indicate long-term investors buying at higher prices
    • Negative values suggest distribution phases and potential market tops
    • Current levels mirror those seen before the March 2020 market crash

    Technical Analysis and Price Levels

    Bitcoin currently trades within a tight consolidation range:

    • Support: $102,000
    • Resistance: $105,000
    • 24-hour change: +0.6%

    Recent MVRV analysis suggests a potential breakout target of $117K, though current metrics indicate caution may be warranted in the short term.

    Historical Context and Market Implications

    The last time the Long-Term Realized Cap Impulse reached current levels, it preceded a significant market correction. However, today’s market structure differs considerably, with institutional involvement and ETF flows providing additional support levels.

    FAQ Section

    What does the current Bitcoin price consolidation mean?

    The consolidation between $102,000 and $105,000 indicates a period of price discovery and potential trend determination.

    Could Bitcoin drop below $100,000?

    While possible, strong institutional buying and ETF inflows provide significant support above the six-figure mark.

    What are the key levels to watch?

    Primary support lies at $102,000, with major resistance at $105,000. A break above could target $117,000.

    Investors should closely monitor the Long-Term Realized Cap Impulse metric for potential trend confirmation while maintaining appropriate risk management strategies during this critical market phase.

  • Bitcoin Golden Ratio Points to $160K Target – Key Levels Revealed

    Bitcoin continues to consolidate around $103,000, with the recent upward momentum showing signs of cooling off. While short-term volatility persists, a powerful technical indicator that accurately predicted the 2021 top is now suggesting significant upside potential ahead. As Bitcoin tests key resistance levels, the Golden Ratio Multiplier could provide crucial insights into the next major move.

    Understanding the Golden Ratio Multiplier

    The Golden Ratio Multiplier has emerged as one of the most reliable predictive tools in Bitcoin’s price analysis. This logarithmic model incorporates Fibonacci-derived multipliers to map out Bitcoin’s macro trends with remarkable accuracy. Its track record includes successfully calling the April 2021 cycle top in real-time, as well as the 2017 and 2013 price peaks.

    Current Cycle Analysis and Price Targets

    According to crypto analyst CryptoCon, Bitcoin has already reached Level 4 on the multiplier chart during this cycle. However, this appears to be just a mid-cycle peak, with the Level 5 band around $160,000 representing the next major target. This aligns with other technical analyses suggesting a clear path to higher levels.

    SPONSORED

    Trade Bitcoin with up to 100x leverage on perpetual contracts

    Trade Now on Defx

    Historical Pattern Comparison

    The current market structure shows remarkable similarities to the 2015-2017 period, characterized by a gradual build-up followed by explosive price action. This pattern suggests we’re currently at a stage equivalent to April 2017, just before Bitcoin embarked on its historic bull run.

    Golden Ratio Levels and Previous Cycle Tops

    The model’s historical accuracy is demonstrated through its identification of previous cycle tops:

    • 2011: Level 10
    • 2013: Levels 9 and 8
    • 2017: Level 7
    • 2021: Level 6
    • 2024-2025 (projected): Level 5 ($160,000)

    Market Implications and Trading Considerations

    While Bitcoin trades at $102,971, the current consolidation phase could be setting up for a significant move higher. Recent options data supports this bullish outlook, suggesting growing momentum for a potential new all-time high.

    FAQ Section

    What is the Golden Ratio Multiplier?

    It’s a technical analysis tool that uses Fibonacci ratios to predict Bitcoin’s price movements and cycle tops based on the 350-day moving average.

    How accurate has this indicator been historically?

    The indicator has successfully predicted major cycle tops in 2013, 2017, and 2021, making it one of the more reliable long-term prediction tools.

    What’s the projected timeframe for reaching $160,000?

    While exact timing is difficult to predict, the current cycle analysis suggests this target could be reached later in 2025, following a pattern of ‘slower buildup, then all at once.’

  • Ethereum Price Eyes $4,000: Key Triangle Pattern Signals Major Breakout

    Ethereum Price Eyes $4,000: Key Triangle Pattern Signals Major Breakout

    Ethereum (ETH) has surged over 4.6% in the last 24 hours, reaching $2,634 before a minor pullback, as the second-largest cryptocurrency positions itself for a crucial test of the $4,000 resistance level. The recent price action, which has delivered an impressive 61.92% monthly gain, suggests ETH is approaching a decisive moment that could determine its long-term trajectory.

    Critical Technical Pattern Points to Major Price Movement

    According to crypto analyst Ted Pillows, Ethereum has been consolidating within a massive symmetrical triangle formation that dates back to Q3 2020. This pattern, spanning over 1,500 days, has consistently influenced ETH’s price action, with the $4,000 level representing a critical resistance point near the triangle’s upper boundary.

    The significance of the $4,000 level cannot be overstated, as Ethereum’s recent price movements demonstrate increasing momentum toward this psychological barrier. In 2024 alone, ETH has faced rejection at this level three times, making the upcoming test particularly crucial for market sentiment.

    SPONSORED

    Trade Ethereum with up to 100x leverage on perpetual contracts

    Trade Now on Defx

    Institutional Interest Signals Strong Market Fundamentals

    Adding weight to the bullish case, institutional adoption continues to accelerate. UK-based Abraxas Capital has accumulated 257,165 ETH (approximately $655 million), demonstrating growing institutional confidence in Ethereum’s long-term potential. This institutional backing could provide the necessary support for ETH to finally break through the $4,000 resistance.

    Price Targets and Risk Levels

    A successful breach of $4,000 could trigger a parabolic move toward ambitious targets as high as $12,000. However, traders should remain cautious of potential rejection at this level, which could lead to a correction toward the triangle’s lower boundary near $1,700.

    Frequently Asked Questions

    What makes the $4,000 level so important for Ethereum?

    The $4,000 level represents both a psychological barrier and the upper boundary of a long-term symmetrical triangle pattern that has influenced ETH’s price since 2020.

    What could trigger an ETH breakout above $4,000?

    Continued institutional adoption, overall crypto market strength, and sustained buying pressure from both retail and institutional investors could provide the momentum needed for a breakthrough.

    What are the key support levels to watch if ETH fails to break $4,000?

    The primary support level to watch would be $1,700, which aligns with the lower boundary of the symmetrical triangle pattern.

  • Bitcoin Eyes $120K: Wyckoff Pattern Signals Major Breakout Ahead

    Bitcoin Eyes $120K: Wyckoff Pattern Signals Major Breakout Ahead

    Bitcoin (BTC) appears poised for a significant rally as multiple technical indicators and on-chain metrics align to suggest an imminent breakout above its current all-time high of $108,786. Recent analysis of key metrics indicating a potential Bitcoin supercycle in 2025 adds further weight to this bullish outlook.

    Wyckoff Accumulation Pattern Reaches Final Stage

    Renowned crypto analyst Ted Pillows has identified that Bitcoin has entered the final phase of the Wyckoff Accumulation pattern, a technical formation that typically precedes major upward price movements. The cryptocurrency’s sustained consolidation above $100,000 is viewed as particularly significant, especially when combined with Tether’s recent $2 billion USDT mint, which could inject fresh liquidity into the market.

    SPONSORED

    Trade Bitcoin with up to 100x leverage and maximize your profit potential

    Trade Now on Defx

    Multiple Technical Indicators Support Bullish Thesis

    Several key technical factors are aligning to support the bullish outlook:

    • Fair Value Gap (FVG) between $98,000 and $102,000 providing strong support
    • Potential short squeeze trigger at $105,000 could liquidate $23.65 million in positions
    • Strong institutional inflows through spot ETFs, with April recording $2.97 billion in net inflows

    Institutional Adoption Continues to Accelerate

    The institutional adoption narrative remains strong, with major corporations continuing to add Bitcoin to their treasuries. BlackRock’s IBIT ETF success story exemplifies this trend, having surpassed their gold fund in net assets.

    FAQ Section

    What is the Wyckoff Accumulation Pattern?

    The Wyckoff Accumulation pattern is a technical analysis framework that identifies periods when large investors accumulate assets before a major uptrend. It consists of several phases including accumulation, consolidation, and eventual breakout.

    Why is the $105,000 level significant?

    This price point represents a critical resistance level where a breakthrough could trigger significant short position liquidations, potentially creating a cascade effect that pushes prices higher.

    What role do ETF inflows play in Bitcoin’s price action?

    Strong ETF inflows indicate institutional demand and can reduce available supply on exchanges, potentially creating upward price pressure.

    At press time, Bitcoin trades at $103,896, maintaining its position above key support levels as market participants await the next major move.

  • Bitcoin Price Target $220K: Gold Correlation Signals Major Rally

    Bitcoin’s strengthening correlation with gold could drive BTC prices above $200,000 in 2025, according to a detailed analysis by crypto researcher Apsk32. This forecast aligns with recent predictions of a Bitcoin supercycle in 2025, suggesting unprecedented growth potential for the leading cryptocurrency.

    Bitcoin-Gold Relationship Strengthens

    The analysis reveals Bitcoin has been closely trailing gold’s price movements with a few months’ lag. With gold recently hitting $3,500 per ounce, this correlation suggests Bitcoin could be preparing for a major upward move. This relationship has become particularly significant as JPMorgan predicts Bitcoin could replace gold as a premier store of value.

    Technical Analysis: The Power Curve Model

    Apsk32’s proprietary “power curve” model, which measures Bitcoin’s market cap in gold ounces, indicates a potential 2025 bull market peak exceeding $200,000. The model has demonstrated historical accuracy, tracking Bitcoin’s movements since the 2017 high of $20,000.

    SPONSORED

    Trade Bitcoin with up to 100x leverage and maximize your profit potential

    Trade Now on Defx

    Price Targets and Market Scenarios

    While some analysts project Bitcoin reaching $444,000, Apsk32 maintains a more conservative target of $220,000, with a potential stretch to $250,000. These projections represent a significant increase from Bitcoin’s late 2022 low of $22,000.

    Supply and Demand Dynamics

    Bitcoin’s fixed supply cap of 21 million coins, combined with the upcoming 2024 halving event, creates a compelling scarcity narrative. The reduction in miner rewards from 6.25 to 3.125 BTC per block historically correlates with price appreciation cycles.

    Risk Factors and Market Considerations

    Investors should consider several risk factors, including:

    • Market volatility (20%+ daily swings possible)
    • Regulatory uncertainties
    • Geopolitical events
    • Technical upgrades impact

    FAQ

    What is the most likely Bitcoin price target for 2025?

    According to the analysis, $220,000 represents the most realistic target, though prices could range between $200,000 and $250,000.

    How does Bitcoin’s correlation with gold affect its price?

    Bitcoin typically follows gold’s price movements with a few months’ delay, suggesting potential upside as gold reaches new highs.

    What role does the 2024 halving play in price predictions?

    The halving reduces new Bitcoin supply, historically leading to price appreciation in the following 12-18 months.

    Featured image: Shutterstock

  • XRP Price Targets $5.90: Technical Analysis Reveals Bullish Breakout Pattern

    XRP Price Targets $5.90: Technical Analysis Reveals Bullish Breakout Pattern

    The XRP market is showing strong signs of a potential price explosion, with technical analysis pointing to a significant surge that could push the cryptocurrency to $5.90. Recent bullish reversal signals combined with current consolidation patterns suggest XRP is preparing for its next major move.

    Technical Analysis Reveals Bullish Formation

    According to renowned crypto analyst Master Ananda’s detailed analysis released on May 15, XRP’s price action has formed a compelling bullish setup. The analysis highlights a strong rally from late 2024, characterized by sustained green candles indicating robust buying pressure.

    Key Price Levels and Fibonacci Analysis

    The technical analysis identifies several critical price levels based on Fibonacci retracement:

    • $2.05 (0.236 Fibonacci level)
    • $2.39 (0.382 Fibonacci level)
    • $2.71 (0.618 Fibonacci level)
    • $3.40 (Previous high)
    • $4.50 (1.618 Fibonacci extension)
    • $6.29 (2.618 Fibonacci extension)

    SPONSORED

    Trade XRP with up to 100x leverage on perpetual contracts

    Trade Now on Defx

    Consolidation Phase and Breakout Potential

    The current consolidation phase, marked by a symmetrical triangle pattern, suggests accumulation rather than weakness. This technical formation, combined with consistent weekly green closes since April 7, 2025, points to sustained bullish momentum.

    Expert Analysis and Market Sentiment

    Crypto analyst Egrag Crypto has identified a critical “pandora box” zone that could trigger significant volatility. Long-term projections remain highly optimistic, with multiple analysts pointing to fundamental catalysts supporting sustained growth.

    Frequently Asked Questions

    Q: What is the nearest resistance level for XRP?
    A: The immediate resistance lies at $2.05, corresponding to the 0.236 Fibonacci level.

    Q: How long might the consolidation phase last?
    A: Based on current patterns, analysts expect the consolidation to resolve within the next few weeks.

    Q: What technical indicators support the bullish thesis?
    A: Weekly green closes, Fibonacci extensions, and the symmetrical triangle breakout all point to bullish momentum.