Tag: Price Prediction

  • XRP Price Signals Major Breakout: Technical Analysis Points to $2.50 Target

    Key Takeaways:

    • XRP consolidates at $2.10 with double-bottom pattern forming
    • Technical indicators suggest potential breakout above $2.35 resistance
    • Volume analysis shows increasing bullish momentum

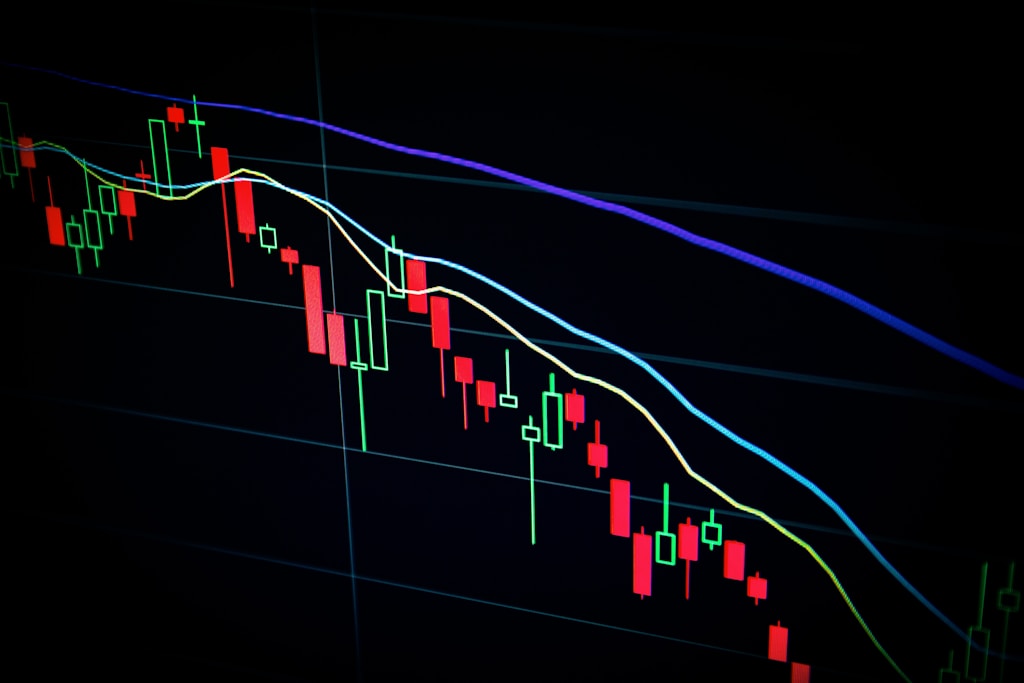
    XRP’s price action has reached a critical juncture as technical indicators point to an imminent major move. The digital asset, currently consolidating near $2.10, has formed a promising double-bottom pattern that typically precedes significant price movements.

    This analysis comes at an interesting time, following recent predictions of XRP reaching $10 from industry experts, though immediate targets remain more conservative.

    Technical Analysis Breakdown

    The hourly chart reveals several key developments:

    • Support level established at $2.035
    • Double-bottom formation suggesting trend reversal
    • Increasing volume supporting potential upward movement
    • RSI showing bullish divergence

    SPONSORED

    Trade XRP with up to 100x leverage and maximize your profit potential

    Trade Now on Defx

    Key Price Levels to Watch

    Traders should monitor these critical levels:

    • Immediate Resistance: $2.15
    • Major Resistance: $2.35
    • Support: $2.035
    • Secondary Support: $1.95

    Volume Analysis

    Recent volume patterns show increasing buyer interest, with the latest green candle accompanied by above-average volume – a typically bullish signal.

    FAQ

    Q: What’s the immediate price target for XRP?
    A: Technical analysis suggests a potential move to $2.50 if current resistance levels are broken.

    Q: What could trigger the breakout?
    A: Increased trading volume and a break above $2.15 could catalyze the move.

    Q: What’s the stop-loss level for traders?
    A: Conservative traders might set stops below $2.00, while aggressive traders could use $2.035.
  • XRP Price Target Hits $10: Expert Analysis Points to Major Rally

    XRP Price Target Hits $10: Expert Analysis Points to Major Rally

    XRP’s price has surged above $2, marking a significant 20% weekly gain as market analysts project ambitious price targets. Leading crypto analyst Maelius has outlined a compelling case for XRP reaching $10, with potential for even higher valuations in an optimistic scenario.

    XRP Technical Analysis Shows Bullish Pattern

    The cryptocurrency’s recent performance has been particularly noteworthy, with XRP demonstrating strong technical fundamentals. The token’s respect of the 50-week Exponential Moving Average (EMA) suggests a continuation of its bullish trajectory, mirroring patterns seen in previous bull markets. Recent price corrections near $2.20 have established crucial support levels that could fuel the next leg up.

    SPONSORED

    Trade XRP with up to 100x leverage on perpetual contracts

    Trade Now on Defx

    Conservative vs. Optimistic Price Scenarios

    Maelius presents two potential scenarios for XRP’s future price action:

    • Conservative Case ($10 Target): Completion of Wave 3 with 35% probability
    • Optimistic Case ($15-$20 Target): Extended Wave 3 continuation into 2026

    Market Dominance Analysis

    While XRP’s market dominance metrics suggest potential underperformance against some altcoins, the token’s technical indicators remain strong. The 1-week RSI maintains an uptrend, supported by both horizontal and diagonal support levels.

    FAQ Section

    What is the timeline for XRP reaching $10?

    According to Maelius’s analysis, the $10 target could be achieved within the current market cycle, potentially by late 2025.

    What are the key risk factors?

    Market volatility, regulatory developments, and broader crypto market conditions could impact XRP’s price trajectory.

    How does this forecast compare to historical XRP performance?

    The projected targets would represent new all-time highs for XRP, surpassing previous peak valuations.

  • Cardano (ADA) Price Setup Signals 15% Rally Potential, Key Levels Revealed

    Cardano (ADA) is showing strong technical signals that point to a potential 15% upside move, as multiple chart indicators align in a bullish formation. Recent developments in Cardano’s DeFi capabilities combined with the current technical setup create a compelling case for ADA’s next major move.

    Technical Analysis Reveals Bullish Pattern Formation

    According to respected crypto analyst Thomas Anderson, ADA is currently consolidating within a descending triangle pattern on the 1-hour timeframe. The price is testing critical support at $0.6292, which has proven resilient in recent trading sessions. This technical formation, combined with increasing buying pressure, suggests that bulls are preparing for a potential breakout.

    SPONSORED

    Trade ADA with up to 100x leverage on perpetual contracts

    Trade Now on Defx

    Key Price Levels to Watch

    The technical analysis highlights several crucial price levels:

    • Current Support: $0.6292
    • Major Resistance: $0.6974
    • Secondary Support: $0.60
    • Critical Support: $0.58

    Moving Average Analysis

    The 200-period moving average remains a significant technical barrier, with ADA currently trading below this key indicator. However, the formation of higher lows on the 4-hour chart suggests growing bullish momentum, despite the current resistance at $0.6974.

    Volume Analysis and Market Sentiment

    Trading volume patterns indicate accumulation at current levels, with the potential for increased buying pressure if key resistance levels are breached. A successful break above $0.6974 could trigger a cascade of buy orders, potentially pushing ADA toward higher price targets.

    Risk Factors and Alternative Scenarios

    Traders should remain cautious of potential downside risks. A failure to hold support at $0.6292 could trigger a correction toward $0.60 or even $0.58. These levels will be crucial for maintaining the broader uptrend structure.

    Frequently Asked Questions

    What is the key resistance level for Cardano?

    The primary resistance level is at $0.6974, which needs to be broken for confirmation of the bullish scenario.

    What technical patterns support the bullish case?

    The descending triangle pattern, higher lows formation, and increasing buying pressure at support levels all suggest potential upside movement.

    What are the main risk factors?

    The main risks include a potential break below $0.6292 support and continued resistance at the 200-period moving average.

  • Dogecoin Price Target $2.10: Wyckoff Pattern Signals Major Rally Ahead

    Dogecoin (DOGE) appears poised for a significant price surge as multiple technical indicators align with the Wyckoff Accumulation pattern, suggesting an imminent rally that could push the leading meme coin to new all-time highs. Recent analysis predicting a 300% DOGE rally gains further credibility with this development.

    Wyckoff Pattern Points to $2.10 Target

    Renowned crypto analyst Trader Tardigrade has identified that DOGE is entering the crucial Phase E of the Wyckoff Accumulation pattern after completing several key technical milestones:

    • Last Point of Support (LPS) at $0.174
    • Sign of Strength (SOS) level at $0.18
    • Successful completion of Phase C TEST
    • Confirmation of Phase D support levels

    Multiple Technical Patterns Confirm Bullish Outlook

    Supporting the Wyckoff analysis, several other technical formations have emerged:

    • Inverse Head and Shoulders pattern on the 4-hour timeframe
    • Potential rally to $0.183 as immediate target
    • Higher timeframe support maintaining strong price structure

    SPONSORED

    Trade DOGE with up to 100x leverage and maximize your profit potential

    Trade Now on Defx

    Key Price Levels to Watch

    Traders should monitor these critical price points:

    • Current support: $0.13
    • Immediate resistance: $0.17
    • Secondary target: $0.21
    • Maximum projection: $0.29

    Market Factors Influencing DOGE’s Trajectory

    Several market dynamics could impact Dogecoin’s price movement:

    • Whale activity currently showing neutral positioning
    • Bitcoin price correlation remains strong
    • Key $89,000 BTC level identified as catalyst

    FAQ

    What is the Wyckoff Accumulation Pattern?

    The Wyckoff Accumulation Pattern is a technical analysis framework that identifies market cycles through phases A through E, helping predict potential price reversals and continuations.

    What could prevent DOGE from reaching $2.10?

    Key risks include Bitcoin market volatility, whale selling pressure, and failure to maintain support at $0.13.

    When might DOGE reach the projected target?

    While exact timing is uncertain, the completion of Phase E typically occurs within 3-6 months of entering Phase D.

    At time of writing, DOGE trades at $0.16, showing a 3% decline over 24 hours. Traders should maintain strict risk management while monitoring key support and resistance levels.

  • Bitcoin Price Target $144K as Global M2 Money Supply Hits ATH

    Bitcoin Price Target $144K as Global M2 Money Supply Hits ATH

    Bitcoin’s trajectory towards new all-time highs above $100,000 appears increasingly likely as the Global M2 money supply metric flashes strongly bullish signals. Crypto analyst Colin’s latest analysis suggests BTC could reach as high as $144,000 in the coming months, backed by compelling macro indicators.

    This bullish outlook aligns with recent institutional developments, as highlighted in recent news of major Bitcoin acquisitions by institutional players, demonstrating growing confidence in BTC as a monetary asset.

    Global M2 Money Supply Analysis Points to Bitcoin Breakout

    According to Colin’s detailed analysis shared on X (formerly Twitter), the Global M2 money supply metric has maintained all-time high levels for three consecutive days. This sustained elevation represents a “fantastic sign” for Bitcoin and other risk assets, though the analyst cautions that actual liquidity flows into BTC may take several weeks to materialize.

    SPONSORED

    Trade Bitcoin with up to 100x leverage on perpetual contracts

    Trade Now on Defx

    Key Technical Levels and Timeline

    The analysis projects a potential “slow bleed” until mid-April, specifically around April 16-17, creating what could be the last major dip buying opportunity before a significant price surge. Technical indicators suggest the real breakout movement may not initiate until May 2025.

    Understanding Global M2’s Impact on Bitcoin

    Colin emphasizes the importance of viewing the Global M2 metric through a macro lens, noting that:

    • The correlation shows 20% deviation periods
    • Short-term price movements shouldn’t overshadow the broader trend
    • Patience is crucial for capitalizing on this macro indicator

    Additional Technical Confirmation

    Supporting this bullish outlook, analyst Titan of Crypto has identified a potential momentum flip in Bitcoin’s price action. Key technical indicators showing strength include:

    • LMACD displaying clear momentum shift
    • Weekly chart showing robust price action
    • RSI breaking key trendline resistance
    • Price targeting $90,000 in the near term

    Current Market Position

    As of the latest market data, Bitcoin trades at $85,400, showing a 1% increase over 24 hours. This price level positions BTC strategically for its projected move toward the $100,000 milestone.

    FAQ Section

    What is the Global M2 money supply?

    Global M2 money supply is a measure of the money supply that includes cash, checking deposits, and easily convertible near money. It’s considered a key indicator of potential asset price inflation.

    Why is the $144,000 target significant?

    This price target represents a key technical and psychological level based on Global M2 correlation patterns and historical price action analysis.

    When could Bitcoin reach these predicted levels?

    According to the analysis, the major price movement could begin in May 2025, following a potential dip in mid-April.

  • XRP Price Alert: Analyst Maps $20 Target for Q2 2025 Rally

    XRP Price Alert: Analyst Maps $20 Target for Q2 2025 Rally

    XRP’s price trajectory could see a dramatic shift in the coming months, with one prominent analyst laying out an ambitious roadmap that extends far beyond the token’s current $2 range. This comprehensive analysis suggests that the recent consolidation above $2 may be just the beginning of a much larger price movement that could redefine XRP’s market position.

    From $3 to $20: Breaking Down the Multi-Stage Rally

    While many traders are focused on XRP reclaiming the $3 level, crypto analyst BarriC has outlined a more expansive vision that could see the digital asset reach unprecedented heights. This forecast aligns with recent technical analysis showing strong support at the $2 level, suggesting a solid foundation for future growth.

    Key price targets in BarriC’s analysis include:

    • Near-term breakthrough above $3
    • $5 becoming the new price floor by May
    • $10-20 trading range during peak altcoin season
    • Potential for “utility run” pushing prices toward $1,000

    SPONSORED

    Trade XRP with up to 100x leverage on perpetual contracts

    Trade Now on Defx

    Technical Catalysts Supporting the Bullish Outlook

    The current market structure shows several bullish indicators supporting this ambitious price target:

    • Strong support established at $2.14
    • 1.4% daily gain showing sustained buying pressure
    • Increased institutional interest in XRP
    • Growing adoption of XRP’s utility features

    Market Dominance Shift: XRP vs ETH and BTC

    Beyond price predictions, analysts are noting XRP’s potential to challenge the market dominance of leading cryptocurrencies. Standard Chartered’s analysis suggests XRP could overtake Ethereum’s market cap by 2028, while analyst Axel Rodd points to declining Bitcoin dominance as a catalyst for XRP’s rise.

    FAQ: XRP Price Predictions

    Q: What is XRP’s current price target for 2025?
    A: Analysts project a range between $10-20 during peak altcoin season, with potential for higher valuations based on utility adoption.

    Q: What factors could drive XRP’s price growth?
    A: Key drivers include institutional adoption, declining Bitcoin dominance, and increased utility as a bridge currency.

    Q: Is $1,000 XRP realistic?
    A: While ambitious, analysts suggest this level could be possible during a “utility run” scenario where real-world adoption accelerates significantly.

    Conclusion: Navigating XRP’s Potential Rally

    As XRP continues to build momentum above $2, investors should monitor key technical levels and adoption metrics. While the projected targets may seem ambitious, the combination of technical analysis, institutional interest, and growing utility use cases provides a foundation for potential significant price appreciation in the coming months.

  • Bitcoin Price Pattern Mirrors 2017 Bull Run: 93K Target Ahead

    Bitcoin Price Pattern Mirrors 2017 Bull Run: 93K Target Ahead

    Leading crypto analyst Rekt Capital has identified striking similarities between Bitcoin’s current price action and the 2017 bull market pattern, suggesting BTC could be setting up for another parabolic move toward $93,500 despite the recent pullback.

    Historical Pattern Points to Major Bitcoin Rally

    In his latest market analysis titled “Where’s The Bitcoin ‘Banana Zone’?”, Rekt Capital examined Bitcoin’s 32% correction through the lens of previous bull cycles. The analyst noted that the current retracement closely mirrors Bitcoin’s behavior during the 2017 bull run, when BTC experienced multiple 34-40% corrections before reaching new all-time highs.

    “What we’re seeing now is perfectly in line with historical Bitcoin price action,” explained Rekt Capital. “During the 2017 bull market, Bitcoin underwent at least four significant corrections ranging from 34% to 40% before ultimately reaching its peak.”

    SPONSORED

    Trade Bitcoin with up to 100x leverage and maximize your profit potential

    Trade Now on Defx

    Technical Indicators Support Bullish Outlook

    The analysis highlights a crucial technical formation, with Bitcoin’s price currently “sandwiched” between the 21-week and 50-week exponential moving averages. This setup bears a striking resemblance to mid-2021’s market structure, which preceded a significant breakout.

    Why This Correction Is Different

    Despite concerns about a potential bear market, Rekt Capital maintains that the current pullback is simply part of a healthy bull market cycle. The analyst emphasized that while the correction has been deeper than some expected, it’s setting the stage for the next major price discovery phase.

    Price Targets and Next Moves

    Based on the technical analysis and historical comparisons, Rekt Capital projects Bitcoin could target $93,500 if it maintains support above the 21-week EMA. This aligns with broader market expectations for Bitcoin’s next major move.

    FAQ Section

    Q: Is Bitcoin entering a bear market?
    A: According to Rekt Capital’s analysis, this is not a bear market but rather a typical correction within a broader bull cycle.

    Q: How long could this correction last?
    A: While the current correction has been extended, historical patterns suggest it’s nearing completion as price finds support at key moving averages.

    Q: What are the key levels to watch?
    A: The 21-week EMA serves as crucial support, while $93,500 represents the next major target if Bitcoin maintains its bullish structure.

    At time of writing, Bitcoin trades at $85,914, maintaining a strong position despite the recent volatility.

  • XRP Price Targets $2.50 as Bulls Eye Critical $2.16 Breakout Level

    XRP Price Targets $2.50 as Bulls Eye Critical $2.16 Breakout Level

    XRP’s price action is showing strong bullish momentum, with the cryptocurrency poised for a potential breakout above crucial resistance levels. The digital asset has maintained steady gains above $2.00, setting up for what could be a significant push toward the $2.50 mark.

    As Ripple’s legal clarity continues to improve, XRP’s technical indicators are aligning for a potential upward surge. The asset is currently consolidating above key support levels, suggesting accumulation before the next major move.

    Technical Analysis: Key Levels to Watch

    The current price action shows several bullish indicators:

    • Strong support established at $2.120
    • Trading above the 100-hourly Simple Moving Average
    • Bullish trend line formation providing additional support
    • RSI maintaining position above 50, indicating sustained buying pressure

    Critical Resistance Zones

    Traders should monitor these key resistance levels:

    • Immediate resistance: $2.1680
    • Secondary resistance: $2.20
    • Major target zone: $2.240 – $2.320
    • Ultimate bullish target: $2.50

    SPONSORED

    Trade XRP with up to 100x leverage on perpetual contracts

    Trade Now on Defx

    Support Levels and Downside Risks

    Key support zones to monitor:

    • Primary support: $2.120
    • Secondary support: $2.080
    • Critical support: $2.050
    • Major support: $1.920

    Market Sentiment and Technical Indicators

    Current technical indicators suggest a cautiously optimistic outlook:

    • MACD: Showing decreased momentum in bullish territory
    • RSI: Maintaining position above 50
    • Moving Averages: Price trading above key MAs

    FAQ Section

    What is the next major resistance level for XRP?

    The immediate major resistance level is at $2.1680, followed by $2.20.

    What are the key support levels to watch?

    The primary support levels are at $2.120 and $2.080.

    What technical indicators support a bullish outlook?

    The price trading above the 100-hourly SMA, RSI above 50, and the formation of a bullish trend line all support a positive outlook.

    Conclusion

    XRP’s current price action suggests strong potential for upward movement, particularly if it can break above the $2.1680 resistance level. Traders should maintain close attention to these key levels while managing risk appropriately in their trading strategies.

  • Ethereum Price Eyes $1,800 Breakout as Key Supply Zones Align

    Ethereum Price Eyes $1,800 Breakout as Key Supply Zones Align

    Ethereum (ETH) shows signs of a potential bullish reversal despite recent market turbulence, with technical analysis pointing to a possible breakout toward $1,800. This analysis comes as ETH tests critical support levels around $1,580, setting up an intriguing technical pattern.

    Technical Analysis: Supply Zones Signal Potential Reversal

    According to renowned crypto analyst NotWojak, two critical supply zones at $1,425 and $1,600 are forming a potential springboard for ETH’s next move. The $1,425 zone has already been tested and mitigated, while the $1,600 level remains as the final hurdle before a possible breakout.

    Key Price Levels to Watch

    • Support Level: $1,350
    • First Resistance: $1,600
    • Target Price: $1,835 (20% upside potential)

    On-Chain Metrics Paint Mixed Picture

    Current on-chain data reveals:

    • 32% of investors in profit
    • 65% of holders at a loss
    • 2% at breakeven

    SPONSORED

    Trade Ethereum with up to 100x leverage and maximize your profit potential

    Trade Now on Defx

    Whale Activity Surges

    Large transaction volumes have increased significantly:

    • Transaction volume: $4.8B to $6.48B
    • Average transaction size: $4,048 to $5,415
    • Date range: Through April 9

    FAQ

    What’s driving Ethereum’s current price action?

    A combination of technical factors and whale activity is influencing ETH’s price, with large transactions suggesting institutional movement.

    When could the breakout occur?

    Technical analysis suggests a potential breakout once the $1,600 resistance level is cleared, with momentum indicators showing oversold conditions.

    What are the key risks to watch?

    Continued whale selling pressure and broader market sentiment could impact the potential breakout scenario.

    Current Price: $1,544 (Down 4.56% in 24 hours)

  • Bitcoin Price To Hit $250K in 2025: Cardano Founder’s Bold Prediction

    Bitcoin Price To Hit $250K in 2025: Cardano Founder’s Bold Prediction

    Cardano founder and Ethereum co-creator Charles Hoskinson has made a striking prediction that Bitcoin (BTC) will reach $250,000 by the end of 2025 or early 2026, citing geopolitical tensions and evolving monetary policy as key drivers.

    Key Factors Behind the $250K Bitcoin Price Target

    In a recent CNBC interview, Hoskinson outlined several catalysts that could propel Bitcoin to new heights. This bullish forecast comes as Bitcoin continues to show volatility between $79,000 and $83,000 amid ongoing market uncertainty.

    Geopolitical Tensions and Global Trade Shifts

    Hoskinson emphasized how the changing global landscape is creating ideal conditions for Bitcoin adoption:

    • Shift from rules-based international order to power-based conflicts
    • Limitations of traditional banking systems becoming more apparent
    • Increasing need for borderless financial solutions

    Monetary Policy and Institutional Adoption

    Several key developments could accelerate Bitcoin’s price appreciation:

    • Expected Federal Reserve interest rate cuts
    • Increased institutional liquidity flowing into crypto markets
    • Major tech companies potentially entering the space

    SPONSORED

    Trade Bitcoin with up to 100x leverage and maximize your profit potential

    Trade Now on Defx

    Regulatory Developments Supporting the Bull Case

    The regulatory landscape is evolving favorably, with new SEC leadership signaling a more crypto-friendly approach. Key developments include:

    • Upcoming stablecoin legislation
    • Digital Asset Market Structure and Investor Protection Act
    • Potential adoption by ‘Magnificent 7’ tech companies

    Market Timeline and Price Projections

    Hoskinson provided a detailed timeline for Bitcoin’s path to $250,000:

    • 3-5 months of market consolidation
    • Renewed speculative interest expected by late summer
    • Potential price surge in Q4 2025 or Q1 2026

    FAQ Section

    What could prevent Bitcoin from reaching $250,000?

    Major regulatory setbacks, global economic crisis, or significant technical vulnerabilities could impede Bitcoin’s growth trajectory.

    How does this prediction compare to other expert forecasts?

    Hoskinson’s prediction aligns with other bullish forecasts from institutional investors, though it’s more aggressive than the consensus.

    What role will institutional adoption play?

    Institutional involvement, particularly from major tech companies and financial institutions, could provide the liquidity needed to reach these price levels.

    At press time, Bitcoin trades at $81,138, showing resilience despite recent market turbulence.