Tag: Price Prediction

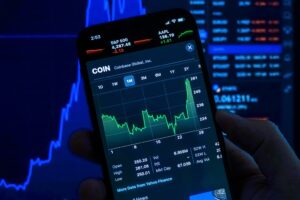
  • XRP Price Alert: 70% of Binance Traders Long as $3.2 Support Tests

    The XRP market is showing a significant divergence between trader sentiment and technical indicators, as 70% of Binance traders maintain bullish positions despite the cryptocurrency’s 30% decline from January highs. This comprehensive analysis examines why this overwhelming bullish bias could signal further downside ahead.

    XRP Price Action and Market Sentiment Analysis

    Recent data reveals a stark contrast in the XRP market, with 70.33% of traders on Binance holding long positions while the asset continues its downward trajectory. This comes as XRP’s price structure shows concerning bearish patterns, suggesting a potential continuation of the current downtrend.

    SPONSORED

    Trade XRP with up to 100x leverage on perpetual contracts

    Trade Now on Defx

    Key Market Metrics

    • Current Long/Short Ratio: 70.33% long vs 29.67% short
    • Open Interest: $3.4 billion maintained over two weeks
    • Price Decline: 30% drop from January 2025 high of $3.2

    Contrarian Indicators and Risk Analysis

    Market history suggests that extreme sentiment readings often precede significant price moves in the opposite direction. With over 70% of traders positioned long, this creates potential for a cascade of liquidations if support levels fail to hold.

    Technical Support Levels to Watch

    Support Level Price Point Significance
    Primary Support $2.05 Previous resistance turned support
    Secondary Support $1.85 200-day moving average
    Critical Support $1.65 Q4 2024 accumulation zone

    Expert Analysis and Price Predictions

    While a Korean crypto analyst has made headlines with an ambitious $10-20 price target, historical data suggests caution. The asset has yet to reclaim its 2018 all-time high of $3.8, making such targets appear increasingly optimistic in the current market context.

    Frequently Asked Questions

    Why are so many traders bullish on XRP despite the price decline?

    Traders appear to be anticipating a bounce from oversold conditions, though this widespread optimism could ironically be a contrary indicator.

    What could trigger an XRP price recovery?

    A recovery could be sparked by broader market sentiment improvement, new institutional adoption, or positive regulatory developments.

    What are the key risk factors for XRP holders?

    Primary risks include potential mass liquidations of long positions, continued market volatility, and regulatory uncertainty.

    Conclusion: While the high percentage of long positions might seem bullish at first glance, historical market behavior suggests caution. Traders should consider position sizing and risk management given the potential for increased volatility ahead.

  • Bitcoin Price Signals 15% Breakout as Triangle Pattern Forms at $83K

    Bitcoin (BTC) appears poised for a significant price movement as a critical triangle pattern forms around the $83,000 level. Technical analysis suggests a potential 15% breakout could be imminent, with key resistance and support levels defining the next major move.

    As recent analysis shows potential for a rally to $95,000, traders are closely monitoring the formation of a symmetrical triangle pattern that could determine Bitcoin’s next directional move.

    Triangle Pattern Analysis: Key Levels to Watch

    The current technical setup shows Bitcoin consolidating between two crucial price levels:

    • Upper resistance: $86,000
    • Lower support: $82,000

    Crypto analyst Ali Martinez highlighted this formation on X (formerly Twitter), noting that the pattern suggests an imminent 15% price movement in either direction. The tightening range between lower highs and higher lows since March 7 has created a classic triangle formation, typically a precursor to significant price action.

    SPONSORED

    Trade Bitcoin with up to 100x leverage on perpetual contracts

    Trade Now on Defx

    Potential Breakout Scenarios

    Two primary scenarios are emerging from this pattern:

    Bullish Scenario:

    • Breakout above $86,000 could trigger a rally toward $90,000-$95,000
    • Volume increase above resistance would confirm bullish momentum
    • Key support at $82,000 must hold to maintain upward bias

    Bearish Scenario:

    • Break below $82,000 could lead to a decline toward $70,000
    • Current bull score of 10 suggests caution
    • Critical buy zones identified at $85,470 and $92,950

    Market Context and Trading Implications

    This pattern formation comes at a crucial time for Bitcoin, as the cryptocurrency has shown remarkable stability despite traditional market turbulence. Traders should consider several factors:

    • Volume patterns during breakout attempts
    • Previous support/resistance levels
    • Overall market sentiment and momentum

    FAQ Section

    What is a triangle pattern in crypto trading?

    A triangle pattern is a technical chart formation where price action converges between two trend lines, indicating a potential breakout point.

    How reliable are triangle patterns for predicting price movements?

    Triangle patterns have historically shown 75% reliability in crypto markets when accompanied by proper volume confirmation.

    What timeframe should traders watch for the breakout?

    The current pattern is forming on the 4-hour timeframe, suggesting a breakout could occur within the next 1-2 weeks.

    At time of writing, Bitcoin trades at $83,070, maintaining position within the triangle pattern as traders await confirmation of the next major move.

  • Dogecoin Price Hits Critical $0.16 Support: Technical Analysis Reveals Next Move

    Dogecoin Price Hits Critical $0.16 Support: Technical Analysis Reveals Next Move

    Dogecoin (DOGE) has reached a decisive moment as price action tests critical support at $0.16, with technical indicators suggesting a potential bottom formation. This analysis comes as Dogecoin continues its downward trend, having dropped 65% from recent highs.

    Technical Analysis Points to Critical Support Zone

    According to recent analysis shared on TradingView, DOGE is currently trading within a descending triangle pattern, traditionally a bearish formation. The critical support zone between $0.164 and $0.18 has become a focal point for traders, serving as an accumulation area where buyers have historically defended the price.

    Key Technical Indicators Show Mixed Signals

    • RSI: Currently at 32.98, approaching oversold territory
    • Wave Trend Oscillator (WTO): Deep in oversold zone with upward-curling signal lines
    • MACD: Yet to confirm reversal, awaiting signal line crossover
    • Ichimoku Cloud: Indicates persistent bearish trend with early exhaustion signs

    SPONSORED

    Trade DOGE with up to 100x leverage and maximize your profit potential

    Trade Now on Defx

    Price Targets and Support Levels

    The analysis outlines several key price levels traders should watch:

    • Immediate Support: $0.164
    • First Resistance: $0.20-$0.21 (0.236 Fibonacci level)
    • Secondary Resistance: $0.28
    • Major Resistance: $0.455 (0.786 Fibonacci level)
    • Downside Risk: $0.11-$0.12 zone if support breaks

    Market Sentiment and Volume Analysis

    The MACD histogram shows diminishing bearish momentum, though lower highs formation indicates persistent selling pressure. The cluster algorithm suggests an imminent breakout, with compression patterns pointing to a significant move in either direction.

    FAQ Section

    What is the current Dogecoin price?

    As of the latest data, Dogecoin is trading at $0.1696.

    What are the key support levels for Dogecoin?

    The primary support zone lies between $0.164 and $0.18, with secondary support at $0.11-$0.12.

    What technical indicators suggest a potential bottom?

    The combination of oversold RSI readings, WTO signal line curling, and MACD histogram compression suggests potential bottoming, though confirmation is needed.

    Conclusion: While Dogecoin shows signs of potential bottoming at the $0.16 support level, traders should wait for confirmation before taking positions. The next few days will be crucial in determining whether DOGE can initiate a recovery toward $0.20 or risks further decline to the $0.11-$0.12 range.

  • XRP Price Target $5: Key Fibonacci Levels Signal Major Breakout Potential

    XRP Price Target $5: Key Fibonacci Levels Signal Major Breakout Potential

    XRP’s price trajectory is showing promising signs of a potential major rally, with respected analyst Egrag Crypto identifying critical Fibonacci levels that could propel the cryptocurrency toward an ambitious $5 target. This technical analysis comes as XRP maintains its position as the fourth-largest cryptocurrency, currently trading at $2.12 with a market capitalization of $123.06 billion.

    This bullish prediction aligns with broader market momentum, as highlighted in our recent analysis XRP Network Activity Surges 490%: Major Price Rally Ahead?, suggesting growing institutional interest in the asset.

    Critical Price Levels for XRP’s Upward Movement

    According to Egrag’s technical analysis, XRP must clear several key resistance levels to achieve its bullish potential:

    • $2.24 – 21-day EMA resistance level
    • $2.30 – Fibonacci 0.382 retracement
    • $2.47 – Fibonacci 0.5 retracement
    • $2.70 – Critical breakout level (Fibonacci 0.618)

    SPONSORED

    Trade XRP with up to 100x leverage on perpetual contracts

    Trade Now on Defx

    Technical Indicators and Market Sentiment

    The current RSI reading of 42.69 shows increasing momentum, though the price remains below the 100-day SMA. This technical setup suggests potential for significant upside movement if key resistance levels are breached.

    FAQ: XRP’s $5 Price Target

    What makes $2.70 a crucial level for XRP?

    The $2.70 level coincides with both the golden ratio (Fibonacci 0.618) and a major resistance line, making it a critical threshold for confirming bullish momentum.

    What could prevent XRP from reaching $5?

    Failure to break above key resistance levels, particularly $2.70, could signal a price reversal and halt the uptrend.

    What’s the potential ROI if XRP reaches $5?

    From current levels around $2.12, a move to $5 would represent a 133% return on investment.

  • Bitcoin Bull Cycle Peak? Volume Ratio Analysis Signals Critical Phase

    Bitcoin Bull Cycle Peak? Volume Ratio Analysis Signals Critical Phase

    Bitcoin’s recent price action has sparked intense debate about whether the current bull cycle is approaching its peak, with the leading cryptocurrency showing uncertain momentum after hitting its all-time high of $109,000 in January 2024. Recent supply ratio analysis had suggested a potential $90K breakout, but new volume metrics paint a more complex picture.

    Volume Ratio Analysis Reveals Cycle Patterns

    CryptoQuant analyst Crypto Dan has identified a critical market indicator through Bitcoin’s trading volume patterns. The analysis shows that BTC’s six to twelve-month volume ratio serves as a reliable gauge for market cycle phases, with current data suggesting we may be approaching a significant inflection point.

    Two distinct volume decline phases typically mark Bitcoin’s market cycles:

    • Initial decline: Signals early bull cycle conclusion
    • Secondary decline: Historically indicates cycle peak and potential reversal

    SPONSORED

    Trade Bitcoin with precision using advanced order types and up to 100x leverage

    Trade Now on Defx

    Technical Indicators Paint Mixed Picture

    The Monthly RSI analysis from RektCapital adds another layer to the narrative. Unlike previous cycles where RSI 60 acted as resistance, it now serves as a support floor – a significant shift in market dynamics that could suggest continued strength despite broader concerns.

    Recent dead cross pattern analysis had projected a 57-day correction window, but current volume metrics and RSI readings present conflicting signals about immediate market direction.

    Expert Perspectives and Market Implications

    Market analyst Javon Marks presents a contrarian view, identifying bullish chart patterns that suggest potential upside ahead. This perspective aligns with institutional behavior, as Bitcoin has shown remarkable resilience at the $80K level despite broader market pressures.

    FAQ Section

    What indicates a Bitcoin bull cycle peak?

    Key indicators include declining trading volumes, RSI readings above 70, and reduced institutional inflows. The current cycle shows some, but not all, of these characteristics.

    As market participants digest these conflicting signals, the coming weeks will be crucial in determining whether Bitcoin’s current bull cycle has indeed reached its peak or if there’s still room for further upside.

  • XRP Network Activity Surges 490%: Major Price Rally Ahead?

    XRP Network Activity Surges 490%: Major Price Rally Ahead?

    XRP’s network metrics are flashing strong bullish signals as active addresses surge by a remarkable 490% since the 2022 market cycle low, potentially setting the stage for significant price appreciation. This explosive growth in network activity suggests mounting retail interest that could fuel XRP’s next major move.

    XRP Network Activity Hits Multi-Year High

    According to recent data from Glassnode, XRP has emerged as a retail favorite in the current market cycle, with network participation reaching levels not seen since the 2017 bull run. This surge in activity stands in stark contrast to Bitcoin’s more modest 10% increase in active addresses over the same period.

    The dramatic increase in network engagement comes as Coinbase prepares to launch XRP futures trading, potentially adding significant liquidity to the XRP ecosystem.

    SPONSORED

    Trade XRP with up to 100x leverage on perpetual contracts

    Trade Now on Defx

    Key Network Metrics Signal Growing Adoption

    • Active addresses up 490% since 2022 cycle low
    • Retail participation outpacing institutional involvement
    • Network growth surpassing Bitcoin’s 10% increase
    • Trading volume showing consistent upward trend

    Price Implications and Technical Analysis

    Technical analysis suggests XRP could be preparing for a significant move upward. Crypto analyst Javon Marks projects a potential 4,400% surge to $99, based on historical patterns and the current market structure. This forecast aligns with the breakout from a massive Pennant pattern, with initial resistance at $3.317.

    Frequently Asked Questions

    Why is XRP’s network activity increasing?

    The surge in active addresses indicates growing retail adoption and increased trading activity, potentially driven by positive market sentiment and regulatory clarity.

    What does this mean for XRP’s price?

    Historically, increases in network activity have preceded significant price movements. The current surge could signal an upcoming rally, though market conditions remain volatile.

    How does XRP’s growth compare to Bitcoin?

    XRP’s 490% increase in active addresses significantly outpaces Bitcoin’s 10% growth, suggesting stronger retail interest in XRP during this market cycle.

    Looking Ahead: XRP’s Market Outlook

    While past performance doesn’t guarantee future results, the combination of surging network activity, technical breakout patterns, and increasing institutional interest creates a compelling case for XRP’s potential upside. Investors should monitor key resistance levels and maintain appropriate risk management strategies.

  • Dogecoin Price at Critical $0.157 Support: 25% Drop or Recovery Ahead?

    Dogecoin Price at Critical $0.157 Support: 25% Drop or Recovery Ahead?

    Dogecoin (DOGE) faces a pivotal moment as the leading meme cryptocurrency tests a crucial multi-year support level at $0.157. Technical analysis reveals that DOGE’s next move could determine whether holders face another 25% decline or witness a potential recovery rally.

    Technical Analysis Shows Dogecoin at Make-or-Break Level

    The popular meme coin is currently testing a multi-year trend line dating back to 2021, coinciding with the 0.786 Fibonacci retracement level at $0.167. This technical confluence creates a critical support zone that could determine DOGE’s trajectory for Q2 2025. Recent analysis shows the $0.155 level as vital support, making the current price action particularly significant.

    SPONSORED

    Trade DOGE with up to 100x leverage on perpetual contracts

    Trade Now on Defx

    Key Price Levels and Market Structure

    DOGE has experienced significant bearish pressure, having declined 66% from its December peak above $0.48. The daily chart shows multiple failed attempts to reclaim the downtrend channel after dropping below it on February 24. Key support levels include:

    • Primary support: $0.157 (current multi-year trend line)
    • Secondary support: $0.14 (March 10-11 lows)
    • Critical support: $0.12 (potential 25% downside target)

    Volume Analysis and Technical Indicators

    Trading volume has shown concerning signs of weakness, with declining buy-side pressure making it difficult for DOGE to maintain critical support levels. The weekly EMAs positioned above current price levels suggest sustained bearish momentum, while daily EMAs have become resistance barriers.

    Potential Scenarios and Price Targets

    Two primary scenarios emerge from current market conditions:

    1. Bullish Case: Successfully holding the $0.157 support could trigger a recovery toward the downtrend channel’s lower boundary
    2. Bearish Case: A break below $0.14 could accelerate selling pressure toward $0.12, representing a 25% decline

    FAQs

    Q: What is the key support level for Dogecoin?
    A: The critical support level is at $0.157, which coincides with a multi-year trend line.

    Q: How much has Dogecoin dropped from its recent peak?
    A: DOGE has declined approximately 66% from its December 2024 peak above $0.48.

    Q: What is the worst-case scenario for DOGE price?
    A: A break below $0.14 could trigger a decline to $0.12, representing a further 25% drop.

  • Dogecoin Price Defies Market: Technical Analysis Points to 270% Rally

    Dogecoin Price Defies Market: Technical Analysis Points to 270% Rally

    Dogecoin (DOGE) continues to show remarkable resilience amid broader market uncertainty, with technical indicators suggesting a potential 270% price surge on the horizon. Recent data showing a 10% plunge in profitable DOGE supply may have actually set the stage for a major reversal.

    Technical Analysis Reveals Bullish Setup

    Crypto analyst Javon Marks has identified a critical momentum shift in DOGE’s price action. Following an extended downtrend, the popular meme coin has broken out of its descending trendline resistance while establishing a series of higher lows – a classic bullish pattern that often precedes significant rallies.

    SPONSORED

    Trade DOGE with up to 100x leverage on perpetual contracts

    Trade Now on Defx

    Key Price Targets and Support Levels

    According to the technical analysis:

    • Current price: $0.16
    • First target: $0.653 (270% increase)
    • Extended target: $1.25 (681.25% increase)
    • Critical support: $0.16 (0.796 Fibonacci level)

    Make-or-Break Point Analysis

    Renowned analyst Ali Martinez highlights that DOGE is testing a crucial ascending trendline dating back to 2018. This level coincides with the 0.796 Fibonacci retracement at $0.16, making it a pivotal support zone that could determine the next major move.

    Potential Scenarios

    Scenario Target Probability
    Bullish Break $0.57 – $2.77 High
    Bearish Break $0.06 – $0.0016 Moderate

    FAQ

    Why is Dogecoin showing strength during market weakness?

    The formation of higher lows and break above the descending trendline suggests accumulation by larger players and growing buying pressure despite broader market conditions.

    What could trigger the predicted 270% rally?

    A combination of technical breakout, increased buying volume, and holding above the $0.16 support level could catalyze the projected upward movement.

    What are the key risk factors?

    A break below $0.16 could trigger a cascade of selling, potentially leading to significant downside toward the $0.06 support level.

  • XRP Price Tests Critical $1.97 Support as Trump Tariffs Shake Markets

    XRP Price Tests Critical $1.97 Support as Trump Tariffs Shake Markets

    XRP finds itself at a crucial turning point as the digital asset tests the critical $1.97 support level amid growing market uncertainty. Recent price action shows increasing bearish pressure, with market participants closely monitoring this key psychological level.

    Market Dynamics and Liquidity Concerns

    Renowned crypto analyst Grumlin Mystery has highlighted a concerning trend in market liquidity, pointing to potential further downside for XRP. The analysis suggests that recent U.S. trade policy shifts and Trump’s tariff implementations are creating headwinds for crypto assets, particularly affecting trading volumes and price stability.

    SPONSORED

    Trade XRP with up to 100x leverage on perpetual contracts

    Trade Now on Defx

    Technical Analysis and Price Levels

    The current price action presents two potential scenarios:

    • Bullish Case: A successful defense of $1.96 could trigger a rally toward $2.64
    • Bearish Case: A break below support might lead to tests of $1.70 and $1.34

    Impact of Economic Policy

    Similar to Bitcoin’s recent reaction to trade policy news, XRP faces increased pressure from macroeconomic factors. The uncertainty surrounding U.S. economic policy and its impact on crypto markets remains a key concern for traders.

    FAQ Section

    What are the key support levels for XRP?

    The immediate support lies at $1.96, followed by $1.70 and $1.34.

    How do Trump’s tariffs affect XRP price?

    The tariffs impact market liquidity and risk appetite, potentially leading to decreased trading volumes and price pressure.

    What’s the next major resistance level?

    If bulls regain control, the next significant resistance stands at $2.64.

    Time to Read: 4 minutes

  • Bitcoin Rally Imminent: Fidelity Analyst Predicts Major Price Surge

    Key Takeaways:

    • Fidelity’s research analyst identifies Bitcoin in acceleration phase
    • Dramatic price rally expected as market enters euphoric period
    • Analysis aligns with institutional adoption trends

    Fidelity Digital Assets, one of Wall Street’s most prominent crypto players, has released a bullish analysis suggesting Bitcoin is poised for a significant price surge. Following their recent integration of Bitcoin into retirement plans, the firm’s latest market assessment indicates even more upside potential for the leading cryptocurrency.

    Research Analyst Zack Wainwright from Fidelity Digital Assets has identified that Bitcoin remains in what he terms an ‘acceleration phase’ – a period characterized by heightened volatility and euphoric market sentiment. This phase typically precedes dramatic price appreciation, according to historical patterns.

    Understanding the Acceleration Phase

    The acceleration phase represents a crucial market cycle where institutional and retail interest converge, often leading to exponential price growth. Key characteristics include:

    • Increased institutional adoption
    • Higher trading volumes
    • Enhanced market liquidity
    • Growing mainstream acceptance

    SPONSORED

    Maximize your Bitcoin trading potential with professional-grade tools

    Trade Now on Defx

    Market Implications and Price Discovery

    The potential for Bitcoin to enter price discovery mode suggests we could see unprecedented valuations. This analysis comes at a time when corporate Bitcoin purchases have reached record levels, despite recent market volatility.

    FAQ Section

    Q: What is the acceleration phase in Bitcoin markets?
    A: It’s a period of increased volatility and euphoric sentiment that typically precedes major price rallies.

    Q: How does this align with previous Bitcoin cycles?
    A: Historical data shows acceleration phases often lead to new all-time highs and extended bull runs.

    Q: What role do institutions play in this phase?
    A: Institutional involvement typically increases during acceleration phases, providing additional market liquidity and price support.