Tag: Price Prediction

  • Bitcoin Price Surge: Technical Analysis Points to 62% Rally Target

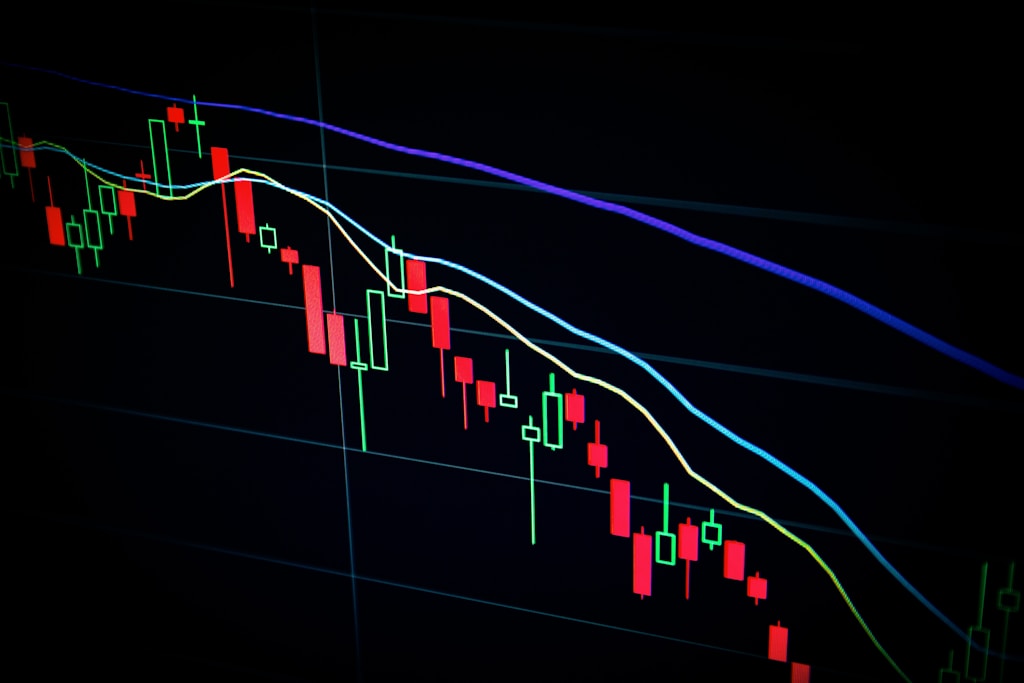
    Bitcoin’s recent price action has set the stage for what could be a massive 62% surge, according to detailed technical analysis that mirrors historical patterns. Following a notable dip triggered by the Trump-Musk feud that caused nearly $1B in liquidations, multiple technical indicators now suggest an imminent bullish breakout.

    Golden Cross Formation Signals Bullish Momentum

    The premier cryptocurrency, currently trading at $104,850, has formed a golden cross pattern as the 50-day simple moving average (50SMA) crosses above the 200-day simple moving average (200SMA). This technical formation, historically a reliable predictor of sustained bull runs, mirrors the setup that preceded Bitcoin’s Q4 2024 rally.

    Technical Confluence Supports Bullish Case

    Market analyst CrypFlow has identified three key technical factors supporting the bullish thesis:

    • Golden cross formation in early June 2025
    • Breakout above major downward trendline from December 2024
    • Price correction pattern matching November 2024’s pre-rally setup

    SPONSORED

    Trade Bitcoin with up to 100x leverage on perpetual contracts

    Trade Now on Defx

    Price Targets and Market Sentiment

    While CrypFlow’s analysis suggests a potential 62% surge to $170,000, the initial conservative target sits at $130,000. This aligns with broader market predictions of a major breakout toward $150,000.

    FAQ Section

    What is triggering Bitcoin’s potential price surge?

    The combination of a golden cross formation, trendline breakout, and historical pattern repetition suggests strong bullish momentum.

    What are the key resistance levels to watch?

    The immediate resistance lies at $111,970 (recent ATH), followed by psychological levels at $130,000 and $150,000.

    How reliable is the golden cross indicator?

    While not guaranteed, the golden cross has historically preceded significant Bitcoin rallies, including the Q4 2024 surge.

    Current market sentiment remains cautiously optimistic, with the Fear & Greed Index at 45 despite recent volatility. Coincodex projections support the bullish outlook, forecasting $134,074 within five days and $155,864 in three months.

  • Bitcoin Golden Cross Pattern Signals $150K Target After $100K Test

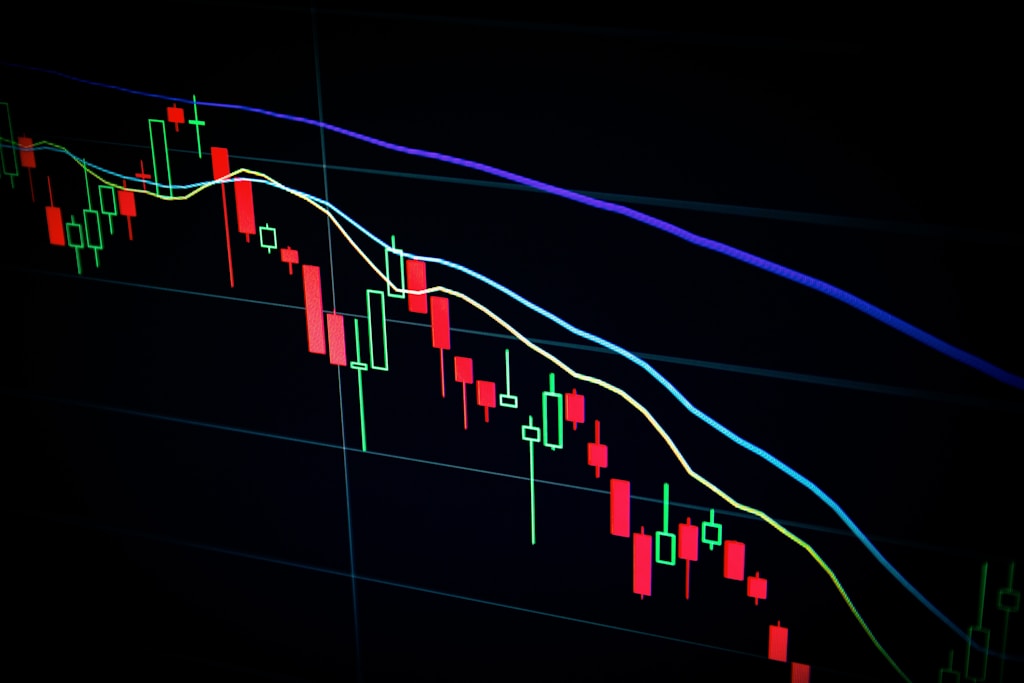
    Bitcoin (BTC) has formed a significant Golden Cross pattern that historically precedes major rallies, suggesting the recent pullback to $100,000 could be setting up for an explosive move to $150,000. Recent market turbulence triggered by the Trump-Musk dispute may actually be creating the perfect setup for Bitcoin’s next leg up.

    Understanding the Golden Cross Formation

    Technical analysis from prominent crypto analyst Chain Mind reveals that Bitcoin’s latest Golden Cross formation closely mirrors the pattern observed in November 2024. Following that cross, BTC experienced a brief 10% correction before launching into a powerful 62% rally. The current market structure shows remarkable similarities, with Bitcoin having dropped 8% after forming the Golden Cross in early June 2025.

    SPONSORED

    Trade Bitcoin with up to 100x leverage on perpetual contracts

    Trade Now on Defx

    Key Price Levels and Projections

    Chain Mind’s analysis projects a potential 51% rally from the current correction bottom, targeting the $150,000-$160,000 range by year-end. This aligns with historical halving data that suggests a major rally toward $180,000 could be in store.

    Critical Support Levels to Watch

    Market expert Crypto Fella identifies the $100,000-$112,049 range as crucial for maintaining bullish momentum. A break below $100,000 could trigger a correction to $95,000-$97,000 levels, representing a 7.66-9.56% decline from current prices.

    Frequently Asked Questions

    What is a Golden Cross in Bitcoin trading?

    A Golden Cross occurs when Bitcoin’s 50-day moving average crosses above its 200-day moving average, typically signaling the start of a major bullish trend.

    How reliable are Golden Cross patterns?

    Historical data shows Golden Cross patterns have preceded significant Bitcoin rallies with roughly 75% accuracy, though past performance doesn’t guarantee future results.

    What could invalidate this bullish scenario?

    A sustained break below the $100,000 support level could invalidate the immediate bullish outlook and trigger a deeper correction.

  • Bitcoin Price Target $150K: Bull Flag Pattern Signals Major Breakout

    Bitcoin Price Target $150K: Bull Flag Pattern Signals Major Breakout

    Bitcoin’s price trajectory is showing strong bullish signals, with a prominent technical analyst identifying a pattern that could propel BTC to $150,000. This analysis comes as Bitcoin network activity reaches new 2025 highs, suggesting growing market momentum despite recent price fluctuations.

    Key Technical Analysis Points to Major Bitcoin Rally

    Chartered Market Technician Tony Severino has identified a compelling bull flag pattern on Bitcoin’s daily chart, suggesting significant upside potential. The pattern, characterized by a strong upward movement followed by consolidation, typically precedes substantial price increases in trending markets.

    SPONSORED

    Maximize your Bitcoin trading potential with up to 100x leverage on perpetual contracts

    Trade Now on Defx

    Technical Indicators Supporting the Bullish Case

    Several key technical indicators are aligning to support this bullish outlook:

    • Bull flag pattern formation on the daily timeframe
    • Bollinger Bands squeeze indicating potential volatility expansion
    • Price holding above critical $105,000 support level
    • Failure to reach lower Bollinger Band suggesting potential ‘head fake’

    Critical Price Levels to Watch

    Traders should monitor these key price levels:

    • Immediate resistance: $111,000
    • Critical support: $101,000
    • Target projection: $150,000

    Market Context and Volume Analysis

    This technical setup gains additional credibility when viewed alongside recent whale accumulation patterns at $104,000, suggesting strong institutional interest at current price levels.

    FAQ Section

    What is a bull flag pattern?

    A bull flag is a technical chart pattern showing a strong upward trend followed by a consolidation period, typically leading to another strong move higher.

    How reliable are these price predictions?

    While technical analysis provides valuable insights, markets can be unpredictable. Always conduct thorough research and manage risk appropriately.

    What could invalidate this bullish scenario?

    A daily close below $101,000 could invalidate the bull flag pattern and suggest a potential trend reversal.

  • Bitcoin Price Forms Cup and Handle Pattern: $120K Target in Sight

    Reading Time: 8 minutes

    Bitcoin’s price action is showing a highly bullish technical formation as the leading cryptocurrency consolidates near $105,000, with the emergence of a cup and handle pattern suggesting significant upside potential. Following similar patterns from the 2024 rally, technical analysts are eyeing a potential surge to $120,000.

    Current Market Status

    As of 8:00 AM Eastern Time:

    • Current Trading Range: $104,881 – $105,266
    • Market Capitalization: $2.08 trillion
    • 24-hour Trading Volume: $24.93 billion
    • 24-hour Range: $103,655 – $105,213

    Technical Analysis: Cup and Handle Formation

    The cup and handle pattern, a bullish continuation pattern, has formed on Bitcoin’s daily chart. This technical formation consists of:

    • A rounded bottom ‘cup’ formation
    • A smaller ‘handle’ consolidation phase
    • Typically signals continuation of the previous uptrend

    SPONSORED

    Trade Bitcoin with up to 100x leverage on perpetual contracts

    Trade Now on Defx

    Market Implications

    The formation of this pattern coincides with several other bullish indicators:

    • Strong institutional buying pressure
    • Decreasing exchange reserves
    • Positive funding rates on major exchanges

    Expert Analysis

    Technical analysts suggest the cup and handle pattern could propel Bitcoin toward the $120,000 level, representing a potential 15% surge from current levels. This aligns with recent whale accumulation patterns at the $104,000 level.

    FAQ Section

    What is a cup and handle pattern?

    A cup and handle is a technical chart pattern resembling a cup with a handle, typically indicating a bullish continuation pattern in uptrends.

    What is the predicted price target?

    Based on the current pattern, technical analysts project a potential move to $120,000, measuring from the pattern’s breakout point.

    How reliable is this pattern?

    Cup and handle patterns have historically shown around 65% reliability in crypto markets, particularly during bull market conditions.

    Risk Considerations

    Investors should note potential risks:

    • Pattern invalidation below $103,000
    • General market volatility
    • Macro economic factors

    Conclusion

    The emergence of this cup and handle pattern, combined with strong market fundamentals and institutional interest, suggests Bitcoin could be preparing for its next major move. Traders should monitor key support levels and volume patterns for confirmation of the pattern’s validity.

  • Dogecoin Price Enters Final Parabolic Stage: $1 Target by Year End

    Dogecoin (DOGE) has entered a critical technical phase that could propel the leading meme coin to unprecedented heights. According to detailed analysis from crypto expert Trader Tardigrade, DOGE has initiated the fourth and final stage of a parabolic curve pattern – historically a precursor to explosive price action that could drive the asset toward the elusive $1 mark.

    Breaking Down Dogecoin’s Parabolic Setup

    The technical structure shows Dogecoin completing three distinct bases, with the recent breakout from Base 3’s Falling Wedge pattern marking entry into the terminal phase. This setup mirrors previous historical patterns that preceded major DOGE rallies, lending credibility to the bullish outlook.

    Key technical levels to watch:

    • Current Price: $0.17
    • Critical Liquidity Zone: $0.187
    • Initial Resistance: $0.20
    • Year-End Target: $1.70

    Market Context and Price Action

    The timing of this technical development is particularly noteworthy as recent market turbulence has tested DOGE holders’ resolve. Despite a 14.14% weekly decline and elevated volatility readings of 8.69%, the parabolic structure remains intact.

    SPONSORED

    Trade DOGE with up to 100x leverage and maximize your potential returns

    Trade Now on Defx

    Technical Analysis Deep Dive

    The parabolic curve formation consists of four distinct phases:

    1. Base 1: Initial accumulation phase (completed)
    2. Base 2: First breakout and consolidation (completed)
    3. Base 3: Falling Wedge formation (recently broken)
    4. Base 4: Final acceleration phase (current)

    Expert Insights and Predictions

    Trader Tardigrade’s analysis suggests the $0.187 liquidity zone could serve as a springboard for the next major move. The projected trajectory indicates potential for a surge above $1.70 before year-end, representing a historic milestone for the meme coin.

    Frequently Asked Questions

    What is a parabolic curve pattern?

    A parabolic curve pattern is a technical formation showing accelerating momentum through multiple bases, typically resulting in explosive price movement in the final phase.

    Why is Base 4 significant?

    Base 4 represents the final stage of the pattern where price action typically sees its steepest appreciation, driven by increased buying pressure and market sentiment.

    What could prevent DOGE from reaching $1?

    Key risks include broader market volatility, regulatory changes, or breakdown of technical structure below key support levels.

    As the crypto market navigates through uncertain territory, Dogecoin’s technical setup presents a compelling case for potential upside. Traders should maintain proper risk management while monitoring key technical levels and market sentiment indicators.

  • XRP Price Wave Analysis Points to $4 Target: Key Levels Revealed

    XRP’s price structure is showing a compelling wave formation that could signal an imminent surge to $4, according to leading crypto analysts. Currently trading at $2.13, XRP’s technical patterns suggest significant volatility ahead as the asset positions for a potential all-time high retest.

    Elliott Wave Structure Signals Major XRP Movement

    Certified Elliott Wave analyst XForceGlobal has identified a complex wave formation on XRP’s chart that suggests the digital asset is preparing for its next major move. The analysis reveals a particularly noteworthy pattern – a double zigzag (W-X-Y) formation that demonstrates remarkable symmetry across multiple wave degrees.

    As noted in recent market analysis showing bearish signs after XRP’s 4-day rally, the current price action is at a critical juncture. However, the new wave structure suggests that bearish pressure may be subsiding.

    SPONSORED

    Trade XRP with up to 100x leverage on perpetual contracts

    Trade Now on Defx

    Critical Price Levels and Fibonacci Alignments

    The technical analysis highlights several key price levels that traders should monitor:

    • Current accumulation zone: $1.84 – $2.25
    • First resistance target: $3.20 – $3.80
    • Ultimate price target: $4.00+

    These levels align with classic Fibonacci extension points, particularly the 61.8% and 100% retracements, adding credibility to the projected price targets.

    Alternative Scenario: The $50 Projection

    In a more ambitious forecast, crypto analyst ‘Steph is Crypto’ suggests XRP could reach $50 within 3-6 months, representing a potential 2,280% increase. While this projection appears extremely optimistic, it’s predicated on XRP first breaking above the $2.50 resistance level.

    Frequently Asked Questions

    Q: What is the immediate support level for XRP?
    A: The current critical support zone lies between $1.84 and $2.25.

    Q: When could XRP reach the $4 target?
    A: Based on the wave structure analysis, this could occur within the next market cycle, though specific timing remains uncertain.

    Q: What are the key resistance levels to watch?
    A: The primary resistance levels are $2.50, followed by the $3.20-$3.80 zone.

    Traders should maintain strict risk management practices given the potential for increased volatility as these wave patterns unfold.

  • Bitcoin Price Target $250K by 2025: Tim Draper Predicts Dollar’s End

    Bitcoin Price Target $250K by 2025: Tim Draper Predicts Dollar’s End

    Venture capitalist Tim Draper has reaffirmed his bold Bitcoin price prediction of $250,000 by the end of 2025, while making an even more striking claim about the potential end of the US dollar’s dominance. This forecast comes amid significant institutional adoption and regulatory developments in the crypto sector.

    Draper’s Bitcoin Price Prediction: Analysis and Context

    In a recent post on X, Draper doubled down on his long-standing Bitcoin price target, suggesting that BTC could potentially go “infinite against the dollar.” This prediction gains particular significance when viewed alongside growing institutional adoption of Bitcoin as a treasury asset, indicating a broader shift in how traditional finance views cryptocurrency.

    SPONSORED

    Trade Bitcoin with up to 100x leverage and maximize your profit potential

    Trade Now on Defx

    Key Drivers Behind the Prediction

    • Political Developments: Trump’s Media & Technology Group’s Bitcoin ETF filing
    • Regulatory Progress: GENIUS Act advancement with 66-32 Senate vote
    • Institutional Adoption: JP Morgan’s plans for Bitcoin collateral acceptance
    • Technological Advancement: Layer 2 solutions and Web3 integration

    Institutional Support and Market Impact

    The prediction gains credibility from JPMorgan’s recent move to accept Bitcoin as collateral, potentially opening floodgates for institutional investment. Strategy’s holdings of 580,000 BTC, valued at approximately $61 billion, further demonstrate growing institutional confidence.

    Technical and Regulatory Landscape

    The cryptocurrency ecosystem has evolved significantly since Draper’s initial prediction in 2018. Recent developments in Layer 2 solutions and regulatory clarity through the Digital Asset Market Clarity Act of 2025 provide a more robust foundation for his forecast.

    FAQ Section

    What makes the $250,000 Bitcoin price target realistic?

    The target is supported by increasing institutional adoption, regulatory clarity, and technological advancement in the Bitcoin ecosystem.

    When does Tim Draper expect Bitcoin to reach $250,000?

    Draper maintains his prediction for Bitcoin to reach $250,000 by December 31, 2025.

    What could prevent Bitcoin from reaching this target?

    Potential obstacles include regulatory challenges, market volatility, and macroeconomic factors affecting risk assets.

  • Ethereum Price Prediction: Myriad Markets Traders Bet on ETH Rally

    Prediction markets are signaling bullish sentiment for Ethereum as traders on Myriad Markets place significant bets on ETH’s future price movements. This comes amid broader market speculation involving high-profile figures and major sporting events.

    Key Predictions from Myriad Markets

    Myriad Markets, a decentralized prediction platform, has become the focal point of several major market forecasts, with Ethereum’s price trajectory taking center stage. This aligns with recent analysis showing that Ethereum’s price pattern signals a potential massive rally ahead.

    Ethereum Price Outlook

    Market participants are actively trading on Ethereum’s future performance, with significant capital being deployed to back these predictions. Technical indicators suggest a potential continuation of the upward trend, supported by increasing institutional interest and network fundamentals.

    Musk-Trump X Platform Drama

    A notable prediction market has emerged around the potential removal of former President Trump from X (formerly Twitter) by Elon Musk. This situation has particular relevance to crypto markets, as previous interactions between Trump and Musk have significantly impacted crypto prices.

    SPONSORED

    Trade Ethereum with up to 100x leverage and maximize your profit potential

    Trade Now on Defx

    French Open Market Impact

    The integration of sports betting markets alongside crypto predictions demonstrates the expanding scope of decentralized prediction platforms, potentially driving broader adoption of crypto trading mechanisms.

    FAQ Section

    What is Myriad Markets?

    Myriad Markets is a decentralized prediction market platform where users can trade on various outcomes, from crypto prices to real-world events.

    How do prediction markets influence crypto prices?

    Prediction markets can serve as leading indicators for price movements by aggregating collective market sentiment and wisdom.

    What factors are driving Ethereum predictions?

    Current predictions are influenced by technical analysis, network upgrades, institutional adoption, and broader market conditions.

  • Dogecoin Price Must Break $0.40 or Face Extended Bear Market

    Dogecoin (DOGE) faces a critical juncture as prominent analyst VisionPulsed warns that the popular memecoin must break above $0.40 in the coming weeks to maintain its bullish structure. This analysis comes amid mounting pressure after five consecutive months of losses since January 2025.

    The technical outlook draws particular attention to Ethereum’s momentum indicators, which VisionPulsed believes could signal broader market movements. The analyst highlighted consecutive “blue bars” on ETH’s oscillator that historically preceded significant price action. This technical setup mirrors patterns seen during previous DOGE price corrections, suggesting a potential correlation between ETH momentum and DOGE price action.

    Critical Price Levels and Timing Model

    At the heart of VisionPulsed’s analysis is a 70-day timing model that has accurately predicted previous Dogecoin rallies. The model suggests June 14 as a pivotal date for potential price movement, with the analyst noting that “every major upswing in Dogecoin during this cycle has come 60 to 80 days after a bottom.”

    SPONSORED

    Trade DOGE with up to 100x leverage and maximize your profit potential

    Trade Now on Defx

    Market Structure Analysis

    The current market structure presents a complex picture. While Bitcoin trades near cycle highs, Dogecoin remains significantly below its yearly peak – a divergence that VisionPulsed interprets as potential stored energy for a dramatic move. Technical indicators, including narrowing Bollinger Bands and declining on-chain activity, suggest building momentum.

    Potential Scenarios and Price Targets

    Two distinct scenarios emerge from the analysis:

    • Bullish Case: A break above $0.40 could trigger a substantial rally, potentially coinciding with ETH reaching $3,200-$4,200
    • Bearish Case: Failure to breach $0.40 could result in extended downside, with June, July, and September all potentially showing negative returns

    FAQ Section

    What makes $0.40 such a critical level for Dogecoin?

    This price point represents a major technical resistance level and coincides with previous support zones from earlier in the cycle.

    How does Bitcoin’s performance affect Dogecoin’s prospects?

    Historical data shows that Bitcoin’s breakouts typically lead to delayed but amplified moves in Dogecoin, particularly during bull markets.

    What technical indicators support the current analysis?

    Key indicators include Bollinger Band compression, declining on-chain activity, and the 70-day timing model derived from previous cycle lows.

    At time of writing, DOGE trades at $0.189, with immediate resistance at $0.25 and major resistance at the crucial $0.40 level.

  • XRP Price Target Hits $21 as Fibonacci Analysis Shows 800% Upside

    XRP Price Target Hits $21 as Fibonacci Analysis Shows 800% Upside

    XRP’s price trajectory is showing renewed momentum as technical analysis points to a potential 800% surge, with the next major target sitting at the crucial 1.618 Fibonacci level of $21. This ambitious projection comes as XRP continues to show strength despite recent market compression, suggesting a powerful breakout could be imminent.

    Technical Analysis Reveals Historical Pattern Repetition

    Renowned crypto analyst Javon Marks has identified striking similarities between XRP’s current market structure and its historical price action, particularly focusing on two major symmetrical triangle formations. The first preceded XRP’s explosive 2017 rally, while the second formation has just completed with a fresh breakout in 2024.

    SPONSORED

    Trade XRP with up to 100x leverage and maximize your profit potential

    Trade Now on Defx

    Key Price Levels and Fibonacci Extensions

    The analysis highlights several critical price levels:

    • Current price: $2.23
    • Recent high: $3.31 (1.0 Fibonacci level)
    • Next target: $21 (1.618 Fibonacci Extension)
    • Ultimate target: $152 (2.272 Fibonacci level)

    Community Response and Market Skepticism

    While some community members have embraced these bullish projections, others remain skeptical. Critics suggest more conservative targets between $13-$20, citing market fundamentals and historical resistance levels. Recent developments in the XRP ETF space could provide additional catalysts for price movement.

    FAQ Section

    What is the timeframe for XRP reaching $21?

    Analysts suggest this target could be reached by late 2025 or early 2026, depending on market conditions and broader crypto adoption.

    What factors could prevent XRP from reaching these targets?

    Regulatory challenges, market volatility, and overall crypto market conditions could impact XRP’s ability to reach these price levels.

    How reliable are Fibonacci extensions for price prediction?

    While Fibonacci levels are widely used in technical analysis, they should be considered alongside other indicators and market fundamentals for comprehensive price analysis.