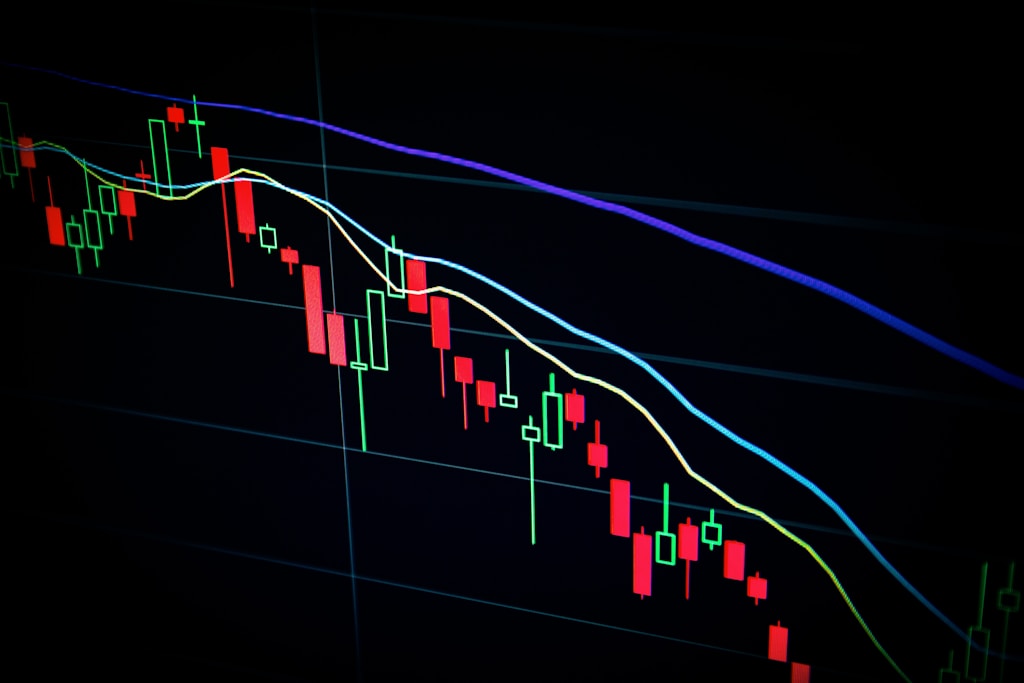
Shiba Inu (SHIB) faces a critical technical setup as multiple analysts identify bearish patterns that could trigger a significant price decline. This analysis comes amid broader volatility in the meme coin market, which has seen dramatic shifts in June 2025.
Technical Analysis Points to Bearish Momentum
Crypto analyst Smart Trading has identified a concerning triangle formation in SHIB’s price action, suggesting an imminent 20% downward movement. The breakdown below the triangle pattern after consolidation near key resistance levels presents a clear bearish signal for traders.
Key price levels to monitor:
- Current resistance: $0.00001396
- Critical support: $0.00001041
- Current price: $0.00001322
Multiple Analysts Confirm Bearish Outlook
Paper Trader’s analysis aligns with the bearish sentiment, noting SHIB’s precarious position in a demand zone. The analyst suggests that failure to hold above $0.00001300 could trigger a cascade of selling pressure toward $0.00001100.
Contrarian View: Potential Bottom Formation
However, analyst GKTrademanthan presents a contrarian perspective, identifying a potential bottom formation through a four-stage pattern analysis:
- Falling wedge (completed)
- Cup and Handle pattern (completed)
- W Pattern (completed)
- Inverted Head and Shoulders (pending)
Market Performance Context
SHIB’s current struggles reflect broader market challenges, with the token down 38% year-to-date. Despite this decline, the meme coin maintains its position as the 19th largest cryptocurrency by market capitalization.
FAQ Section
What is causing Shiba Inu’s current price decline?
Technical analysis suggests a breakdown from a triangle pattern, combined with broader market weakness and declining meme coin momentum.
What are the key support levels to watch?
The critical support level is at $0.00001041, with an intermediate support at $0.00001100.
Is there any bullish case for SHIB?
Yes, some analysts identify a potential bottom formation through pattern analysis, suggesting a possible 90% upside to $0.00002431 if certain technical conditions are met.


