Tag: Sol/usd

  • Solana Price Plunges Below $160: Key Support Levels for SOL Recovery

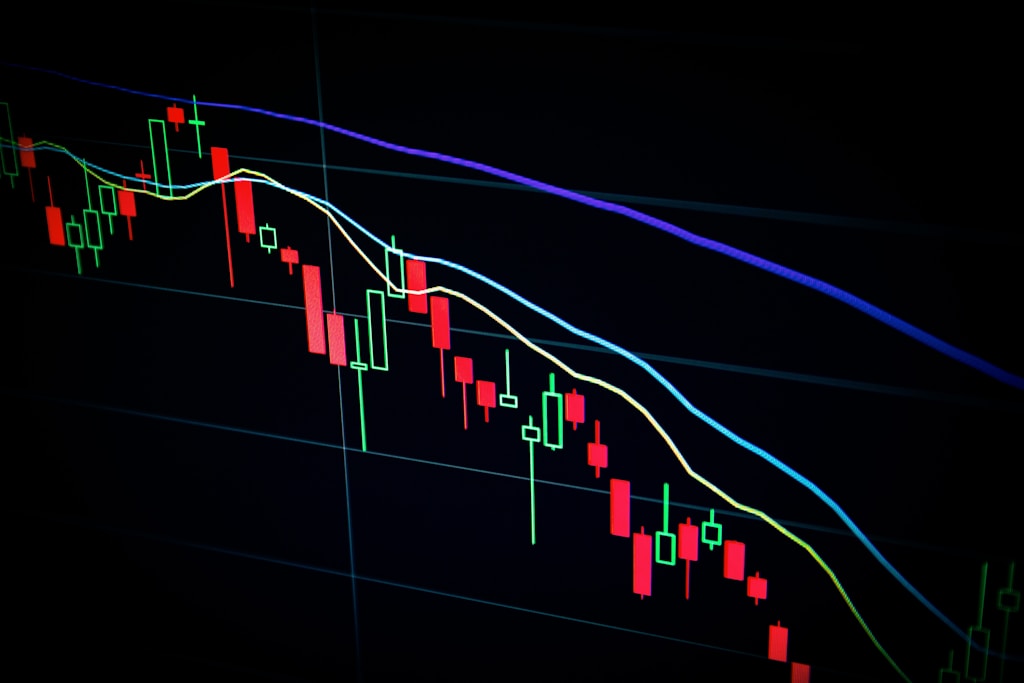
    Solana (SOL) continues its bearish momentum as the price drops sharply from the $172 resistance zone, leaving investors wondering about potential recovery scenarios. As the broader crypto market faces pressure, with Bitcoin testing critical support at $103K, SOL’s price action demands close attention.

    SOL Price Analysis: Technical Breakdown

    The recent price action shows SOL struggling to maintain momentum above key support levels:

    • Initial rejection at $172 resistance zone
    • Price trading below the crucial 100-hourly SMA
    • Formation of a bearish trend line at $160
    • Current support zone between $152-$155

    SPONSORED

    Trade SOL with up to 100x leverage on perpetual contracts

    Trade Now on Defx

    Critical Support and Resistance Levels

    For traders looking to capitalize on SOL’s next move, these key levels deserve attention:

    Resistance Levels:

    • Primary resistance: $160 (trend line)
    • Secondary resistance: $165 (50% Fib level)
    • Major resistance: $170-$172 zone

    Support Levels:

    • Immediate support: $155
    • Critical support: $152
    • Major support: $145
    • Last resort support: $132

    Technical Indicators Signal Bearish Momentum

    Current technical indicators paint a concerning picture for SOL:

    • MACD: Gaining momentum in bearish territory
    • RSI: Trading below 50, indicating bearish control
    • Moving Averages: Price below 100-hourly SMA

    Recovery Scenarios and Price Targets

    For SOL to initiate a recovery, these conditions must be met:

    1. Break above $160 resistance line
    2. Clear the $165 Fibonacci level
    3. Establish support above $170

    FAQ: Solana Price Action

    Q: What’s causing Solana’s current price decline?
    A: The decline appears technical in nature, following rejection at $172 and broader market pressure.

    Q: What’s the most important support level for SOL?
    A: The $152 level represents critical support, with $145 serving as the next major support zone.

    Q: Can SOL recover in the short term?
    A: Recovery depends on clearing the $160 resistance and maintaining momentum above this level.

    Conclusion: Watch These Levels

    While SOL faces immediate bearish pressure, the $152-$155 support zone remains crucial for preventing further decline. Traders should monitor the $160 resistance level for potential recovery signals, while maintaining stop losses below $145 for risk management.
  • Solana Price Alert: SOL Tests Critical $160 Support After 11% Drop

    Solana (SOL) is facing a crucial test of support levels after dropping 11% from recent highs, with technical indicators suggesting further downside potential. This analysis examines key price levels and potential scenarios for SOL traders.

    Key Takeaways:

    • SOL price declined sharply from $180 resistance zone
    • Critical support established at $160 level
    • Technical indicators show bearish momentum building
    • Recovery faces multiple resistance levels between $169-$172

    Current Market Context

    In contrast to Bitcoin’s recent consolidation at $112K, Solana has shown significant weakness in the past 24 hours. The decline began after failing to breach the psychological $180 level, with bears taking control of the market momentum.

    SPONSORED

    Trade Solana with up to 100x leverage on perpetual contracts

    Trade Now on Defx

    Technical Analysis Deep Dive

    The hourly chart reveals several critical technical developments:

    • Price trading below 100-hourly SMA
    • Bearish trend line resistance at $170
    • 23.6% Fibonacci retracement level breached
    • RSI indicating oversold conditions

    Support and Resistance Levels

    Type Level Significance
    Major Support $160 Critical psychological level
    Secondary Support $155 Previous consolidation zone
    Major Resistance $170 Trend line + SMA confluence
    Key Resistance $180 Recent rejection point

    Potential Scenarios

    Two primary scenarios emerge from current market conditions:

    Bullish Case

    • Break above $170 could trigger recovery
    • Next targets: $172, $180, and potentially $200
    • Requires increased buying volume

    Bearish Case

    • Break below $160 could accelerate selling
    • Support at $155 and $142 become critical
    • Technical indicators support this scenario

    FAQ

    Q: What’s causing Solana’s current price decline?
    A: Technical rejection at $180 combined with broader market uncertainty has triggered profit-taking.

    Q: Where is the next major support level?
    A: $160 represents crucial support, with $155 acting as secondary support.

    Q: What would signal a trend reversal?
    A: A clear break above $170 with increased volume would suggest potential recovery.

    Conclusion

    Solana’s price action suggests caution is warranted in the short term. While the $160 support remains crucial, traders should watch for clear breakout signals before taking positions. The next 24-48 hours could determine SOL’s medium-term trajectory.

  • Solana Price Holds $168 Support: SOL Eyes Breakout to $180

    Solana Price Holds $168 Support: SOL Eyes Breakout to $180

    Solana (SOL) continues to show resilience in the cryptocurrency market, maintaining crucial support above $168 as traders await a potential breakout. The latest technical analysis reveals a compelling setup that could propel SOL towards the $180 mark, with several key indicators suggesting bullish momentum.

    Key Solana Price Levels to Watch

    SOL has established a strong foundation above the $160 support zone, demonstrating impressive market strength amid broader crypto market fluctuations. The asset is currently trading above several critical technical levels:

    • Current Price: $168
    • Key Support: $165
    • Major Resistance: $172
    • 100-hour SMA: Holding above

    In a significant technical development, despite recent SEC delays on Solana ETF decisions, SOL has maintained its upward trajectory, breaking above a bearish trend line at $167.

    SPONSORED

    Trade Solana with up to 100x leverage on perpetual contracts

    Trade Now on Defx

    Technical Analysis Deep Dive

    The current price action shows several bullish indicators:

    • Fibonacci Retracement: Price above 50% level from $177 high to $160 low
    • RSI: Maintaining position above 50, indicating sustained buying pressure
    • MACD: Showing bullish momentum despite slight deceleration

    Potential Scenarios and Price Targets

    Two primary scenarios are emerging for SOL’s near-term price action:

    Bullish Scenario

    • Break above $172 resistance
    • Next target: $176
    • Major resistance: $180
    • Extended target: $192-$200 range

    Bearish Scenario

    • Support at $168
    • Critical level: $165
    • Risk zone: $162
    • Major support: $150

    Market Impact and Trading Implications

    The current consolidation phase suggests accumulation, with institutional interest remaining strong. Traders should watch for a decisive break above $172, which could trigger a significant rally toward $180.

    FAQ

    Q: What is the key resistance level for Solana?
    A: The immediate resistance is at $172, with major resistance at $180.

    Q: Where is the critical support level?
    A: The critical support level is at $165, with secondary support at $162.

    Q: What technical indicators support a bullish outlook?
    A: The RSI above 50, price above 100-hour SMA, and broken bearish trend line all suggest bullish momentum.

    Technical Indicators Summary

    • MACD: Bullish zone (showing slight deceleration)
    • RSI: Above 50 (bullish)
    • Moving Averages: Trading above 100-hour SMA
    • Key Support: $165, $162
    • Key Resistance: $172, $176
  • Solana Price Finds Support at $172: SOL Rally Could Resume to $200

    Solana Price Finds Support at $172: SOL Rally Could Resume to $200

    Solana (SOL) has established crucial support at $172, setting the stage for what could be a significant upward movement in the coming days. Recent technical analysis suggests a potential $360 target if this key support level continues to hold.

    Key Technical Developments for SOL

    • SOL price successfully broke above $160 and $165 resistance levels
    • Current trading activity near $175 and the 100-hourly SMA indicates strength
    • Formation of a bullish flag pattern with $172 support suggests accumulation
    • Major resistance levels established at $180 and $185

    SPONSORED

    Trade Solana with up to 100x leverage on perpetual contracts

    Trade Now on Defx

    Technical Analysis Deep Dive

    The recent price action shows SOL forming a strong base above $155, mirroring the broader market’s bullish sentiment. After establishing this foundation, SOL demonstrated impressive momentum by breaking through multiple resistance levels.

    Key Support and Resistance Levels

    Support Levels Resistance Levels
    $172 $178
    $170 $180
    $162 $185

    Bullish Scenario and Potential Targets

    If SOL maintains its position above $172, the next significant move could target the $180-$185 range. A successful breach above $185 could accelerate the momentum toward $200, with $192 serving as an intermediate resistance level.

    Risk Factors to Consider

    Despite the bullish outlook, traders should monitor several risk factors:

    • RSI indicating slight bearish divergence below 50
    • MACD showing decreased momentum in the bullish zone
    • Potential support breakdown below $170 could trigger a move to $162

    FAQ Section

    What is the next major resistance level for Solana?

    The next major resistance level for Solana is at $180, followed by a stronger resistance at $185.

    Conclusion

    Solana’s current technical setup suggests a potentially strong continuation of its upward trend, provided the $172 support level holds. Traders should watch for a decisive break above $180 as confirmation of the next leg up toward $200.

  • Solana Price Analysis: SOL Tests $122 Support as Bulls Eye $132 Breakout

    Solana Price Analysis: SOL Tests $122 Support as Bulls Eye $132 Breakout

    Solana (SOL) is showing mixed signals as the cryptocurrency tests critical support levels following a recent decline. Similar to Bitcoin’s recent price action at $83K, SOL traders are closely watching key technical levels that could determine the next major move.

    Key Solana Price Levels to Watch

    The latest technical analysis reveals several critical price points for SOL:

    • Current support: $122-124 range
    • Key resistance: $126, $128, and $132
    • Previous swing high: $140
    • Risk level: $115-102 zone

    Technical Analysis Deep Dive

    SOL’s price action shows a complex technical setup with multiple factors at play:

    • Formation of a rising channel with $124 support
    • Trading below the 100-hourly SMA
    • 23.6% Fibonacci retracement test from $140 high to $122 low
    • RSI holding above 50, suggesting maintained bullish momentum

    SPONSORED

    Trade Solana with up to 100x leverage on perpetual contracts

    Trade Now on Defx

    Bullish Scenario

    For SOL to initiate a recovery:

    • Must break above $126 immediate resistance
    • Clear $132 for confirmed trend reversal
    • Potential targets: $136 and $142

    Bearish Scenario

    Downside risks include:

    • Break below $122 support could trigger selloff
    • Next major support at $115
    • Worst case scenario points to $102

    Expert Analysis

    Technical indicators suggest a cautious outlook:

    • MACD showing bearish momentum
    • RSI above 50 provides some optimism
    • Volume profile indicates consolidation phase

    FAQ

    What is the next major resistance for Solana?

    The next significant resistance level is at $132, followed by $136.

    Could SOL drop below $100?

    While possible, it would require breaking multiple support levels, with $102 being a crucial bottom.

    What technical indicators are most relevant for SOL right now?

    The MACD and RSI are key indicators, with the rising channel formation providing important support/resistance levels.

  • Solana (SOL) Price Faces $150 Resistance: Key Levels to Watch

    Solana (SOL) is showing mixed signals as the cryptocurrency attempts to break through significant resistance levels. As previously reported, SOL’s recent rally above $137 suggested strong upside potential, but new technical barriers have emerged.

    SOL Price Action: Technical Analysis

    The cryptocurrency initiated a recovery wave from the $125 support zone, demonstrating resilience in the broader market context. Key technical indicators show:

    • Current trading range: Above $130 and the 100-hourly SMA
    • Bullish trend line support: Established at $134
    • Critical resistance levels: $142, $145, and $150
    • Major support zones: $135 and $133

    Key Resistance Levels in Focus

    The immediate price action faces several hurdles:

    • Primary resistance: $140-$142 zone
    • Secondary resistance: $145 level
    • Major psychological barrier: $150 mark

    SPONSORED

    Trade Solana with up to 100x leverage on perpetual contracts

    Trade Now on Defx

    Potential Downside Scenarios

    If SOL fails to breach the $142 resistance:

    • Initial support: $135 zone (50% Fib retracement level)
    • Critical support: $133 level
    • Worst-case scenario: Potential decline to $114

    Technical Indicators Overview

    Indicator Status
    MACD Losing bullish momentum
    RSI Below 50 level
    Moving Averages Above 100-hourly SMA

    FAQ

    Q: What is the next major resistance level for Solana?
    A: The next significant resistance level is at $150, with intermediate barriers at $142 and $145.

    Q: Where is the strongest support level for SOL?
    A: The strongest support level is established at $133, with additional support at $135.

    Q: What technical indicators should traders watch?
    A: Traders should monitor the MACD, RSI, and the 100-hourly SMA for potential trend reversals.

  • Solana Price Smashes $137: SOL Rally Signals 90% Upside Potential

    Solana Price Smashes $137: SOL Rally Signals 90% Upside Potential

    Solana (SOL) has achieved a significant breakthrough, surging past the critical $137 resistance level in a move that has caught the attention of crypto traders and investors alike. As recent analysis predicted a critical test at $144, SOL’s current momentum suggests this target could be reached sooner than expected.

    Technical Analysis: Breaking Down SOL’s Momentum

    The breakthrough above $137 represents more than just a number – it’s a crucial psychological barrier that has repeatedly capped SOL’s price action in recent months. This resistance-turned-support level now provides a strong foundation for further upside movement, with technical indicators painting a bullish picture:

    • Trading volume has surged over 100% during this breakout
    • RSI readings at 69% indicate strong momentum while leaving room for further gains
    • Moving averages show strong bullish convergence

    SPONSORED

    Trade Solana with up to 100x leverage and maximize your profit potential

    Trade Now on Defx

    Key Price Targets and Support Levels

    With the successful breach of $137, traders are now eyeing several key resistance levels:

    Price Target Significance
    $164 Immediate resistance
    $211 Major psychological level
    $240-$260 Previous all-time high zone

    Risk Factors and Support Zones

    While the outlook remains bullish, traders should monitor these key support levels:

    • $137 – New support level (previous resistance)
    • $118 – Secondary support
    • $99 – Major support zone

    FAQ Section

    What’s driving Solana’s current price surge?

    The rally is supported by increased trading volume, strong technical indicators, and growing institutional interest in SOL’s ecosystem.

    Could Solana reach its all-time high in 2025?

    Technical analysis suggests a potential path to the $240-$260 range, though this would require sustained buying pressure and favorable market conditions.

    What are the key risk factors for SOL’s price?

    Major risks include potential market-wide corrections, technical resistance at $164, and possible profit-taking at psychological price levels.