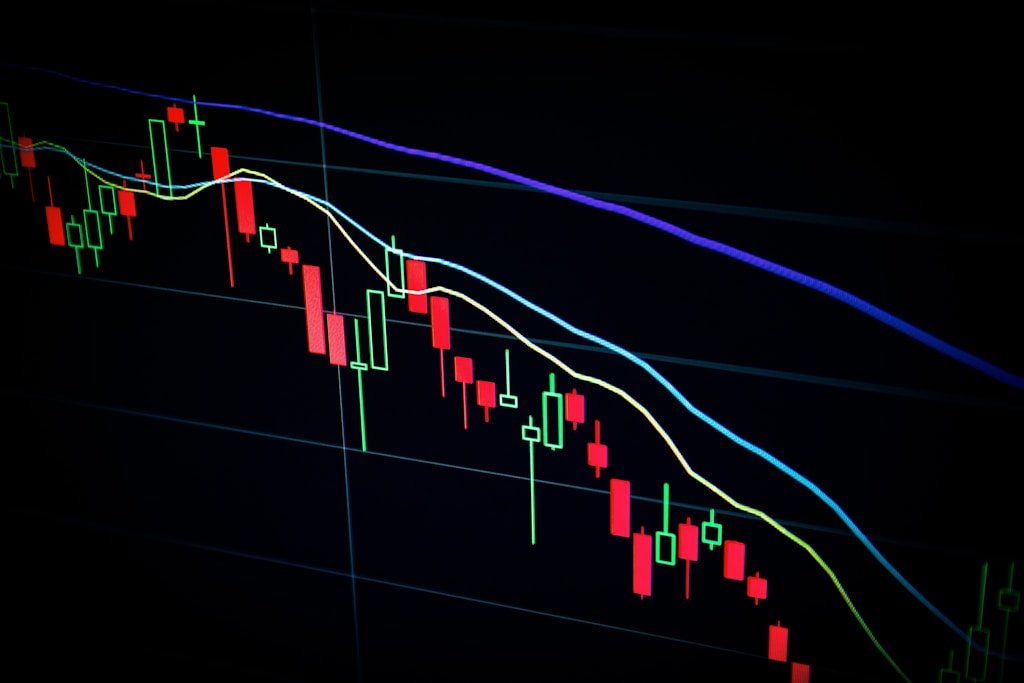
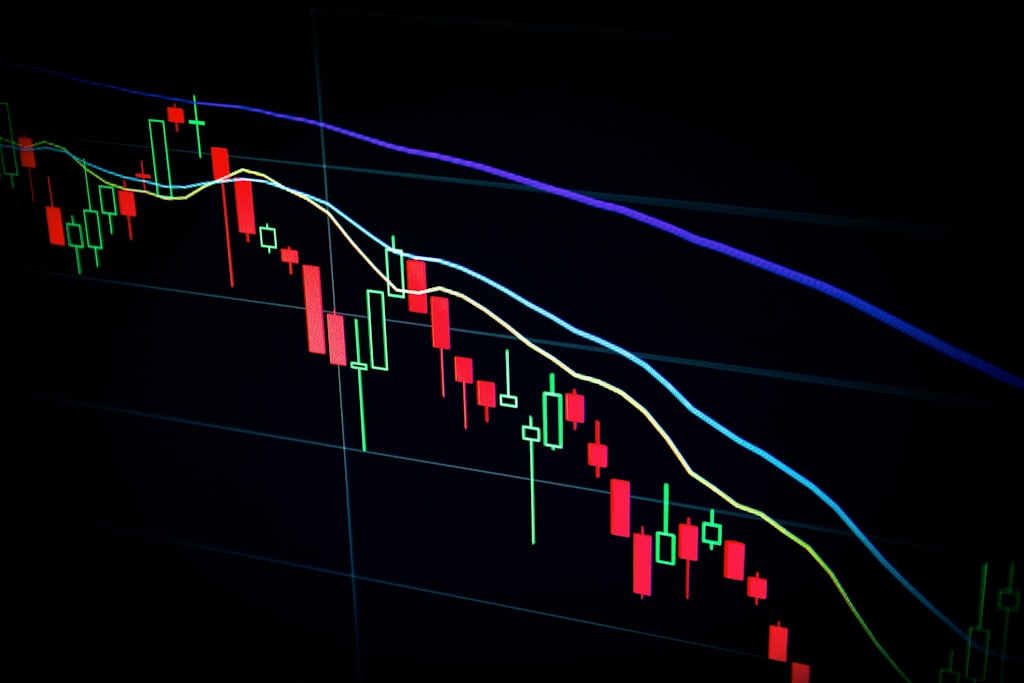
Solana (SOL) is showing remarkable resilience amid broader market turbulence, with a key technical indicator flashing a potential buy signal that could precede a significant rally. The TD Sequential indicator, a reliable predictor of trend reversals, has printed a buy signal on SOL’s daily chart as the asset stabilizes above crucial support levels.
In a market environment shaken by recent volatility, as evidenced by the massive $970M liquidation event triggered by the Trump-Musk dispute, Solana’s ability to hold above $145 suggests underlying strength in its market structure.
Technical Analysis Points to Potential Reversal
The cryptocurrency is currently trading at $148.44, having corrected 20% from its May peak above $180. Despite this retracement, several technical factors suggest a bullish setup could be forming:
- TD Sequential buy signal on the daily timeframe
- Price holding above the 100-day moving average ($144.68)
- Muted volume during the recent selloff indicating lack of panic
- Strong support zone established between $144-$145
Key Price Levels to Watch
For traders looking to capitalize on this potential reversal, several critical price levels deserve attention:
- Immediate resistance: $159.35 (34-day EMA)
- Secondary resistance: $159.33 (50-day SMA)
- Major resistance zone: $160-$180
- Critical support: $144-$145
- 200-day SMA: $177.49
Market Outlook and Trading Strategy
While the broader crypto market shows signs of uncertainty, Solana’s technical setup suggests potential for a recovery rally. A daily close above the 34-day EMA could trigger momentum toward $160, while maintaining support above $145 remains crucial for the bullish scenario to play out.
FAQ Section
Q: What is the TD Sequential indicator?
A: It’s a technical analysis tool that helps identify potential price reversals by counting specific candle patterns.
Q: Why is the $145 level significant for Solana?
A: This price point represents a key technical support level where buyers have historically defended the price, making it a crucial area for maintaining bullish momentum.
Q: What could invalidate the bullish scenario?
A: A decisive break below $144 could trigger further downside movement and potentially invalidate the current bullish setup.

